
|
|||||
|
 | |
| |
| |
| |
| |
| |
|
Gene: TFB2M |
Gene summary for TFB2M |
| Gene information | Species | Human | Gene symbol | TFB2M | Gene ID | 64216 |
| Gene name | transcription factor B2, mitochondrial | |
| Gene Alias | Hkp1 | |
| Cytomap | 1q44 | |
| Gene Type | protein-coding | GO ID | GO:0000154 | UniProtAcc | Q9H5Q4 |
Top |
Malignant transformation analysis |
| Identification of the aberrant gene expression in precancerous and cancerous lesions by comparing the gene expression of stem-like cells in diseased tissues with normal stem cells |
| Entrez ID | Symbol | Replicates | Species | Organ | Tissue | Adj P-value | Log2FC | Malignancy |
| 64216 | TFB2M | LZE4T | Human | Esophagus | ESCC | 6.92e-03 | 2.18e-01 | 0.0811 |
| 64216 | TFB2M | LZE24T | Human | Esophagus | ESCC | 1.31e-09 | 2.00e-01 | 0.0596 |
| 64216 | TFB2M | P2T-E | Human | Esophagus | ESCC | 2.05e-36 | 2.44e-01 | 0.1177 |
| 64216 | TFB2M | P4T-E | Human | Esophagus | ESCC | 1.84e-05 | 2.61e-01 | 0.1323 |
| 64216 | TFB2M | P5T-E | Human | Esophagus | ESCC | 2.43e-11 | 3.26e-01 | 0.1327 |
| 64216 | TFB2M | P8T-E | Human | Esophagus | ESCC | 5.99e-09 | 2.05e-01 | 0.0889 |
| 64216 | TFB2M | P9T-E | Human | Esophagus | ESCC | 9.14e-04 | 1.93e-01 | 0.1131 |
| 64216 | TFB2M | P10T-E | Human | Esophagus | ESCC | 1.46e-23 | 2.96e-01 | 0.116 |
| 64216 | TFB2M | P11T-E | Human | Esophagus | ESCC | 1.65e-09 | 4.70e-01 | 0.1426 |
| 64216 | TFB2M | P12T-E | Human | Esophagus | ESCC | 1.41e-15 | 3.35e-01 | 0.1122 |
| 64216 | TFB2M | P15T-E | Human | Esophagus | ESCC | 1.10e-13 | 2.43e-01 | 0.1149 |
| 64216 | TFB2M | P16T-E | Human | Esophagus | ESCC | 7.22e-24 | 4.66e-01 | 0.1153 |
| 64216 | TFB2M | P17T-E | Human | Esophagus | ESCC | 1.12e-05 | 2.36e-02 | 0.1278 |
| 64216 | TFB2M | P20T-E | Human | Esophagus | ESCC | 3.71e-08 | 1.54e-01 | 0.1124 |
| 64216 | TFB2M | P21T-E | Human | Esophagus | ESCC | 9.00e-23 | 5.61e-01 | 0.1617 |
| 64216 | TFB2M | P22T-E | Human | Esophagus | ESCC | 7.31e-20 | 3.35e-01 | 0.1236 |
| 64216 | TFB2M | P23T-E | Human | Esophagus | ESCC | 9.32e-19 | 6.87e-01 | 0.108 |
| 64216 | TFB2M | P24T-E | Human | Esophagus | ESCC | 2.70e-08 | 1.26e-01 | 0.1287 |
| 64216 | TFB2M | P26T-E | Human | Esophagus | ESCC | 6.16e-20 | 4.66e-01 | 0.1276 |
| 64216 | TFB2M | P27T-E | Human | Esophagus | ESCC | 8.30e-18 | 2.34e-01 | 0.1055 |
| Page: 1 2 3 4 |
| Tissue | Expression Dynamics | Abbreviation |
| Esophagus | 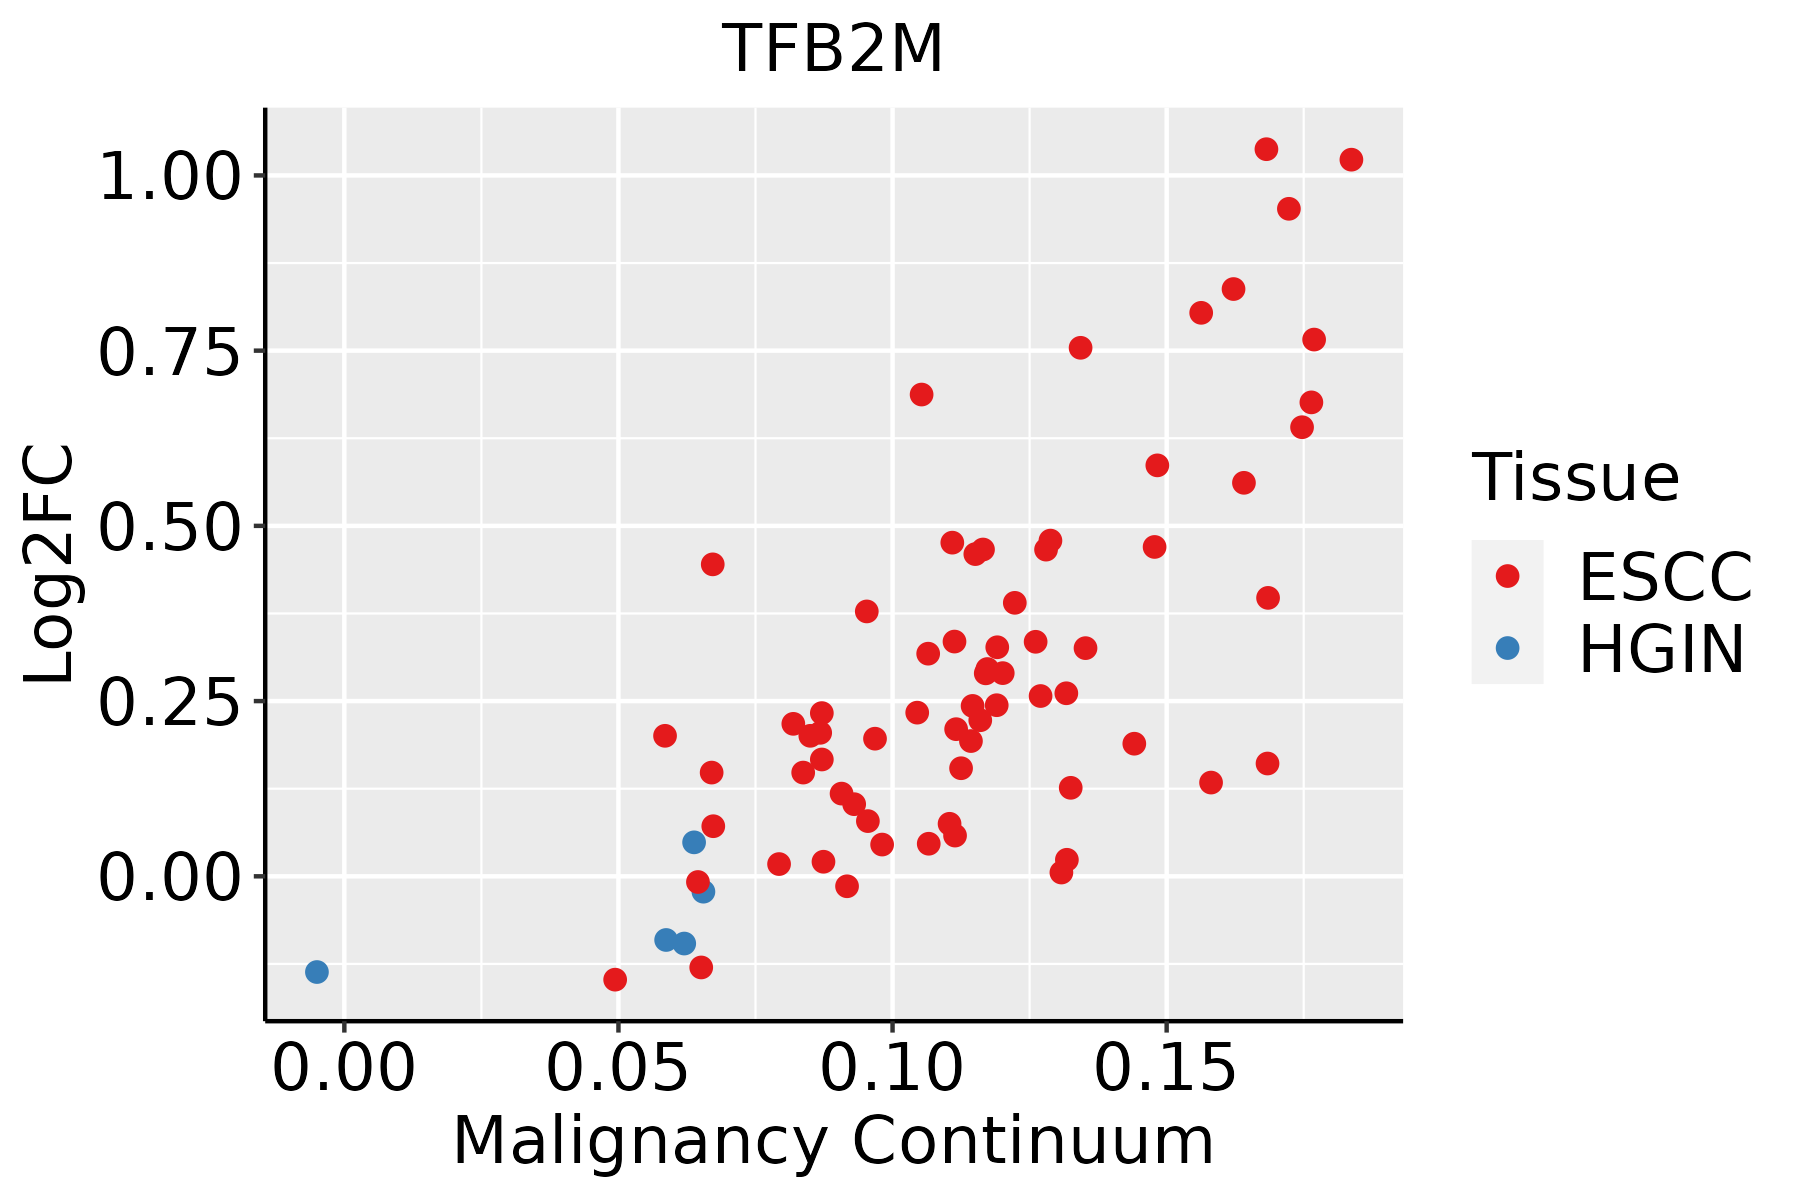 | ESCC: Esophageal squamous cell carcinoma |
| HGIN: High-grade intraepithelial neoplasias | ||
| LGIN: Low-grade intraepithelial neoplasias | ||
| Liver | 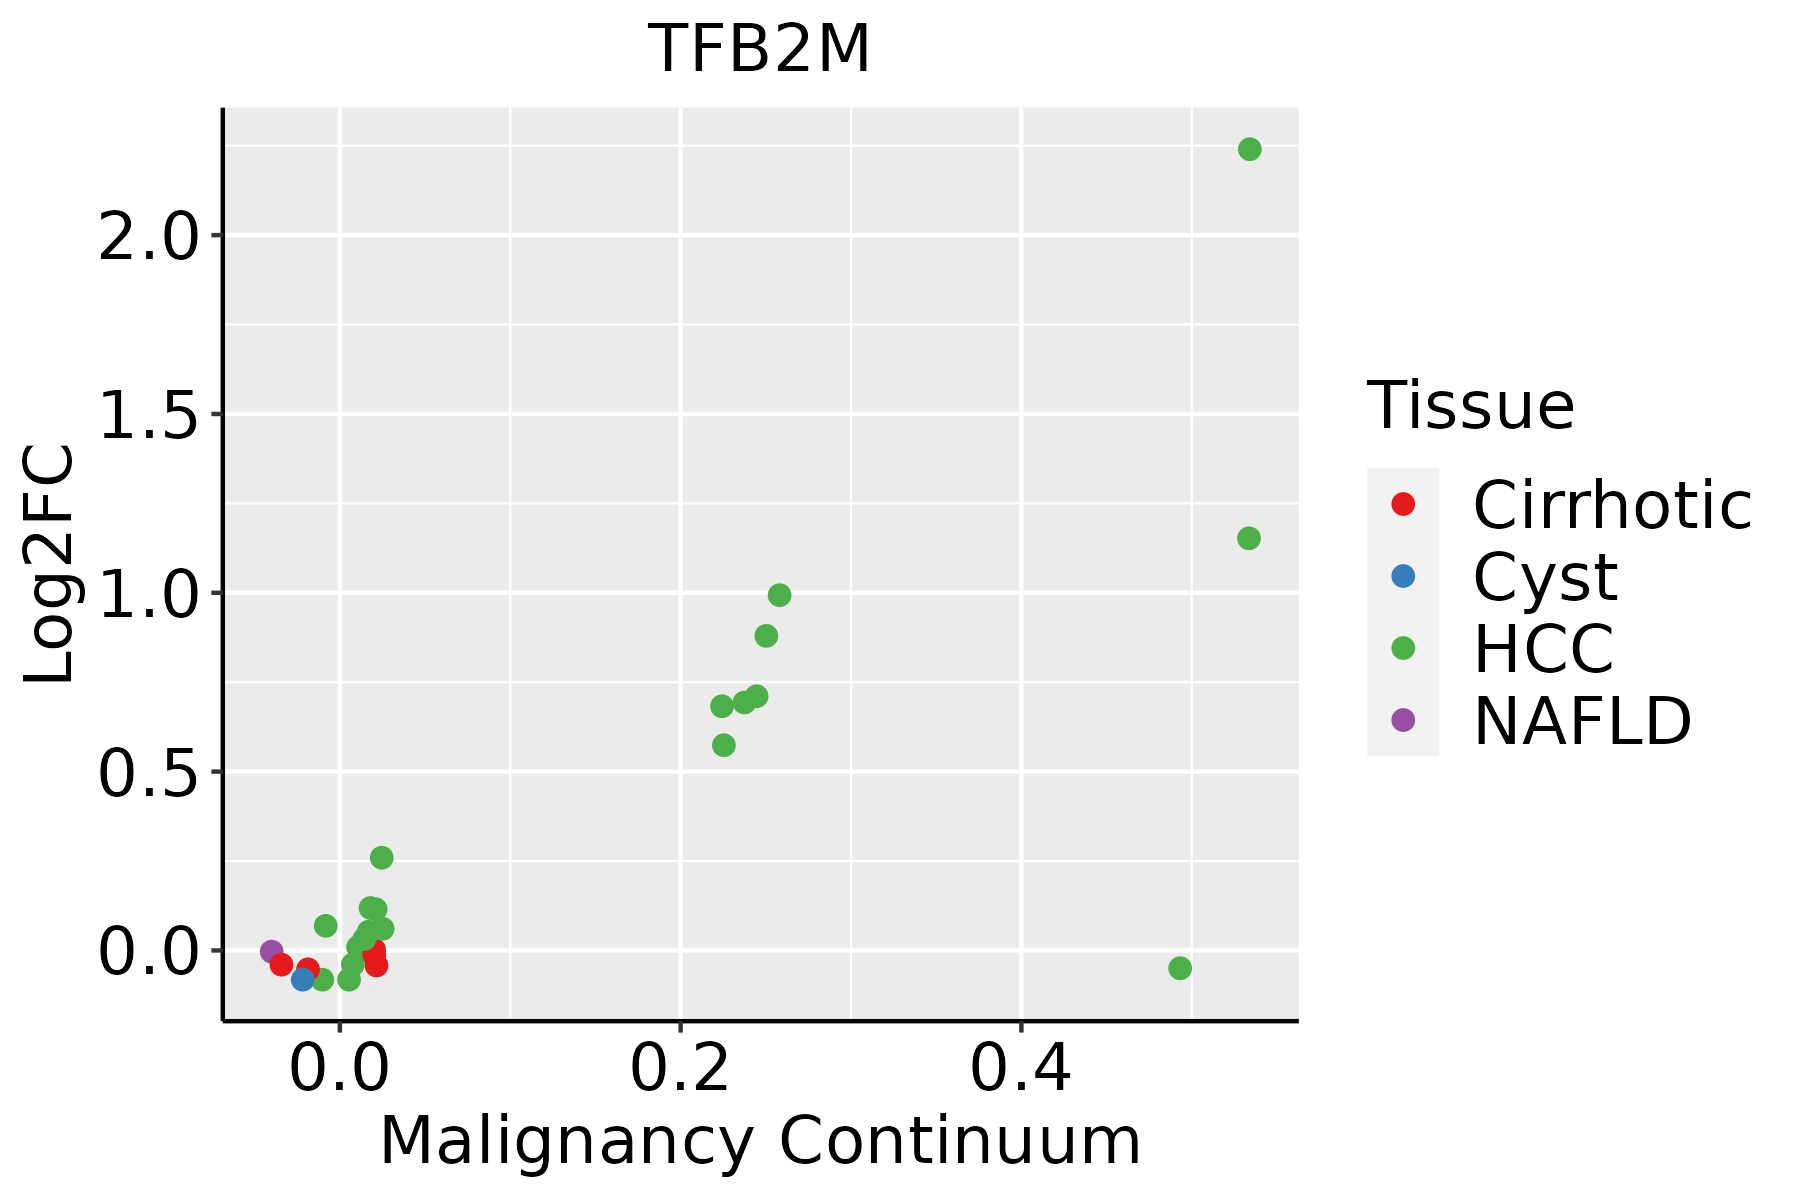 | HCC: Hepatocellular carcinoma |
| NAFLD: Non-alcoholic fatty liver disease | ||
| Oral Cavity | 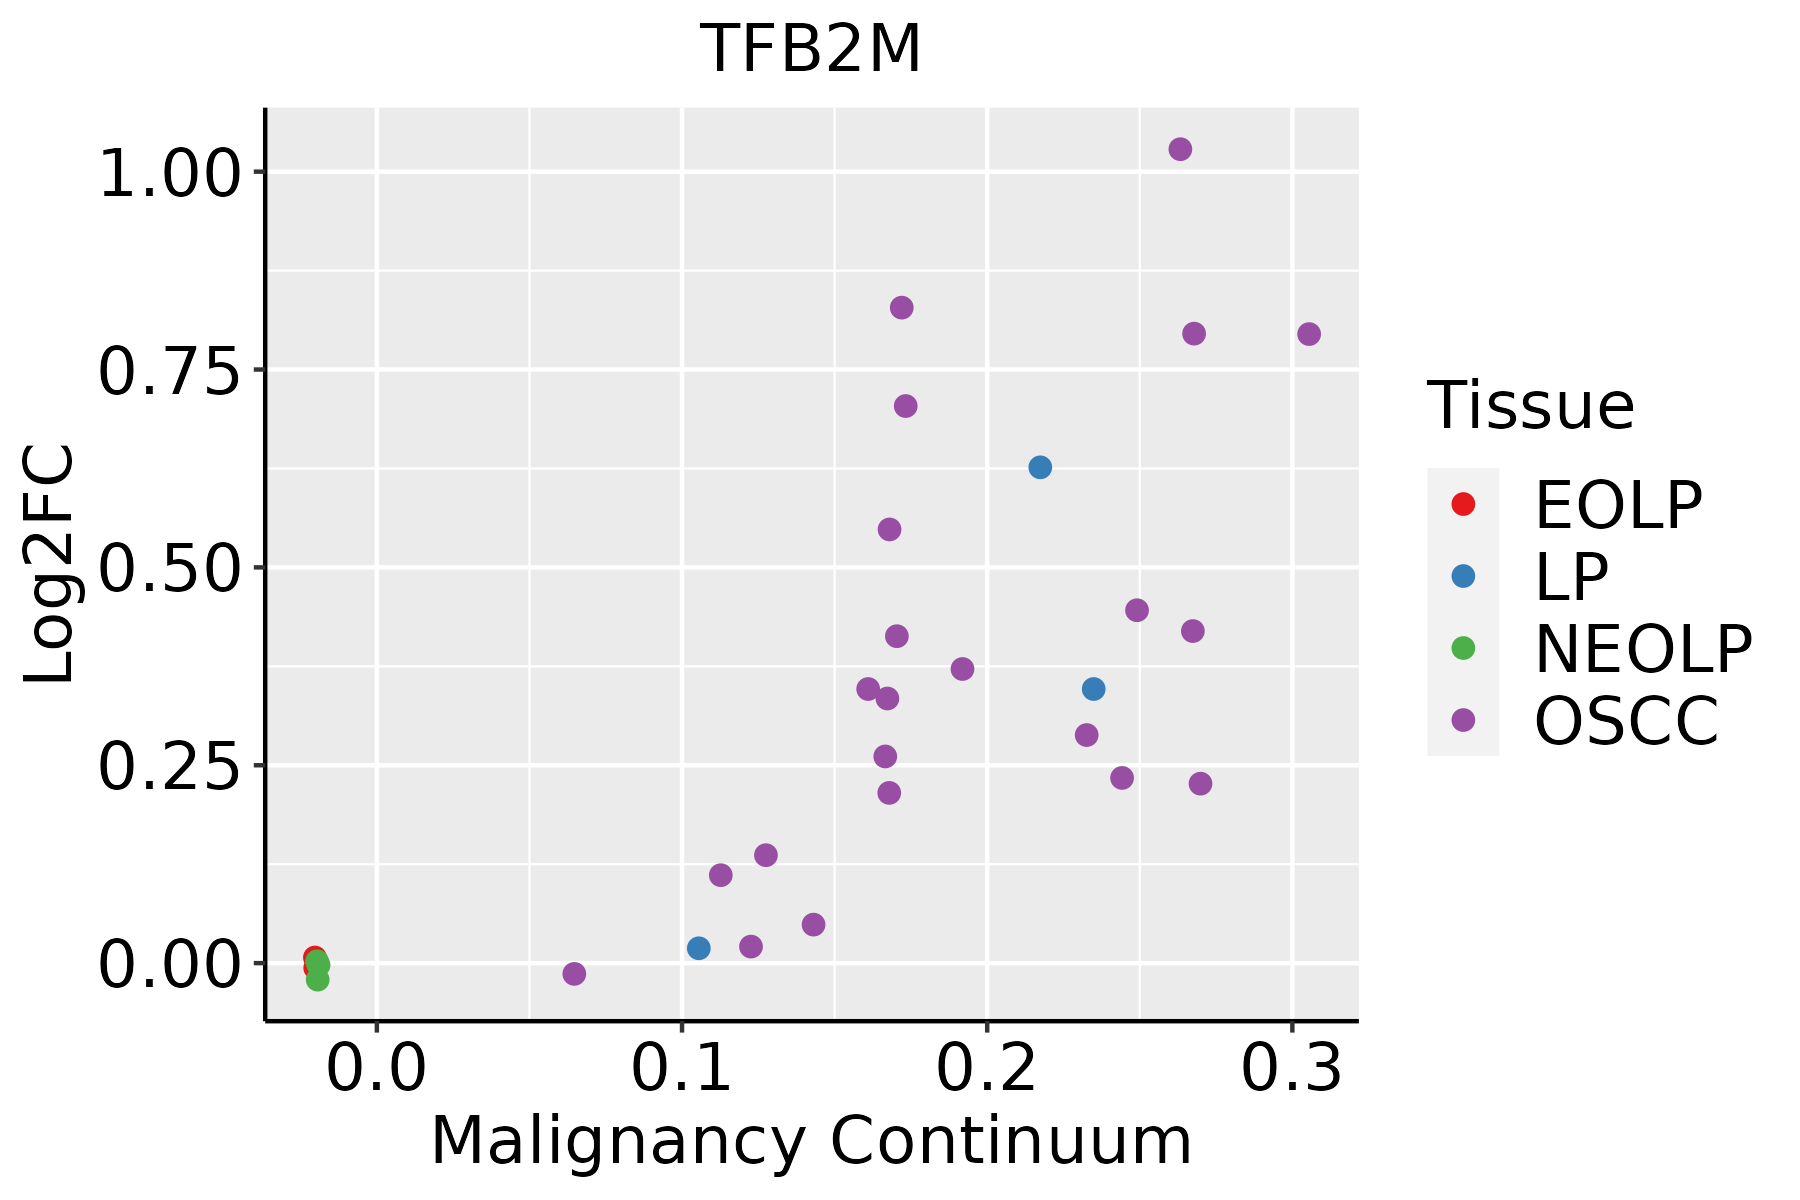 | EOLP: Erosive Oral lichen planus |
| LP: leukoplakia | ||
| NEOLP: Non-erosive oral lichen planus | ||
| OSCC: Oral squamous cell carcinoma | ||
| Skin | 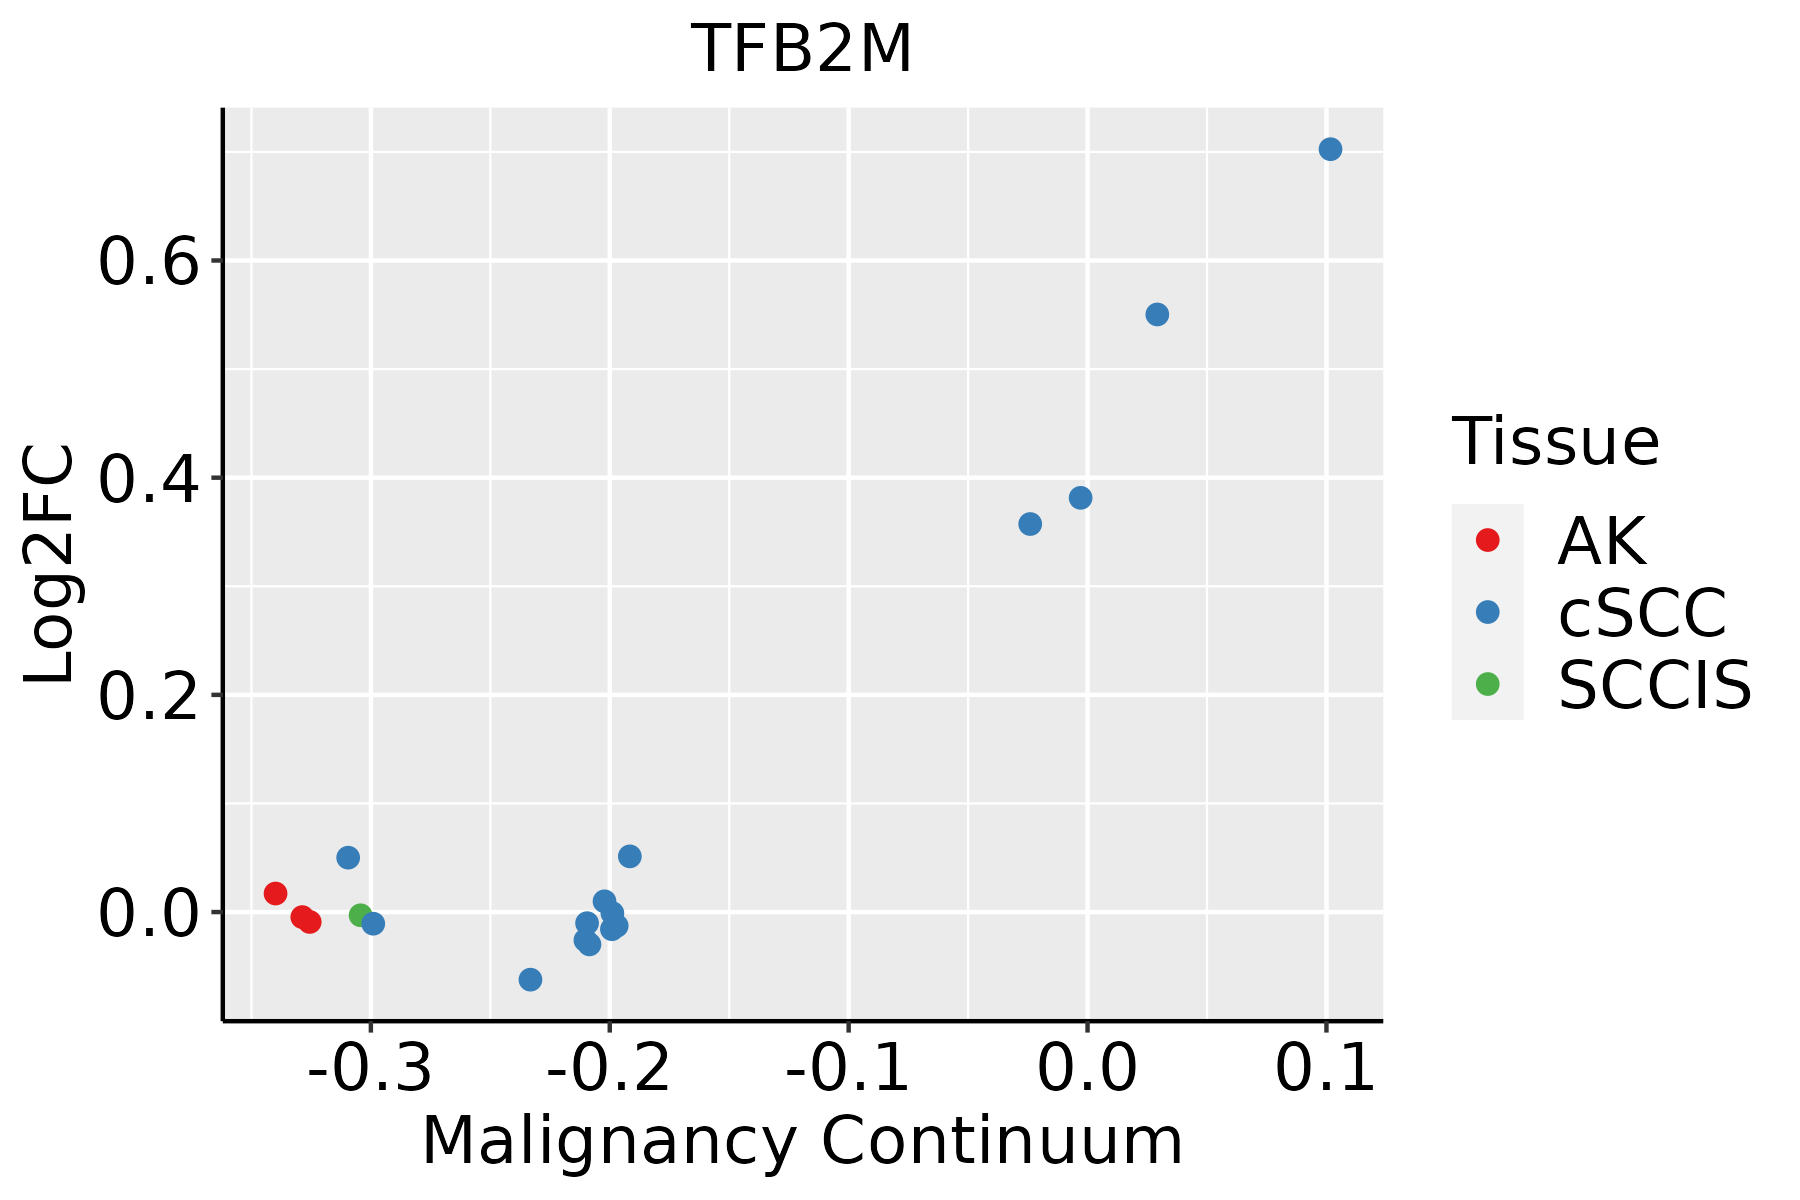 | AK: Actinic keratosis |
| cSCC: Cutaneous squamous cell carcinoma | ||
| SCCIS:squamous cell carcinoma in situ |
| ∗log2FC in expression of this searched gene in stem-like cells from each diseased tissue sample relative to stem-like cells in normal samples in each tissue plotted against the malignancy continuum. Samples are colored based on if they are from different disease stage. |
Top |
Malignant transformation related pathway analysis |
| Find out the enriched GO biological processes and KEGG pathways involved in transition from healthy to precancer to cancer |
| Tissue | Disease Stage | Enriched GO biological Processes |
| Colorectum | AD |  |
| Colorectum | SER |  |
| Colorectum | MSS |  |
| Colorectum | MSI-H |  |
| Colorectum | FAP |  |
| ∗Top 15 enriched GO BP terms are showed in the bar plot of each disease state in each tissue. Each row represents a significant GO biological process which is colored according to the -log10(p.adjust). |
| Page: 1 2 3 4 5 6 7 8 9 |
| GO ID | Tissue | Disease Stage | Description | Gene Ratio | Bg Ratio | pvalue | p.adjust | Count |
| GO:0022613111 | Esophagus | ESCC | ribonucleoprotein complex biogenesis | 365/8552 | 463/18723 | 1.74e-49 | 1.11e-45 | 365 |
| GO:0042254111 | Esophagus | ESCC | ribosome biogenesis | 252/8552 | 299/18723 | 3.27e-44 | 1.04e-40 | 252 |
| GO:003447015 | Esophagus | ESCC | ncRNA processing | 300/8552 | 395/18723 | 3.09e-35 | 3.26e-32 | 300 |
| GO:0016072110 | Esophagus | ESCC | rRNA metabolic process | 197/8552 | 236/18723 | 1.31e-33 | 1.18e-30 | 197 |
| GO:0006364110 | Esophagus | ESCC | rRNA processing | 189/8552 | 225/18723 | 4.88e-33 | 3.87e-30 | 189 |
| GO:003466012 | Esophagus | ESCC | ncRNA metabolic process | 346/8552 | 485/18723 | 4.35e-31 | 2.51e-28 | 346 |
| GO:014005313 | Esophagus | ESCC | mitochondrial gene expression | 93/8552 | 108/18723 | 1.96e-18 | 2.03e-16 | 93 |
| GO:00434143 | Esophagus | ESCC | macromolecule methylation | 199/8552 | 316/18723 | 3.44e-10 | 9.57e-09 | 199 |
| GO:00322592 | Esophagus | ESCC | methylation | 222/8552 | 364/18723 | 2.26e-09 | 5.09e-08 | 222 |
| GO:00094512 | Esophagus | ESCC | RNA modification | 114/8552 | 167/18723 | 2.76e-09 | 6.04e-08 | 114 |
| GO:00009592 | Esophagus | ESCC | mitochondrial RNA metabolic process | 39/8552 | 49/18723 | 1.20e-06 | 1.49e-05 | 39 |
| GO:000635211 | Esophagus | ESCC | DNA-templated transcription, initiation | 86/8552 | 130/18723 | 1.88e-06 | 2.19e-05 | 86 |
| GO:00015101 | Esophagus | ESCC | RNA methylation | 58/8552 | 83/18723 | 6.87e-06 | 6.94e-05 | 58 |
| GO:0000154 | Esophagus | ESCC | rRNA modification | 26/8552 | 37/18723 | 2.16e-03 | 9.62e-03 | 26 |
| GO:002261322 | Liver | HCC | ribonucleoprotein complex biogenesis | 355/7958 | 463/18723 | 7.76e-52 | 4.92e-48 | 355 |
| GO:004225422 | Liver | HCC | ribosome biogenesis | 246/7958 | 299/18723 | 4.99e-46 | 1.58e-42 | 246 |
| GO:00344702 | Liver | HCC | ncRNA processing | 293/7958 | 395/18723 | 4.26e-38 | 6.76e-35 | 293 |
| GO:001607212 | Liver | HCC | rRNA metabolic process | 193/7958 | 236/18723 | 1.26e-35 | 1.14e-32 | 193 |
| GO:000636421 | Liver | HCC | rRNA processing | 185/7958 | 225/18723 | 8.14e-35 | 6.45e-32 | 185 |
| GO:00346601 | Liver | HCC | ncRNA metabolic process | 332/7958 | 485/18723 | 1.48e-31 | 7.80e-29 | 332 |
| Page: 1 2 3 |
| Pathway ID | Tissue | Disease Stage | Description | Gene Ratio | Bg Ratio | pvalue | p.adjust | qvalue | Count |
| Page: 1 |
Top |
Cell-cell communication analysis |
| Identification of potential cell-cell interactions between two cell types and their ligand-receptor pairs for different disease states |
| Ligand | Receptor | LRpair | Pathway | Tissue | Disease Stage |
| Page: 1 |
Top |
Single-cell gene regulatory network inference analysis |
| Find out the significant the regulons (TFs) and the target genes of each regulon across cell types for different disease states |
| TF | Cell Type | Tissue | Disease Stage | Target Gene | RSS | Regulon Activity |
| ∗The dot plots of a searched regulon are shown for all cell subpopulations in each disease state of each tissue based on the regulon specific score inferred using pySCENIC and by calculating the average expression. |
| Page: 1 |
Top |
Somatic mutation of malignant transformation related genes |
| Annotation of somatic variants for genes involved in malignant transformation |
| Hugo Symbol | Variant Class | Variant Classification | dbSNP RS | HGVSc | HGVSp | HGVSp Short | SWISSPROT | BIOTYPE | SIFT | PolyPhen | Tumor Sample Barcode | Tissue | Histology | Sex | Age | Stage | Therapy Types | Drugs | Outcome |
| TFB2M | SNV | Missense_Mutation | novel | c.244G>A | p.Glu82Lys | p.E82K | Q9H5Q4 | protein_coding | tolerated(0.45) | benign(0.015) | TCGA-A2-A0CR-01 | Breast | breast invasive carcinoma | Female | <65 | I/II | Chemotherapy | adriamycin | CR |
| TFB2M | SNV | Missense_Mutation | novel | c.98N>C | p.Arg33Pro | p.R33P | Q9H5Q4 | protein_coding | tolerated(0.06) | probably_damaging(0.916) | TCGA-AR-A0TS-01 | Breast | breast invasive carcinoma | Female | <65 | I/II | Chemotherapy | doxorubicin | SD |
| TFB2M | SNV | Missense_Mutation | c.784N>A | p.Val262Ile | p.V262I | Q9H5Q4 | protein_coding | deleterious(0.04) | benign(0.076) | TCGA-AR-A24V-01 | Breast | breast invasive carcinoma | Female | <65 | I/II | Chemotherapy | doxorubicin | SD | |
| TFB2M | SNV | Missense_Mutation | novel | c.410N>A | p.Gly137Glu | p.G137E | Q9H5Q4 | protein_coding | tolerated(0.46) | benign(0.042) | TCGA-BH-A0B9-01 | Breast | breast invasive carcinoma | Female | <65 | I/II | Chemotherapy | cyclophosphamide | SD |
| TFB2M | insertion | Frame_Shift_Ins | novel | c.69_70insACTAGAGACGGGATTTCGCCGTGTTGGCCAGGATGGTCTC | p.Cys24ThrfsTer19 | p.C24Tfs*19 | Q9H5Q4 | protein_coding | TCGA-A2-A0CQ-01 | Breast | breast invasive carcinoma | Female | <65 | I/II | Chemotherapy | adriamycin | SD | ||
| TFB2M | insertion | Nonsense_Mutation | novel | c.161_162insCTAGAGACGGGATT | p.Glu54AspfsTer2 | p.E54Dfs*2 | Q9H5Q4 | protein_coding | TCGA-BH-A0GY-01 | Breast | breast invasive carcinoma | Female | >=65 | I/II | Chemotherapy | cyotxan | SD | ||
| TFB2M | SNV | Missense_Mutation | rs777902650 | c.95C>G | p.Thr32Arg | p.T32R | Q9H5Q4 | protein_coding | tolerated(0.83) | benign(0.001) | TCGA-C5-A3HE-01 | Cervix | cervical & endocervical cancer | Female | <65 | I/II | Unknown | Unknown | PD |
| TFB2M | SNV | Missense_Mutation | novel | c.759N>G | p.Ile253Met | p.I253M | Q9H5Q4 | protein_coding | deleterious(0) | benign(0.047) | TCGA-C5-A8XJ-01 | Cervix | cervical & endocervical cancer | Female | >=65 | I/II | Chemotherapy | cisplatin | SD |
| TFB2M | SNV | Missense_Mutation | rs778994953 | c.1102N>G | p.Gln368Glu | p.Q368E | Q9H5Q4 | protein_coding | tolerated(1) | benign(0.001) | TCGA-EA-A43B-01 | Cervix | cervical & endocervical cancer | Female | <65 | I/II | Chemotherapy | cisplatin | CR |
| TFB2M | SNV | Missense_Mutation | c.674N>A | p.Val225Glu | p.V225E | Q9H5Q4 | protein_coding | deleterious(0) | possibly_damaging(0.659) | TCGA-AA-3492-01 | Colorectum | colon adenocarcinoma | Female | >=65 | I/II | Unknown | Unknown | SD |
| Page: 1 2 3 4 5 6 |
Top |
Related drugs of malignant transformation related genes |
| Identification of chemicals and drugs interact with genes involved in malignant transfromation |
| (DGIdb 4.0) |
| Entrez ID | Symbol | Category | Interaction Types | Drug Claim Name | Drug Name | PMIDs |
| Page: 1 |

Copyright 2023-Present -The University of Texas Health Science Center at Houston |