
|
|||||
|
 | |
| |
| |
| |
| |
| |
|
Gene: TFB1M |
Gene summary for TFB1M |
| Gene information | Species | Human | Gene symbol | TFB1M | Gene ID | 51106 |
| Gene name | transcription factor B1, mitochondrial | |
| Gene Alias | CGI-75 | |
| Cytomap | 6q25.3 | |
| Gene Type | protein-coding | GO ID | GO:0000154 | UniProtAcc | E5KTM5 |
Top |
Malignant transformation analysis |
| Identification of the aberrant gene expression in precancerous and cancerous lesions by comparing the gene expression of stem-like cells in diseased tissues with normal stem cells |
| Entrez ID | Symbol | Replicates | Species | Organ | Tissue | Adj P-value | Log2FC | Malignancy |
| 51106 | TFB1M | LZE4T | Human | Esophagus | ESCC | 8.22e-15 | 4.62e-01 | 0.0811 |
| 51106 | TFB1M | LZE7T | Human | Esophagus | ESCC | 5.12e-05 | 2.97e-01 | 0.0667 |
| 51106 | TFB1M | LZE8T | Human | Esophagus | ESCC | 2.85e-03 | 1.47e-01 | 0.067 |
| 51106 | TFB1M | LZE22T | Human | Esophagus | ESCC | 4.06e-04 | 2.88e-01 | 0.068 |
| 51106 | TFB1M | LZE24T | Human | Esophagus | ESCC | 1.78e-05 | 2.19e-01 | 0.0596 |
| 51106 | TFB1M | LZE21T | Human | Esophagus | ESCC | 1.60e-04 | 4.29e-01 | 0.0655 |
| 51106 | TFB1M | P2T-E | Human | Esophagus | ESCC | 1.17e-17 | 3.16e-01 | 0.1177 |
| 51106 | TFB1M | P4T-E | Human | Esophagus | ESCC | 3.97e-19 | 4.12e-01 | 0.1323 |
| 51106 | TFB1M | P5T-E | Human | Esophagus | ESCC | 2.63e-13 | 2.94e-01 | 0.1327 |
| 51106 | TFB1M | P8T-E | Human | Esophagus | ESCC | 5.00e-09 | 1.93e-01 | 0.0889 |
| 51106 | TFB1M | P9T-E | Human | Esophagus | ESCC | 1.06e-07 | 2.01e-01 | 0.1131 |
| 51106 | TFB1M | P10T-E | Human | Esophagus | ESCC | 1.40e-16 | 3.53e-01 | 0.116 |
| 51106 | TFB1M | P11T-E | Human | Esophagus | ESCC | 8.02e-05 | 2.02e-01 | 0.1426 |
| 51106 | TFB1M | P12T-E | Human | Esophagus | ESCC | 7.07e-23 | 5.74e-01 | 0.1122 |
| 51106 | TFB1M | P15T-E | Human | Esophagus | ESCC | 5.94e-29 | 5.96e-01 | 0.1149 |
| 51106 | TFB1M | P16T-E | Human | Esophagus | ESCC | 2.23e-41 | 8.41e-01 | 0.1153 |
| 51106 | TFB1M | P17T-E | Human | Esophagus | ESCC | 1.77e-02 | 1.37e-01 | 0.1278 |
| 51106 | TFB1M | P20T-E | Human | Esophagus | ESCC | 2.20e-11 | 2.42e-01 | 0.1124 |
| 51106 | TFB1M | P21T-E | Human | Esophagus | ESCC | 2.75e-17 | 3.82e-01 | 0.1617 |
| 51106 | TFB1M | P22T-E | Human | Esophagus | ESCC | 9.60e-11 | 1.65e-01 | 0.1236 |
| Page: 1 2 3 4 |
| Tissue | Expression Dynamics | Abbreviation |
| Esophagus | 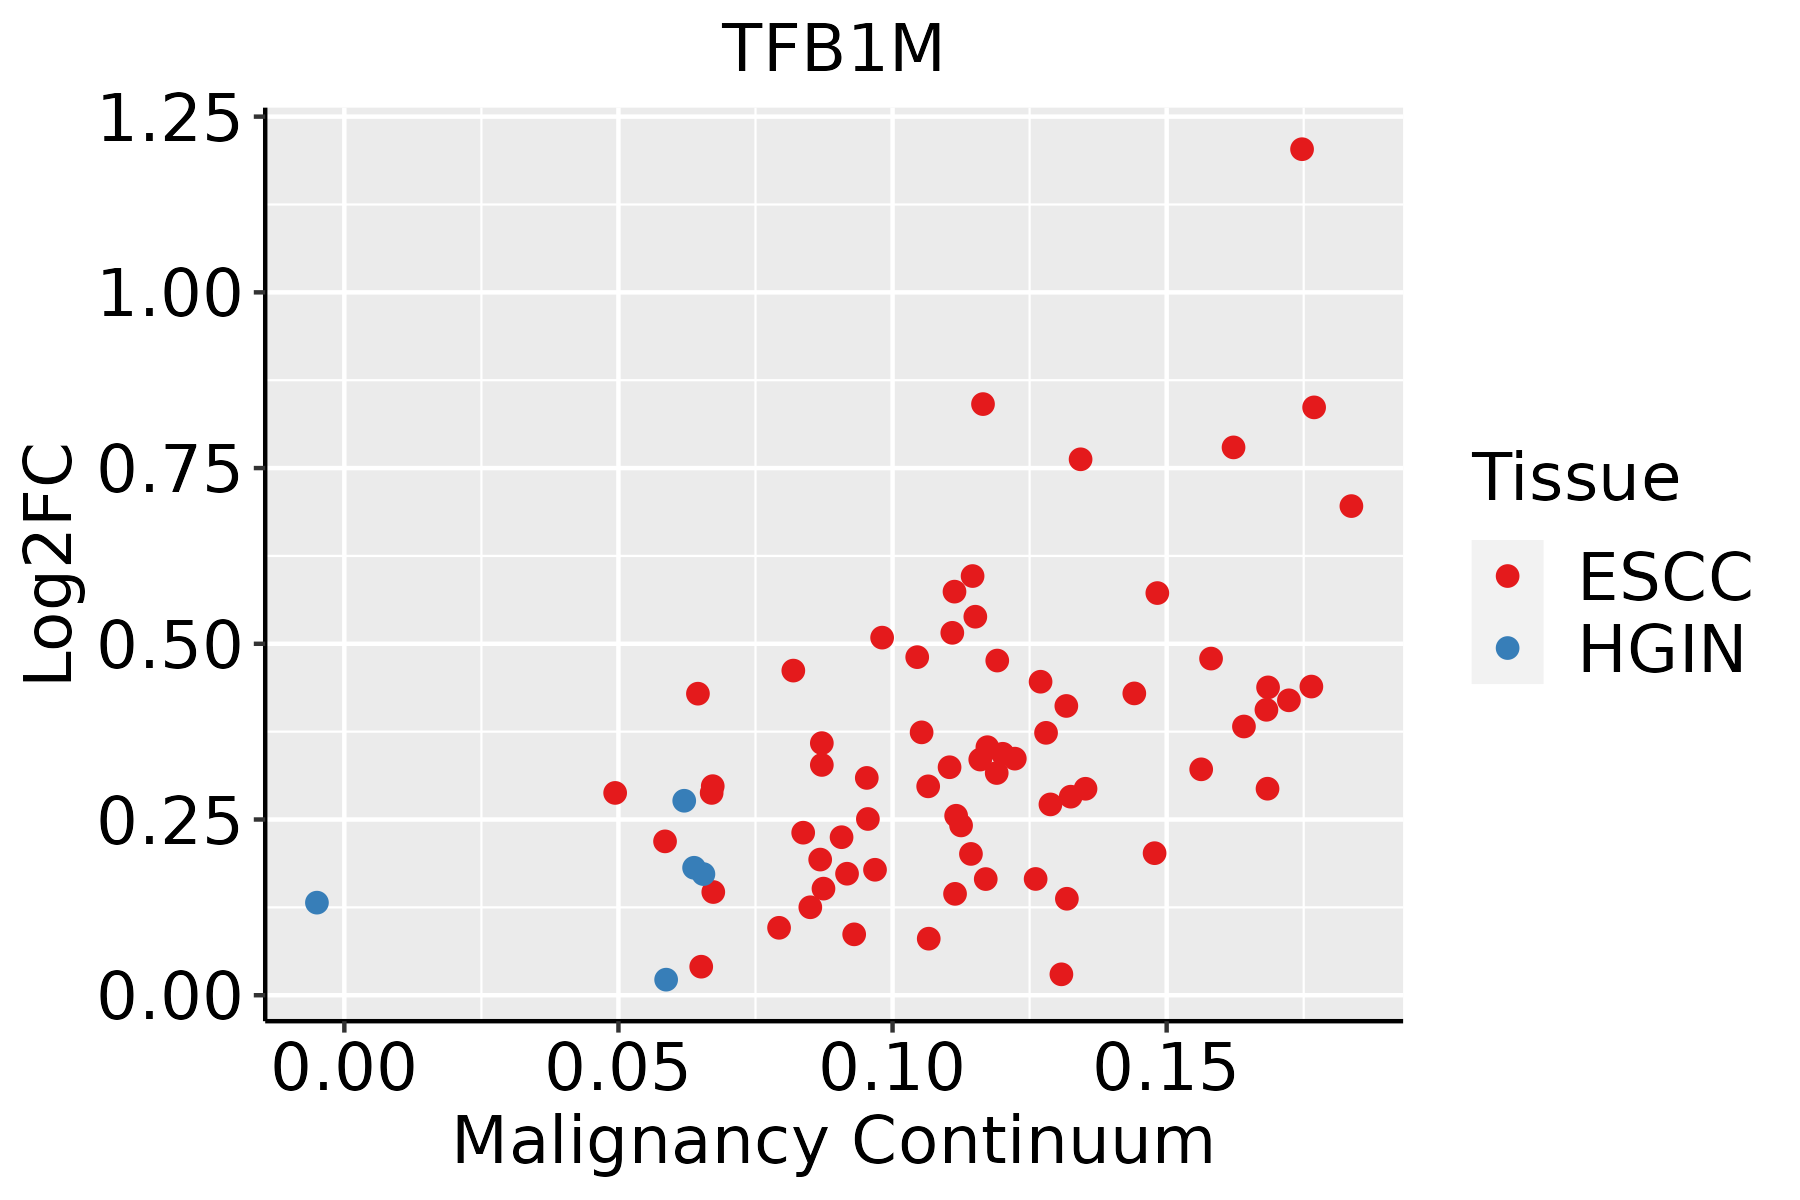 | ESCC: Esophageal squamous cell carcinoma |
| HGIN: High-grade intraepithelial neoplasias | ||
| LGIN: Low-grade intraepithelial neoplasias | ||
| Liver | 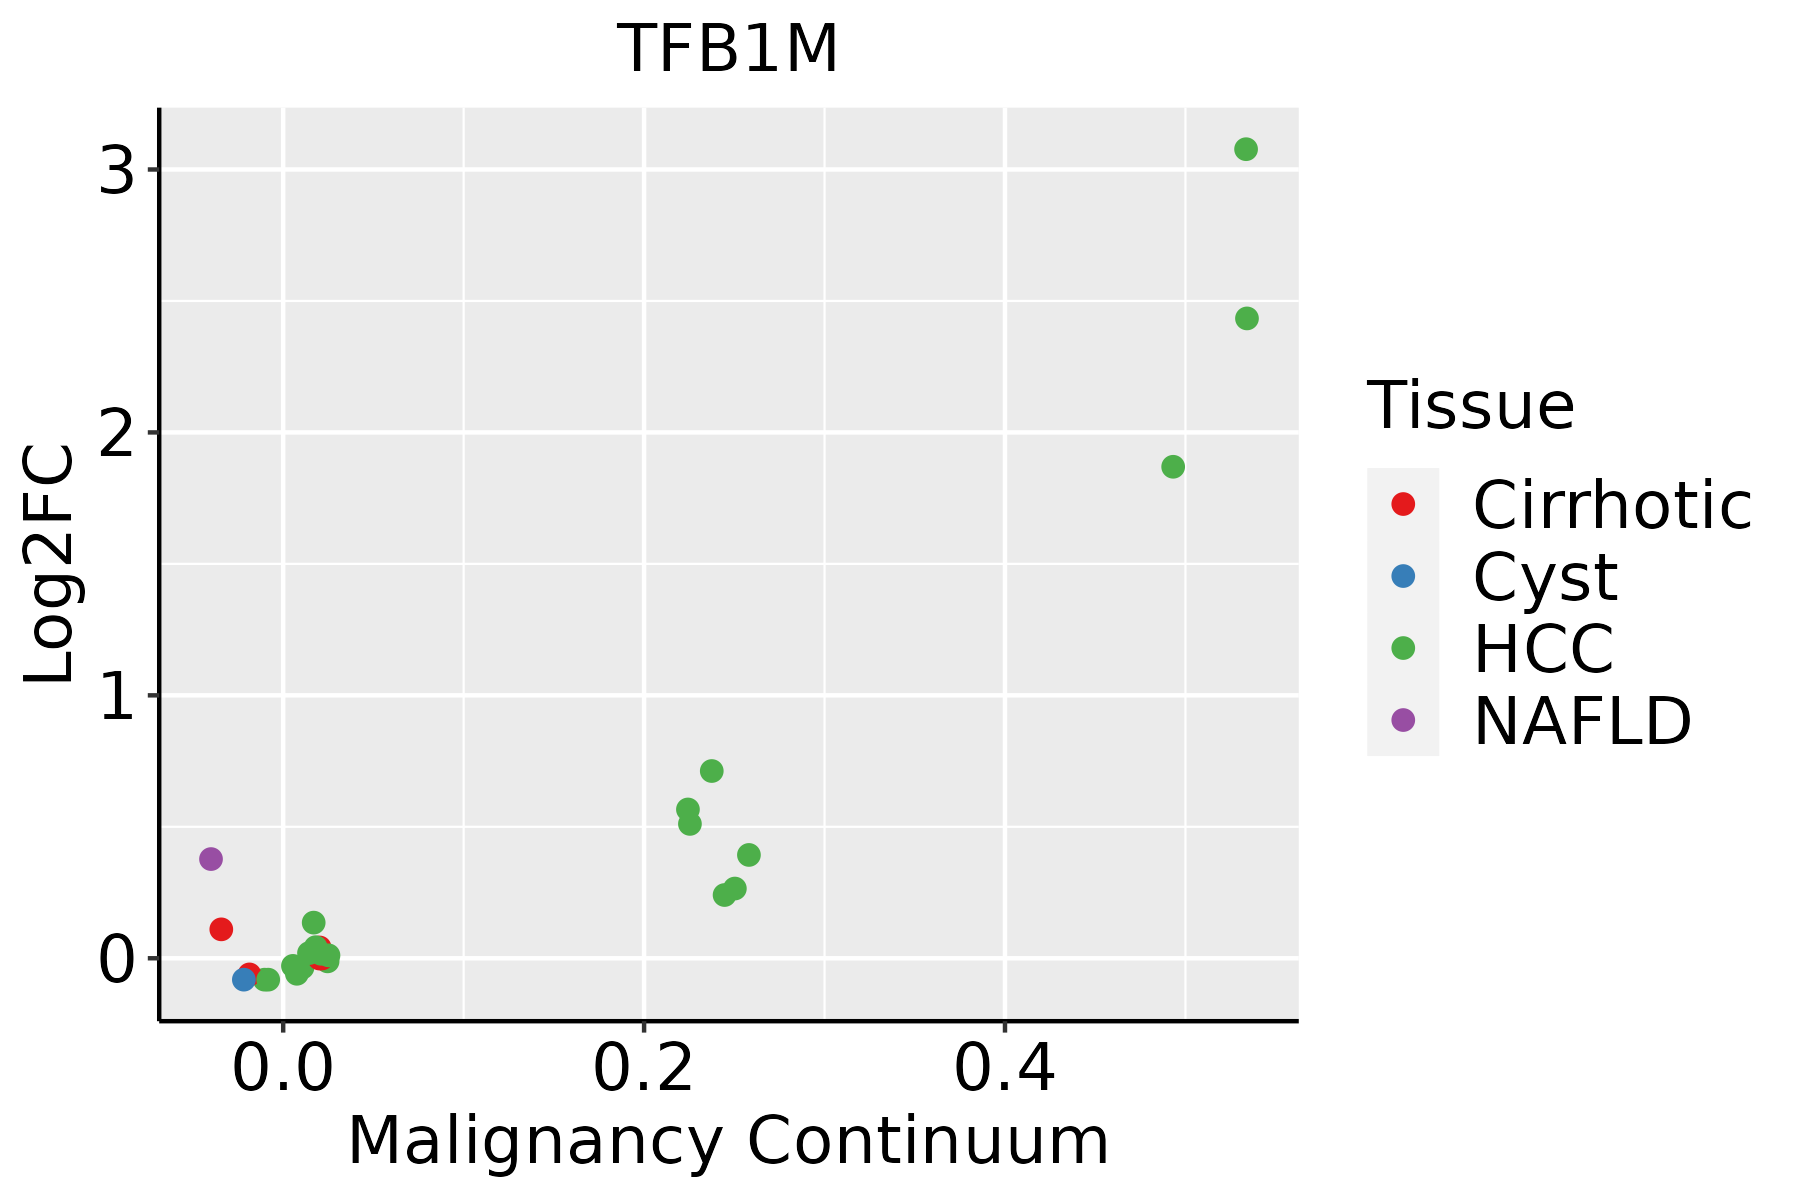 | HCC: Hepatocellular carcinoma |
| NAFLD: Non-alcoholic fatty liver disease |
| ∗log2FC in expression of this searched gene in stem-like cells from each diseased tissue sample relative to stem-like cells in normal samples in each tissue plotted against the malignancy continuum. Samples are colored based on if they are from different disease stage. |
Top |
Malignant transformation related pathway analysis |
| Find out the enriched GO biological processes and KEGG pathways involved in transition from healthy to precancer to cancer |
| Tissue | Disease Stage | Enriched GO biological Processes |
| Colorectum | AD |  |
| Colorectum | SER |  |
| Colorectum | MSS |  |
| Colorectum | MSI-H |  |
| Colorectum | FAP |  |
| ∗Top 15 enriched GO BP terms are showed in the bar plot of each disease state in each tissue. Each row represents a significant GO biological process which is colored according to the -log10(p.adjust). |
| Page: 1 2 3 4 5 6 7 8 9 |
| GO ID | Tissue | Disease Stage | Description | Gene Ratio | Bg Ratio | pvalue | p.adjust | Count |
| GO:0022613111 | Esophagus | ESCC | ribonucleoprotein complex biogenesis | 365/8552 | 463/18723 | 1.74e-49 | 1.11e-45 | 365 |
| GO:0042254111 | Esophagus | ESCC | ribosome biogenesis | 252/8552 | 299/18723 | 3.27e-44 | 1.04e-40 | 252 |
| GO:003447015 | Esophagus | ESCC | ncRNA processing | 300/8552 | 395/18723 | 3.09e-35 | 3.26e-32 | 300 |
| GO:0016072110 | Esophagus | ESCC | rRNA metabolic process | 197/8552 | 236/18723 | 1.31e-33 | 1.18e-30 | 197 |
| GO:0006364110 | Esophagus | ESCC | rRNA processing | 189/8552 | 225/18723 | 4.88e-33 | 3.87e-30 | 189 |
| GO:003466012 | Esophagus | ESCC | ncRNA metabolic process | 346/8552 | 485/18723 | 4.35e-31 | 2.51e-28 | 346 |
| GO:014005313 | Esophagus | ESCC | mitochondrial gene expression | 93/8552 | 108/18723 | 1.96e-18 | 2.03e-16 | 93 |
| GO:00434143 | Esophagus | ESCC | macromolecule methylation | 199/8552 | 316/18723 | 3.44e-10 | 9.57e-09 | 199 |
| GO:00322592 | Esophagus | ESCC | methylation | 222/8552 | 364/18723 | 2.26e-09 | 5.09e-08 | 222 |
| GO:00094512 | Esophagus | ESCC | RNA modification | 114/8552 | 167/18723 | 2.76e-09 | 6.04e-08 | 114 |
| GO:00009592 | Esophagus | ESCC | mitochondrial RNA metabolic process | 39/8552 | 49/18723 | 1.20e-06 | 1.49e-05 | 39 |
| GO:000635211 | Esophagus | ESCC | DNA-templated transcription, initiation | 86/8552 | 130/18723 | 1.88e-06 | 2.19e-05 | 86 |
| GO:00015101 | Esophagus | ESCC | RNA methylation | 58/8552 | 83/18723 | 6.87e-06 | 6.94e-05 | 58 |
| GO:0000154 | Esophagus | ESCC | rRNA modification | 26/8552 | 37/18723 | 2.16e-03 | 9.62e-03 | 26 |
| GO:002261322 | Liver | HCC | ribonucleoprotein complex biogenesis | 355/7958 | 463/18723 | 7.76e-52 | 4.92e-48 | 355 |
| GO:004225422 | Liver | HCC | ribosome biogenesis | 246/7958 | 299/18723 | 4.99e-46 | 1.58e-42 | 246 |
| GO:00344702 | Liver | HCC | ncRNA processing | 293/7958 | 395/18723 | 4.26e-38 | 6.76e-35 | 293 |
| GO:001607212 | Liver | HCC | rRNA metabolic process | 193/7958 | 236/18723 | 1.26e-35 | 1.14e-32 | 193 |
| GO:000636421 | Liver | HCC | rRNA processing | 185/7958 | 225/18723 | 8.14e-35 | 6.45e-32 | 185 |
| GO:00346601 | Liver | HCC | ncRNA metabolic process | 332/7958 | 485/18723 | 1.48e-31 | 7.80e-29 | 332 |
| Page: 1 2 |
| Pathway ID | Tissue | Disease Stage | Description | Gene Ratio | Bg Ratio | pvalue | p.adjust | qvalue | Count |
| Page: 1 |
Top |
Cell-cell communication analysis |
| Identification of potential cell-cell interactions between two cell types and their ligand-receptor pairs for different disease states |
| Ligand | Receptor | LRpair | Pathway | Tissue | Disease Stage |
| Page: 1 |
Top |
Single-cell gene regulatory network inference analysis |
| Find out the significant the regulons (TFs) and the target genes of each regulon across cell types for different disease states |
| TF | Cell Type | Tissue | Disease Stage | Target Gene | RSS | Regulon Activity |
| ∗The dot plots of a searched regulon are shown for all cell subpopulations in each disease state of each tissue based on the regulon specific score inferred using pySCENIC and by calculating the average expression. |
| Page: 1 |
Top |
Somatic mutation of malignant transformation related genes |
| Annotation of somatic variants for genes involved in malignant transformation |
| Hugo Symbol | Variant Class | Variant Classification | dbSNP RS | HGVSc | HGVSp | HGVSp Short | SWISSPROT | BIOTYPE | SIFT | PolyPhen | Tumor Sample Barcode | Tissue | Histology | Sex | Age | Stage | Therapy Types | Drugs | Outcome |
| TFB1M | SNV | Missense_Mutation | novel | c.522G>C | p.Leu174Phe | p.L174F | Q8WVM0 | protein_coding | deleterious(0) | probably_damaging(0.99) | TCGA-A8-A07W-01 | Breast | breast invasive carcinoma | Female | >=65 | III/IV | Hormone Therapy | exemestane | SD |
| TFB1M | insertion | Nonsense_Mutation | novel | c.435_436insAAACCCTCCAGGGTAAGCAGGGGTGGTGCTTGAGCTGCAAAGG | p.Val146LysfsTer11 | p.V146Kfs*11 | Q8WVM0 | protein_coding | TCGA-A2-A0EQ-01 | Breast | breast invasive carcinoma | Female | <65 | I/II | Chemotherapy | adriamycin | SD | ||
| TFB1M | insertion | Nonsense_Mutation | novel | c.191_192insCATTCCAGAGATTTTGATTCCATAGTCTGGAGAAATCTGGAA | p.Pro64_Gly65insIleProGluIleLeuIleProTerSerGlyGluIleTrpAsn | p.P64_G65insIPEILIP*SGEIWN | Q8WVM0 | protein_coding | TCGA-AN-A046-01 | Breast | breast invasive carcinoma | Female | >=65 | I/II | Unknown | Unknown | SD | ||
| TFB1M | SNV | Missense_Mutation | novel | c.56N>A | p.Arg19Gln | p.R19Q | Q8WVM0 | protein_coding | tolerated(0.1) | benign(0.217) | TCGA-VS-A9UZ-01 | Cervix | cervical & endocervical cancer | Female | <65 | I/II | Unknown | Unknown | SD |
| TFB1M | SNV | Missense_Mutation | c.187G>A | p.Gly63Ser | p.G63S | Q8WVM0 | protein_coding | deleterious(0) | probably_damaging(1) | TCGA-AZ-4308-01 | Colorectum | colon adenocarcinoma | Female | <65 | III/IV | Targeted Molecular therapy | avastin | CR | |
| TFB1M | SNV | Missense_Mutation | rs149125723 | c.1021N>A | p.Ala341Thr | p.A341T | Q8WVM0 | protein_coding | tolerated(0.57) | benign(0) | TCGA-G4-6309-01 | Colorectum | colon adenocarcinoma | Female | <65 | III/IV | Chemotherapy | xeloda | PD |
| TFB1M | SNV | Missense_Mutation | novel | c.430N>C | p.Phe144Leu | p.F144L | Q8WVM0 | protein_coding | deleterious(0) | probably_damaging(0.999) | TCGA-A5-A0G1-01 | Endometrium | uterine corpus endometrioid carcinoma | Female | >=65 | I/II | Unknown | Unknown | SD |
| TFB1M | SNV | Missense_Mutation | rs201634865 | c.878G>A | p.Arg293His | p.R293H | Q8WVM0 | protein_coding | tolerated(0.28) | benign(0) | TCGA-AJ-A3EK-01 | Endometrium | uterine corpus endometrioid carcinoma | Female | <65 | I/II | Chemotherapy | carboplatin | CR |
| TFB1M | SNV | Missense_Mutation | novel | c.546N>T | p.Glu182Asp | p.E182D | Q8WVM0 | protein_coding | deleterious(0.02) | possibly_damaging(0.631) | TCGA-AP-A1DK-01 | Endometrium | uterine corpus endometrioid carcinoma | Female | <65 | I/II | Unknown | Unknown | SD |
| TFB1M | SNV | Missense_Mutation | rs751725239 | c.812C>T | p.Ala271Val | p.A271V | Q8WVM0 | protein_coding | tolerated(0.24) | benign(0.105) | TCGA-AX-A0J1-01 | Endometrium | uterine corpus endometrioid carcinoma | Female | >=65 | I/II | Unknown | Unknown | SD |
| Page: 1 2 3 4 |
Top |
Related drugs of malignant transformation related genes |
| Identification of chemicals and drugs interact with genes involved in malignant transfromation |
| (DGIdb 4.0) |
| Entrez ID | Symbol | Category | Interaction Types | Drug Claim Name | Drug Name | PMIDs |
| Page: 1 |

Copyright 2023-Present -The University of Texas Health Science Center at Houston |