
|
|||||
|
 | |
| |
| |
| |
| |
| |
|
Gene: TFAP2C |
Gene summary for TFAP2C |
| Gene information | Species | Human | Gene symbol | TFAP2C | Gene ID | 7022 |
| Gene name | transcription factor AP-2 gamma | |
| Gene Alias | AP2-GAMMA | |
| Cytomap | 20q13.31 | |
| Gene Type | protein-coding | GO ID | GO:0000003 | UniProtAcc | Q92754 |
Top |
Malignant transformation analysis |
| Identification of the aberrant gene expression in precancerous and cancerous lesions by comparing the gene expression of stem-like cells in diseased tissues with normal stem cells |
| Entrez ID | Symbol | Replicates | Species | Organ | Tissue | Adj P-value | Log2FC | Malignancy |
| 7022 | TFAP2C | LZE2T | Human | Esophagus | ESCC | 1.72e-02 | 2.70e-01 | 0.082 |
| 7022 | TFAP2C | LZE4T | Human | Esophagus | ESCC | 5.26e-05 | 1.16e-01 | 0.0811 |
| 7022 | TFAP2C | LZE20T | Human | Esophagus | ESCC | 5.18e-06 | 1.47e-01 | 0.0662 |
| 7022 | TFAP2C | LZE24T | Human | Esophagus | ESCC | 3.60e-12 | 2.94e-01 | 0.0596 |
| 7022 | TFAP2C | P1T-E | Human | Esophagus | ESCC | 4.10e-10 | 7.53e-01 | 0.0875 |
| 7022 | TFAP2C | P2T-E | Human | Esophagus | ESCC | 3.02e-45 | 9.79e-01 | 0.1177 |
| 7022 | TFAP2C | P4T-E | Human | Esophagus | ESCC | 1.61e-02 | 9.05e-02 | 0.1323 |
| 7022 | TFAP2C | P5T-E | Human | Esophagus | ESCC | 7.68e-13 | 1.61e-01 | 0.1327 |
| 7022 | TFAP2C | P8T-E | Human | Esophagus | ESCC | 1.66e-19 | 2.73e-01 | 0.0889 |
| 7022 | TFAP2C | P9T-E | Human | Esophagus | ESCC | 3.70e-05 | 1.99e-01 | 0.1131 |
| 7022 | TFAP2C | P10T-E | Human | Esophagus | ESCC | 2.43e-09 | 2.87e-01 | 0.116 |
| 7022 | TFAP2C | P11T-E | Human | Esophagus | ESCC | 4.66e-10 | 7.39e-01 | 0.1426 |
| 7022 | TFAP2C | P12T-E | Human | Esophagus | ESCC | 2.99e-34 | 8.58e-01 | 0.1122 |
| 7022 | TFAP2C | P15T-E | Human | Esophagus | ESCC | 7.71e-33 | 9.42e-01 | 0.1149 |
| 7022 | TFAP2C | P16T-E | Human | Esophagus | ESCC | 7.76e-69 | 1.66e+00 | 0.1153 |
| 7022 | TFAP2C | P20T-E | Human | Esophagus | ESCC | 8.23e-25 | 7.08e-01 | 0.1124 |
| 7022 | TFAP2C | P21T-E | Human | Esophagus | ESCC | 7.78e-22 | 3.52e-01 | 0.1617 |
| 7022 | TFAP2C | P22T-E | Human | Esophagus | ESCC | 2.77e-21 | 5.08e-01 | 0.1236 |
| 7022 | TFAP2C | P23T-E | Human | Esophagus | ESCC | 1.58e-18 | 5.38e-01 | 0.108 |
| 7022 | TFAP2C | P24T-E | Human | Esophagus | ESCC | 2.26e-11 | 2.53e-01 | 0.1287 |
| Page: 1 2 3 4 |
| Tissue | Expression Dynamics | Abbreviation |
| Esophagus |  | ESCC: Esophageal squamous cell carcinoma |
| HGIN: High-grade intraepithelial neoplasias | ||
| LGIN: Low-grade intraepithelial neoplasias | ||
| Skin | 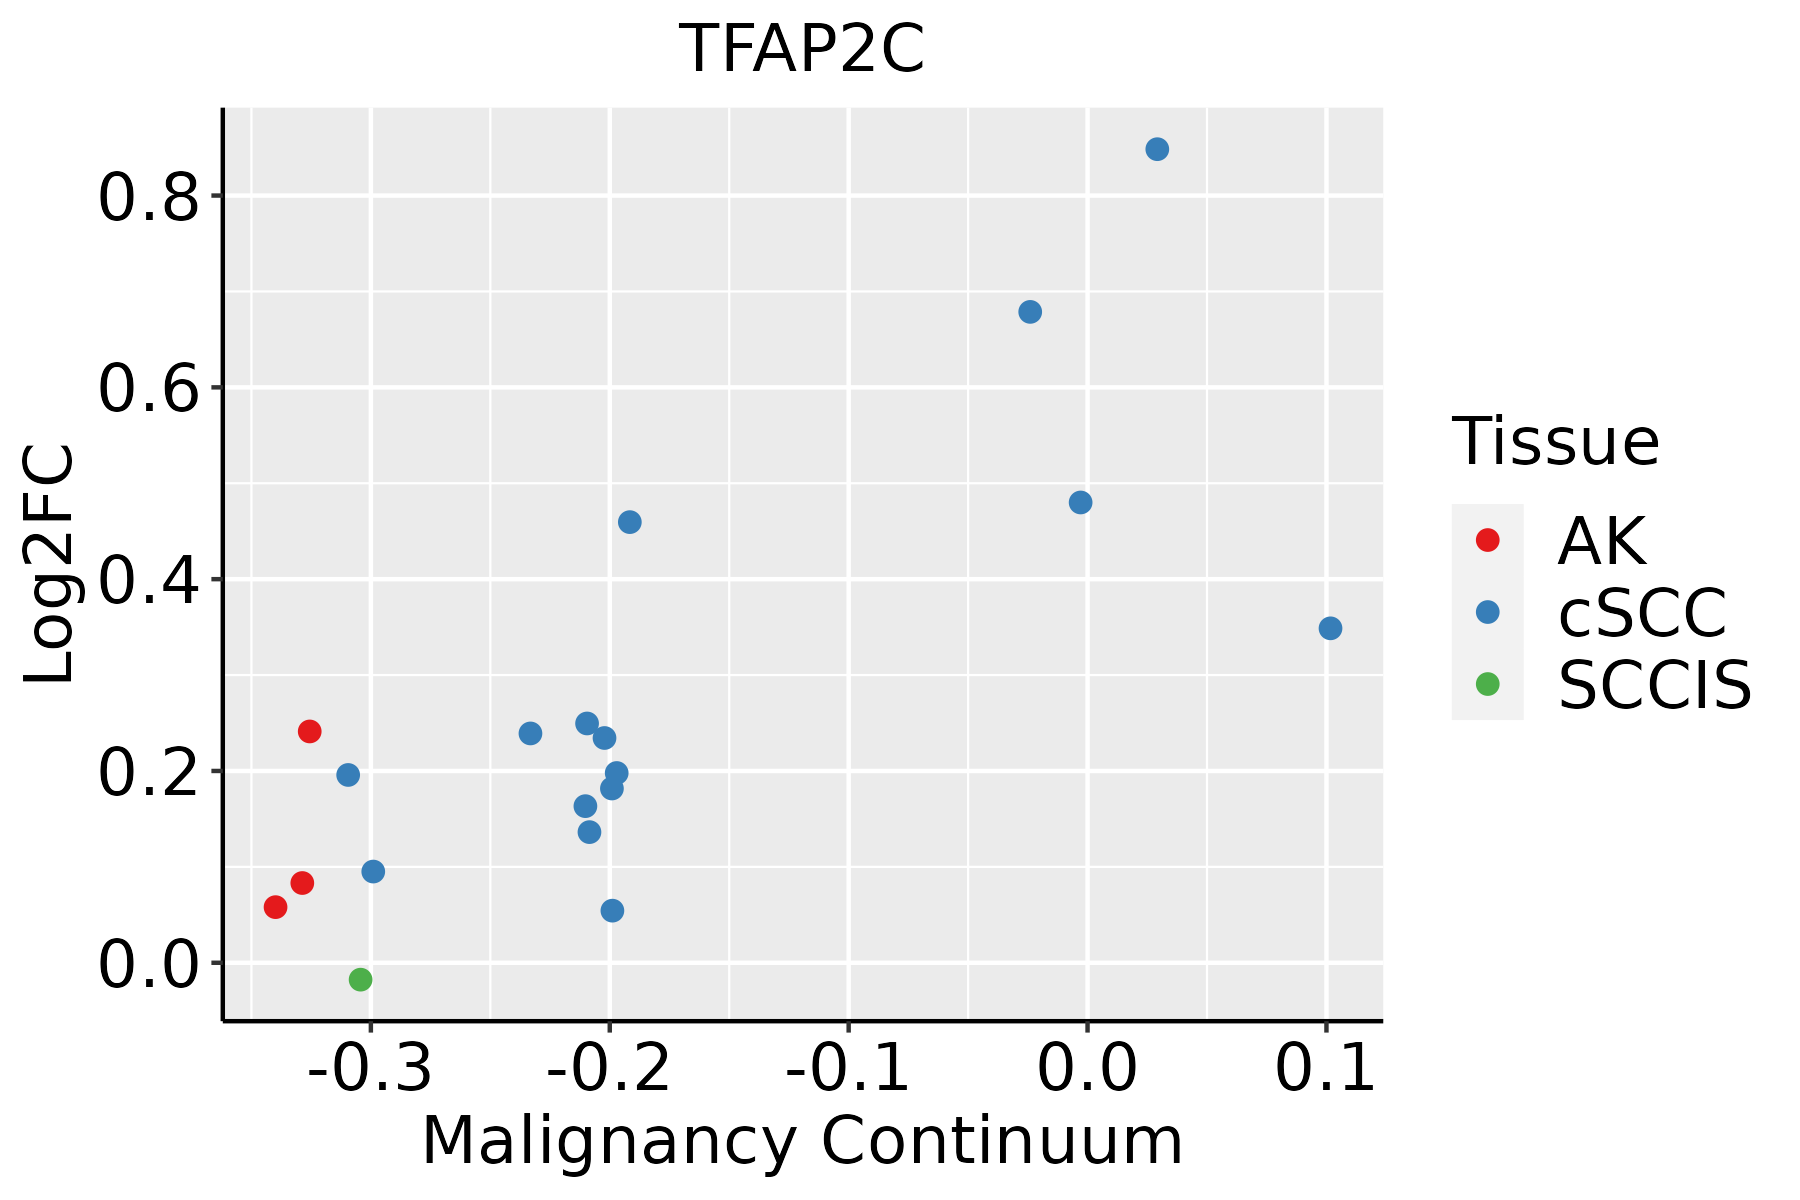 | AK: Actinic keratosis |
| cSCC: Cutaneous squamous cell carcinoma | ||
| SCCIS:squamous cell carcinoma in situ |
| ∗log2FC in expression of this searched gene in stem-like cells from each diseased tissue sample relative to stem-like cells in normal samples in each tissue plotted against the malignancy continuum. Samples are colored based on if they are from different disease stage. |
Top |
Malignant transformation related pathway analysis |
| Find out the enriched GO biological processes and KEGG pathways involved in transition from healthy to precancer to cancer |
| Tissue | Disease Stage | Enriched GO biological Processes |
| Colorectum | AD |  |
| Colorectum | SER |  |
| Colorectum | MSS |  |
| Colorectum | MSI-H |  |
| Colorectum | FAP |  |
| ∗Top 15 enriched GO BP terms are showed in the bar plot of each disease state in each tissue. Each row represents a significant GO biological process which is colored according to the -log10(p.adjust). |
| Page: 1 2 3 4 5 6 7 8 9 |
| GO ID | Tissue | Disease Stage | Description | Gene Ratio | Bg Ratio | pvalue | p.adjust | Count |
| GO:0061458110 | Esophagus | ESCC | reproductive system development | 247/8552 | 427/18723 | 2.24e-07 | 3.42e-06 | 247 |
| GO:00400295 | Esophagus | ESCC | regulation of gene expression, epigenetic | 74/8552 | 105/18723 | 2.24e-07 | 3.42e-06 | 74 |
| GO:004860818 | Esophagus | ESCC | reproductive structure development | 245/8552 | 424/18723 | 2.82e-07 | 4.14e-06 | 245 |
| GO:006145825 | Skin | cSCC | reproductive system development | 149/4864 | 427/18723 | 2.30e-05 | 2.65e-04 | 149 |
| GO:004860824 | Skin | cSCC | reproductive structure development | 148/4864 | 424/18723 | 2.40e-05 | 2.74e-04 | 148 |
| GO:00085845 | Skin | cSCC | male gonad development | 51/4864 | 141/18723 | 4.70e-03 | 2.40e-02 | 51 |
| GO:00465465 | Skin | cSCC | development of primary male sexual characteristics | 51/4864 | 142/18723 | 5.52e-03 | 2.73e-02 | 51 |
| GO:004002912 | Skin | cSCC | regulation of gene expression, epigenetic | 39/4864 | 105/18723 | 7.56e-03 | 3.53e-02 | 39 |
| Page: 1 |
| Pathway ID | Tissue | Disease Stage | Description | Gene Ratio | Bg Ratio | pvalue | p.adjust | qvalue | Count |
| Page: 1 |
Top |
Cell-cell communication analysis |
| Identification of potential cell-cell interactions between two cell types and their ligand-receptor pairs for different disease states |
| Ligand | Receptor | LRpair | Pathway | Tissue | Disease Stage |
| Page: 1 |
Top |
Single-cell gene regulatory network inference analysis |
| Find out the significant the regulons (TFs) and the target genes of each regulon across cell types for different disease states |
| TF | Cell Type | Tissue | Disease Stage | Target Gene | RSS | Regulon Activity |
| TFAP2C | ICAF | Endometrium | EEC | USP53,SULT1C4,NT5E, etc. | 3.02e-01 |  |
| TFAP2C | CD8TRM | Skin | cSCC | LDLRAP1,KRT1,ZNF165, etc. | 1.64e-01 |  |
| ∗The dot plots of a searched regulon are shown for all cell subpopulations in each disease state of each tissue based on the regulon specific score inferred using pySCENIC and by calculating the average expression. |
| Page: 1 |
Top |
Somatic mutation of malignant transformation related genes |
| Annotation of somatic variants for genes involved in malignant transformation |
| Hugo Symbol | Variant Class | Variant Classification | dbSNP RS | HGVSc | HGVSp | HGVSp Short | SWISSPROT | BIOTYPE | SIFT | PolyPhen | Tumor Sample Barcode | Tissue | Histology | Sex | Age | Stage | Therapy Types | Drugs | Outcome |
| TFAP2C | SNV | Missense_Mutation | c.654N>A | p.Met218Ile | p.M218I | Q92754 | protein_coding | tolerated(0.29) | benign(0) | TCGA-BH-A0B3-01 | Breast | breast invasive carcinoma | Female | <65 | I/II | Chemotherapy | cyclophosphamide | SD | |
| TFAP2C | SNV | Missense_Mutation | c.917T>C | p.Val306Ala | p.V306A | Q92754 | protein_coding | deleterious(0.02) | probably_damaging(0.997) | TCGA-D8-A1XQ-01 | Breast | breast invasive carcinoma | Female | >=65 | I/II | Unknown | Unknown | SD | |
| TFAP2C | SNV | Missense_Mutation | c.898N>C | p.Thr300Pro | p.T300P | Q92754 | protein_coding | deleterious(0) | probably_damaging(0.999) | TCGA-E9-A1R4-01 | Breast | breast invasive carcinoma | Female | >=65 | I/II | Chemotherapy | 5-fluorouracil | SD | |
| TFAP2C | insertion | Nonsense_Mutation | novel | c.1255_1256insGCTGATCATTTGGTACA | p.Ala419GlyfsTer2 | p.A419Gfs*2 | Q92754 | protein_coding | TCGA-A2-A0CT-01 | Breast | breast invasive carcinoma | Female | >=65 | I/II | Chemotherapy | cytoxan | SD | ||
| TFAP2C | insertion | Frame_Shift_Ins | novel | c.1257_1258insTTGAGTAAAAGCTGGTTACTTA | p.Ile421SerfsTer24 | p.I421Sfs*24 | Q92754 | protein_coding | TCGA-A2-A0CT-01 | Breast | breast invasive carcinoma | Female | >=65 | I/II | Chemotherapy | cytoxan | SD | ||
| TFAP2C | SNV | Missense_Mutation | novel | c.922G>A | p.Gly308Ser | p.G308S | Q92754 | protein_coding | deleterious(0.02) | probably_damaging(1) | TCGA-VS-A9UJ-01 | Cervix | cervical & endocervical cancer | Female | <65 | I/II | Unknown | Unknown | PD |
| TFAP2C | SNV | Missense_Mutation | c.202N>A | p.Ala68Thr | p.A68T | Q92754 | protein_coding | tolerated(0.35) | benign(0) | TCGA-AA-3663-01 | Colorectum | colon adenocarcinoma | Male | <65 | I/II | Unknown | Unknown | SD | |
| TFAP2C | SNV | Missense_Mutation | c.1198T>A | p.Phe400Ile | p.F400I | Q92754 | protein_coding | deleterious(0) | probably_damaging(0.999) | TCGA-AA-3812-01 | Colorectum | colon adenocarcinoma | Female | >=65 | I/II | Unknown | Unknown | PD | |
| TFAP2C | SNV | Missense_Mutation | c.1019N>A | p.Gly340Glu | p.G340E | Q92754 | protein_coding | tolerated(0.23) | probably_damaging(0.969) | TCGA-AA-3977-01 | Colorectum | colon adenocarcinoma | Male | >=65 | I/II | Unknown | Unknown | SD | |
| TFAP2C | SNV | Missense_Mutation | rs760198839 | c.1154A>G | p.Asn385Ser | p.N385S | Q92754 | protein_coding | tolerated(0.16) | benign(0.057) | TCGA-AA-3984-01 | Colorectum | colon adenocarcinoma | Female | <65 | I/II | Unknown | Unknown | SD |
| Page: 1 2 3 4 5 6 |
Top |
Related drugs of malignant transformation related genes |
| Identification of chemicals and drugs interact with genes involved in malignant transfromation |
| (DGIdb 4.0) |
| Entrez ID | Symbol | Category | Interaction Types | Drug Claim Name | Drug Name | PMIDs |
| Page: 1 |

Copyright 2023-Present -The University of Texas Health Science Center at Houston |