
|
|||||
|
 | |
| |
| |
| |
| |
| |
|
Gene: TFAP2B |
Gene summary for TFAP2B |
| Gene information | Species | Human | Gene symbol | TFAP2B | Gene ID | 7021 |
| Gene name | transcription factor AP-2 beta | |
| Gene Alias | AP-2B | |
| Cytomap | 6p12.3 | |
| Gene Type | protein-coding | GO ID | GO:0000122 | UniProtAcc | Q92481 |
Top |
Malignant transformation analysis |
| Identification of the aberrant gene expression in precancerous and cancerous lesions by comparing the gene expression of stem-like cells in diseased tissues with normal stem cells |
| Entrez ID | Symbol | Replicates | Species | Organ | Tissue | Adj P-value | Log2FC | Malignancy |
| 7021 | TFAP2B | GSM4909286 | Human | Breast | IDC | 3.51e-04 | -1.58e-01 | 0.1081 |
| 7021 | TFAP2B | GSM4909287 | Human | Breast | IDC | 1.36e-03 | -1.59e-01 | 0.2057 |
| 7021 | TFAP2B | GSM4909290 | Human | Breast | IDC | 4.18e-05 | 3.17e-01 | 0.2096 |
| 7021 | TFAP2B | GSM4909291 | Human | Breast | IDC | 2.50e-18 | 6.04e-01 | 0.1753 |
| 7021 | TFAP2B | GSM4909293 | Human | Breast | IDC | 5.61e-11 | 2.62e-01 | 0.1581 |
| 7021 | TFAP2B | GSM4909294 | Human | Breast | IDC | 5.75e-14 | 4.78e-01 | 0.2022 |
| 7021 | TFAP2B | GSM4909298 | Human | Breast | IDC | 1.36e-62 | 1.06e+00 | 0.1551 |
| 7021 | TFAP2B | GSM4909301 | Human | Breast | IDC | 7.79e-05 | -1.59e-01 | 0.1577 |
| 7021 | TFAP2B | GSM4909303 | Human | Breast | IDC | 8.79e-03 | 3.57e-01 | 0.0438 |
| 7021 | TFAP2B | GSM4909306 | Human | Breast | IDC | 1.73e-03 | 2.82e-01 | 0.1564 |
| 7021 | TFAP2B | GSM4909312 | Human | Breast | IDC | 7.43e-04 | -1.59e-01 | 0.1552 |
| 7021 | TFAP2B | GSM4909319 | Human | Breast | IDC | 1.65e-04 | -1.59e-01 | 0.1563 |
| 7021 | TFAP2B | brca2 | Human | Breast | Precancer | 9.42e-10 | 3.46e-01 | -0.024 |
| 7021 | TFAP2B | M2 | Human | Breast | IDC | 1.94e-07 | 6.19e-01 | 0.21 |
| 7021 | TFAP2B | NCCBC14 | Human | Breast | DCIS | 1.09e-04 | 3.28e-01 | 0.2021 |
| 7021 | TFAP2B | NCCBC6 | Human | Breast | DCIS | 7.41e-04 | 5.05e-01 | 0.2095 |
| 7021 | TFAP2B | P2 | Human | Breast | IDC | 1.09e-20 | 8.01e-01 | 0.21 |
| 7021 | TFAP2B | DCIS2 | Human | Breast | DCIS | 1.57e-22 | 1.19e-01 | 0.0085 |
| Page: 1 |
| Tissue | Expression Dynamics | Abbreviation |
| Breast | 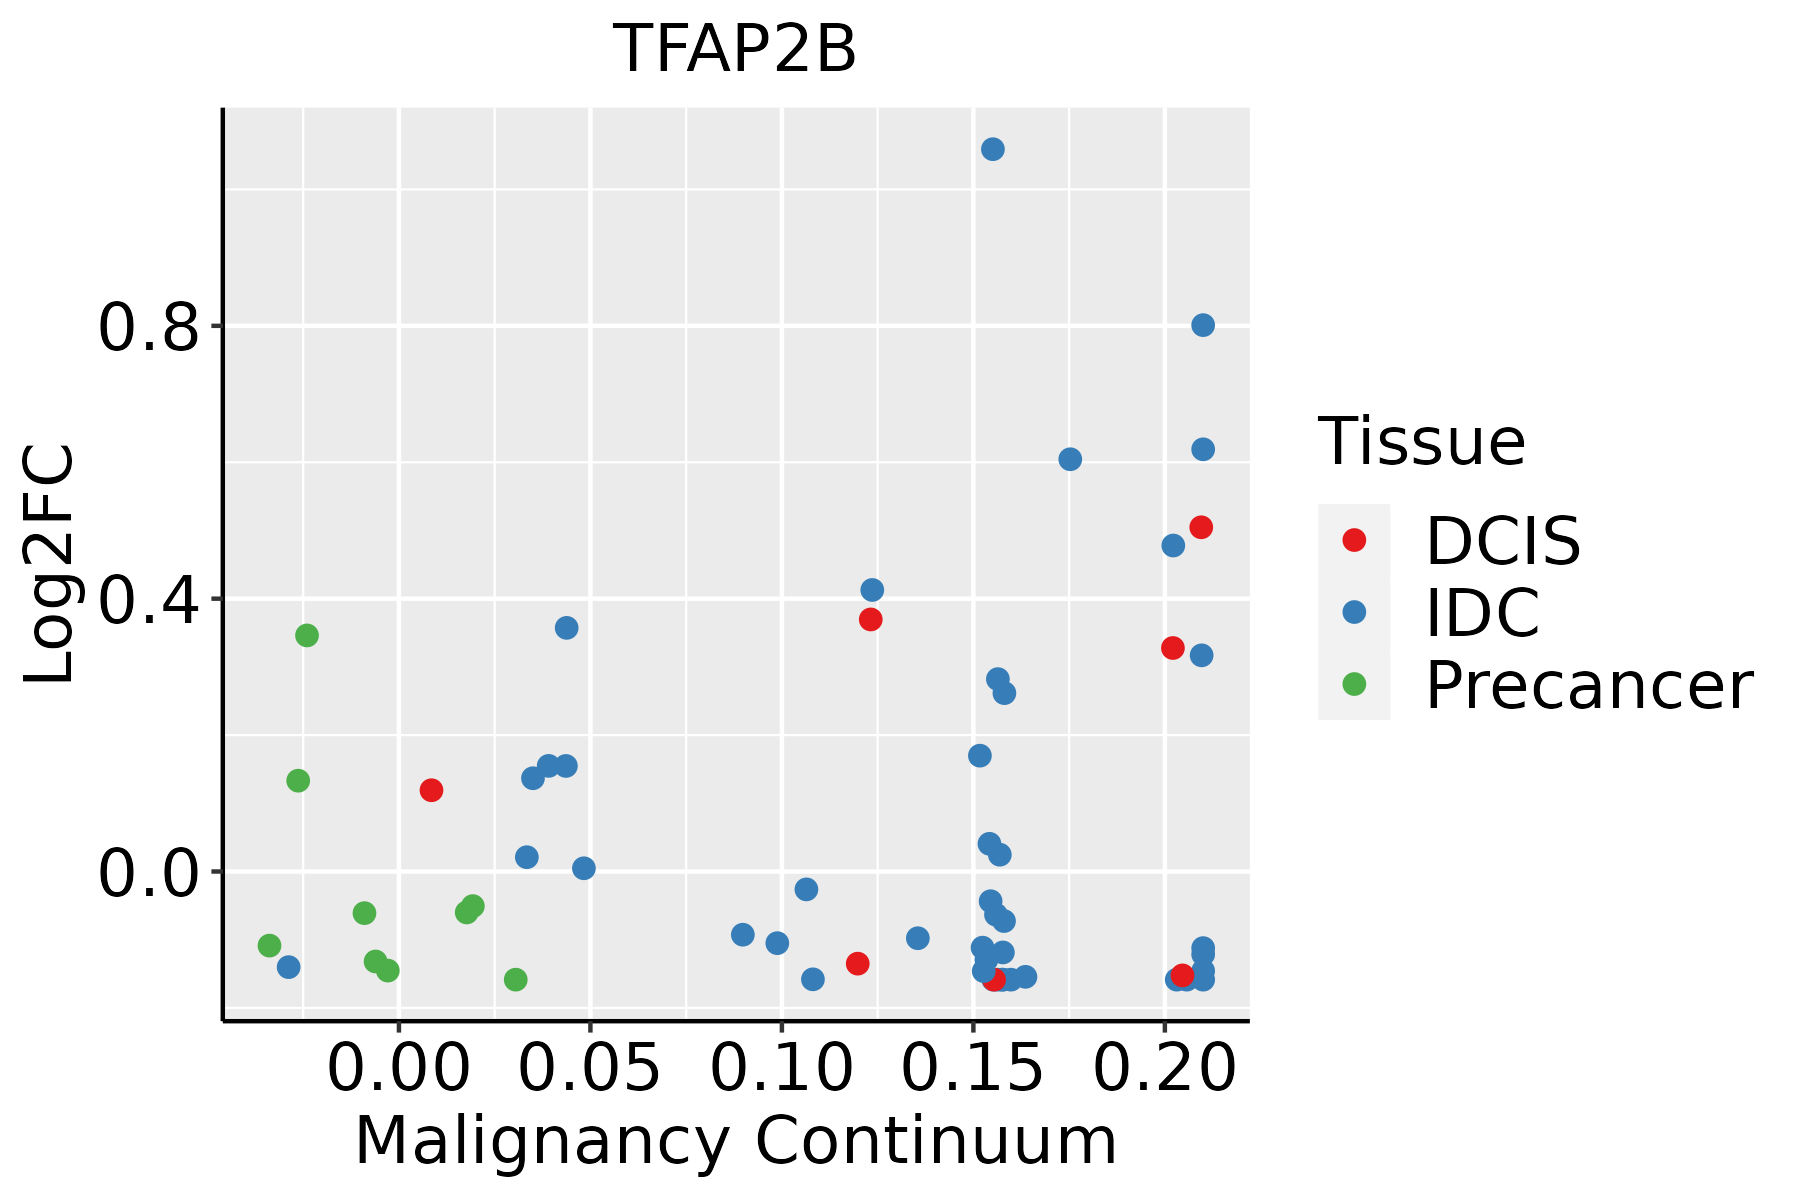 | IDC: Invasive ductal carcinoma |
| DCIS: Ductal carcinoma in situ | ||
| Precancer(BRCA1-mut): Precancerous lesion from BRCA1 mutation carriers |
| ∗log2FC in expression of this searched gene in stem-like cells from each diseased tissue sample relative to stem-like cells in normal samples in each tissue plotted against the malignancy continuum. Samples are colored based on if they are from different disease stage. |
Top |
Malignant transformation related pathway analysis |
| Find out the enriched GO biological processes and KEGG pathways involved in transition from healthy to precancer to cancer |
| Tissue | Disease Stage | Enriched GO biological Processes |
| Colorectum | AD |  |
| Colorectum | SER |  |
| Colorectum | MSS |  |
| Colorectum | MSI-H |  |
| Colorectum | FAP |  |
| ∗Top 15 enriched GO BP terms are showed in the bar plot of each disease state in each tissue. Each row represents a significant GO biological process which is colored according to the -log10(p.adjust). |
| Page: 1 2 3 4 5 6 7 8 9 |
| GO ID | Tissue | Disease Stage | Description | Gene Ratio | Bg Ratio | pvalue | p.adjust | Count |
| GO:00709979 | Breast | Precancer | neuron death | 50/1080 | 361/18723 | 7.75e-09 | 5.70e-07 | 50 |
| GO:00514029 | Breast | Precancer | neuron apoptotic process | 38/1080 | 246/18723 | 2.68e-08 | 1.75e-06 | 38 |
| GO:19012149 | Breast | Precancer | regulation of neuron death | 41/1080 | 319/18723 | 1.27e-06 | 4.80e-05 | 41 |
| GO:00435237 | Breast | Precancer | regulation of neuron apoptotic process | 31/1080 | 212/18723 | 1.69e-06 | 6.08e-05 | 31 |
| GO:00425938 | Breast | Precancer | glucose homeostasis | 31/1080 | 258/18723 | 8.89e-05 | 1.69e-03 | 31 |
| GO:00335008 | Breast | Precancer | carbohydrate homeostasis | 31/1080 | 259/18723 | 9.56e-05 | 1.79e-03 | 31 |
| GO:19012169 | Breast | Precancer | positive regulation of neuron death | 16/1080 | 97/18723 | 1.29e-04 | 2.24e-03 | 16 |
| GO:00508789 | Breast | Precancer | regulation of body fluid levels | 40/1080 | 379/18723 | 1.68e-04 | 2.77e-03 | 40 |
| GO:00094108 | Breast | Precancer | response to xenobiotic stimulus | 45/1080 | 462/18723 | 4.17e-04 | 5.56e-03 | 45 |
| GO:00435258 | Breast | Precancer | positive regulation of neuron apoptotic process | 11/1080 | 58/18723 | 4.17e-04 | 5.56e-03 | 11 |
| GO:00435243 | Breast | Precancer | negative regulation of neuron apoptotic process | 19/1080 | 145/18723 | 6.83e-04 | 8.34e-03 | 19 |
| GO:00454444 | Breast | Precancer | fat cell differentiation | 26/1080 | 229/18723 | 7.60e-04 | 9.04e-03 | 26 |
| GO:19012157 | Breast | Precancer | negative regulation of neuron death | 24/1080 | 208/18723 | 9.50e-04 | 1.07e-02 | 24 |
| GO:00060066 | Breast | Precancer | glucose metabolic process | 23/1080 | 196/18723 | 9.54e-04 | 1.07e-02 | 23 |
| GO:00507086 | Breast | Precancer | regulation of protein secretion | 28/1080 | 268/18723 | 1.76e-03 | 1.74e-02 | 28 |
| GO:00059966 | Breast | Precancer | monosaccharide metabolic process | 27/1080 | 257/18723 | 1.94e-03 | 1.88e-02 | 27 |
| GO:00193186 | Breast | Precancer | hexose metabolic process | 25/1080 | 237/18723 | 2.64e-03 | 2.36e-02 | 25 |
| GO:00158336 | Breast | Precancer | peptide transport | 27/1080 | 264/18723 | 2.84e-03 | 2.49e-02 | 27 |
| GO:00900875 | Breast | Precancer | regulation of peptide transport | 22/1080 | 202/18723 | 3.14e-03 | 2.65e-02 | 22 |
| GO:00300736 | Breast | Precancer | insulin secretion | 21/1080 | 195/18723 | 4.38e-03 | 3.42e-02 | 21 |
| Page: 1 2 3 4 |
| Pathway ID | Tissue | Disease Stage | Description | Gene Ratio | Bg Ratio | pvalue | p.adjust | qvalue | Count |
| Page: 1 |
Top |
Cell-cell communication analysis |
| Identification of potential cell-cell interactions between two cell types and their ligand-receptor pairs for different disease states |
| Ligand | Receptor | LRpair | Pathway | Tissue | Disease Stage |
| Page: 1 |
Top |
Single-cell gene regulatory network inference analysis |
| Find out the significant the regulons (TFs) and the target genes of each regulon across cell types for different disease states |
| TF | Cell Type | Tissue | Disease Stage | Target Gene | RSS | Regulon Activity |
| TFAP2B | INCAF | Oral cavity | ADJ | IGFBP2,C10orf10,SLC5A3, etc. | 1.06e-01 |  |
| TFAP2B | CAF | Oral cavity | ADJ | IGFBP2,C10orf10,SLC5A3, etc. | 4.28e-02 | |
| TFAP2B | ICAF | Oral cavity | LP | IGFBP2,C10orf10,SLC5A3, etc. | 1.77e-01 |  |
| TFAP2B | INCAF | Oral cavity | LP | IGFBP2,C10orf10,SLC5A3, etc. | 4.44e-01 | |
| TFAP2B | ICAF | Oral cavity | OSCC | IGFBP2,C10orf10,SLC5A3, etc. | 2.41e-01 |  |
| ∗The dot plots of a searched regulon are shown for all cell subpopulations in each disease state of each tissue based on the regulon specific score inferred using pySCENIC and by calculating the average expression. |
| Page: 1 |
Top |
Somatic mutation of malignant transformation related genes |
| Annotation of somatic variants for genes involved in malignant transformation |
| Hugo Symbol | Variant Class | Variant Classification | dbSNP RS | HGVSc | HGVSp | HGVSp Short | SWISSPROT | BIOTYPE | SIFT | PolyPhen | Tumor Sample Barcode | Tissue | Histology | Sex | Age | Stage | Therapy Types | Drugs | Outcome |
| TFAP2B | SNV | Missense_Mutation | c.585G>C | p.Gln195His | p.Q195H | Q92481 | protein_coding | tolerated(0.08) | probably_damaging(0.965) | TCGA-AR-A0TP-01 | Breast | breast invasive carcinoma | Female | <65 | I/II | Chemotherapy | doxorubicin | SD | |
| TFAP2B | SNV | Missense_Mutation | c.629C>T | p.Ser210Phe | p.S210F | Q92481 | protein_coding | deleterious(0) | probably_damaging(0.962) | TCGA-AR-A0TZ-01 | Breast | breast invasive carcinoma | Female | <65 | III/IV | Unspecific | Doxorubicin | PD | |
| TFAP2B | SNV | Missense_Mutation | c.1375N>G | p.Arg459Gly | p.R459G | Q92481 | protein_coding | deleterious(0) | possibly_damaging(0.879) | TCGA-C8-A12Y-01 | Breast | breast invasive carcinoma | Female | <65 | I/II | Unknown | Unknown | SD | |
| TFAP2B | SNV | Missense_Mutation | c.847N>G | p.Ser283Ala | p.S283A | Q92481 | protein_coding | tolerated(0.08) | benign(0.062) | TCGA-D8-A27R-01 | Breast | breast invasive carcinoma | Female | <65 | III/IV | Chemotherapy | adriamycin+cyclophosphamide | SD | |
| TFAP2B | SNV | Missense_Mutation | novel | c.839G>A | p.Gly280Glu | p.G280E | Q92481 | protein_coding | deleterious(0) | probably_damaging(1) | TCGA-E2-A1LE-01 | Breast | breast invasive carcinoma | Female | >=65 | III/IV | Chemotherapy | herceptin | PD |
| TFAP2B | insertion | In_Frame_Ins | novel | c.1343_1344insAAATCGTTGTGATTGTTGTGCTCT | p.Gly448_Ser449insAsnArgCysAspCysCysAlaLeu | p.G448_S449insNRCDCCAL | Q92481 | protein_coding | TCGA-AN-A0FS-01 | Breast | breast invasive carcinoma | Female | <65 | I/II | Unknown | Unknown | SD | ||
| TFAP2B | insertion | Frame_Shift_Ins | novel | c.1345_1346insT | p.Ser449MetfsTer2 | p.S449Mfs*2 | Q92481 | protein_coding | TCGA-AN-A0FS-01 | Breast | breast invasive carcinoma | Female | <65 | I/II | Unknown | Unknown | SD | ||
| TFAP2B | deletion | Frame_Shift_Del | novel | c.786delN | p.Leu263SerfsTer26 | p.L263Sfs*26 | Q92481 | protein_coding | TCGA-EW-A2FV-01 | Breast | breast invasive carcinoma | Female | <65 | III/IV | Chemotherapy | docetaxel | SD | ||
| TFAP2B | insertion | Frame_Shift_Ins | novel | c.836dupA | p.Asn279LysfsTer43 | p.N279Kfs*43 | Q92481 | protein_coding | TCGA-2W-A8YY-01 | Cervix | cervical & endocervical cancer | Female | <65 | I/II | Chemotherapy | cisplatin | CR | ||
| TFAP2B | SNV | Missense_Mutation | c.640A>G | p.Asn214Asp | p.N214D | Q92481 | protein_coding | tolerated(0.08) | benign(0.051) | TCGA-A6-5660-01 | Colorectum | colon adenocarcinoma | Male | >=65 | III/IV | Ancillary | leucovorin | SD |
| Page: 1 2 3 4 5 6 7 8 9 10 |
Top |
Related drugs of malignant transformation related genes |
| Identification of chemicals and drugs interact with genes involved in malignant transfromation |
| (DGIdb 4.0) |
| Entrez ID | Symbol | Category | Interaction Types | Drug Claim Name | Drug Name | PMIDs |
| Page: 1 |

Copyright 2023-Present -The University of Texas Health Science Center at Houston |