
|
|||||
|
 | |
| |
| |
| |
| |
| |
|
Gene: TFAP2A |
Gene summary for TFAP2A |
| Gene information | Species | Human | Gene symbol | TFAP2A | Gene ID | 7020 |
| Gene name | transcription factor AP-2 alpha | |
| Gene Alias | AP-2 | |
| Cytomap | 6p24.3 | |
| Gene Type | protein-coding | GO ID | GO:0000122 | UniProtAcc | P05549 |
Top |
Malignant transformation analysis |
| Identification of the aberrant gene expression in precancerous and cancerous lesions by comparing the gene expression of stem-like cells in diseased tissues with normal stem cells |
| Entrez ID | Symbol | Replicates | Species | Organ | Tissue | Adj P-value | Log2FC | Malignancy |
| 7020 | TFAP2A | AEH-subject5 | Human | Endometrium | AEH | 2.74e-08 | 1.95e-01 | -0.2953 |
| 7020 | TFAP2A | GSM5276935 | Human | Endometrium | EEC | 3.10e-53 | 6.83e-01 | -0.123 |
| 7020 | TFAP2A | GSM6177620_NYU_UCEC1_lib1_lib1 | Human | Endometrium | EEC | 1.76e-09 | 4.67e-01 | -0.1869 |
| 7020 | TFAP2A | GSM6177620_NYU_UCEC1_lib2_lib2 | Human | Endometrium | EEC | 2.68e-10 | 5.32e-01 | -0.1875 |
| 7020 | TFAP2A | GSM6177620_NYU_UCEC1_lib3_lib3 | Human | Endometrium | EEC | 4.32e-12 | 5.27e-01 | -0.1883 |
| 7020 | TFAP2A | GSM6177621_NYU_UCEC2_lib1_lib1 | Human | Endometrium | EEC | 1.95e-12 | 4.53e-01 | -0.1934 |
| 7020 | TFAP2A | GSM6177622_NYU_UCEC3_lib1_lib1 | Human | Endometrium | EEC | 8.72e-09 | 4.18e-01 | -0.1917 |
| 7020 | TFAP2A | GSM6177622_NYU_UCEC3_lib2_lib2 | Human | Endometrium | EEC | 8.13e-10 | 4.68e-01 | -0.1916 |
| 7020 | TFAP2A | GSM6177623_NYU_UCEC3_Vis | Human | Endometrium | EEC | 6.66e-10 | 3.14e-01 | -0.1269 |
| 7020 | TFAP2A | LZE4T | Human | Esophagus | ESCC | 6.76e-07 | 2.70e-01 | 0.0811 |
| 7020 | TFAP2A | LZE7T | Human | Esophagus | ESCC | 9.76e-06 | 3.37e-01 | 0.0667 |
| 7020 | TFAP2A | LZE8T | Human | Esophagus | ESCC | 3.18e-06 | 2.86e-01 | 0.067 |
| 7020 | TFAP2A | LZE20T | Human | Esophagus | ESCC | 4.10e-15 | 4.69e-01 | 0.0662 |
| 7020 | TFAP2A | LZE22D1 | Human | Esophagus | HGIN | 1.90e-07 | 2.45e-01 | 0.0595 |
| 7020 | TFAP2A | LZE22T | Human | Esophagus | ESCC | 8.58e-07 | 7.53e-01 | 0.068 |
| 7020 | TFAP2A | LZE24T | Human | Esophagus | ESCC | 5.71e-19 | 7.27e-01 | 0.0596 |
| 7020 | TFAP2A | LZE21T | Human | Esophagus | ESCC | 1.42e-02 | 5.79e-01 | 0.0655 |
| 7020 | TFAP2A | P1T-E | Human | Esophagus | ESCC | 3.95e-22 | 9.82e-01 | 0.0875 |
| 7020 | TFAP2A | P2T-E | Human | Esophagus | ESCC | 6.18e-90 | 2.07e+00 | 0.1177 |
| 7020 | TFAP2A | P4T-E | Human | Esophagus | ESCC | 1.63e-24 | 6.25e-01 | 0.1323 |
| Page: 1 2 3 4 5 6 |
| Tissue | Expression Dynamics | Abbreviation |
| Endometrium |  | AEH: Atypical endometrial hyperplasia |
| EEC: Endometrioid Cancer | ||
| Esophagus |  | ESCC: Esophageal squamous cell carcinoma |
| HGIN: High-grade intraepithelial neoplasias | ||
| LGIN: Low-grade intraepithelial neoplasias | ||
| Oral Cavity | 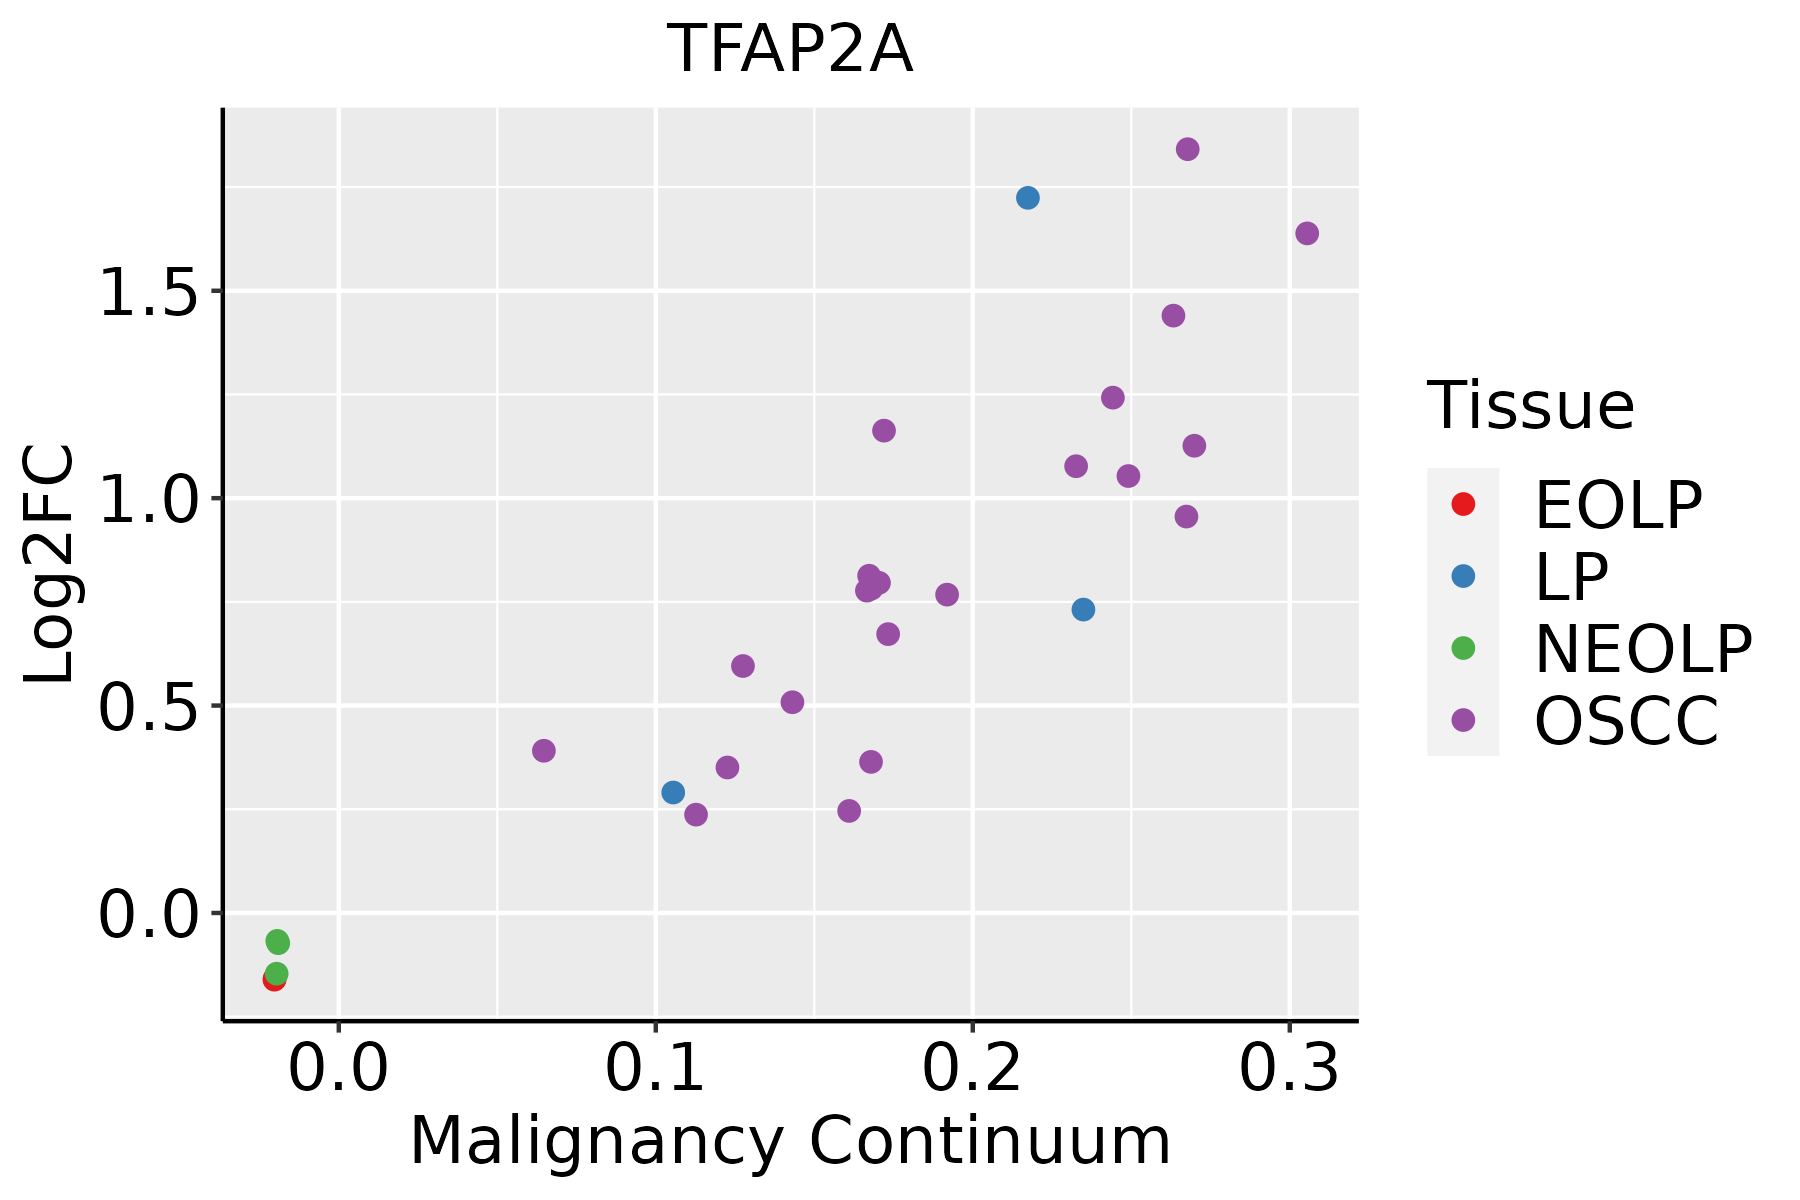 | EOLP: Erosive Oral lichen planus |
| LP: leukoplakia | ||
| NEOLP: Non-erosive oral lichen planus | ||
| OSCC: Oral squamous cell carcinoma | ||
| Skin | 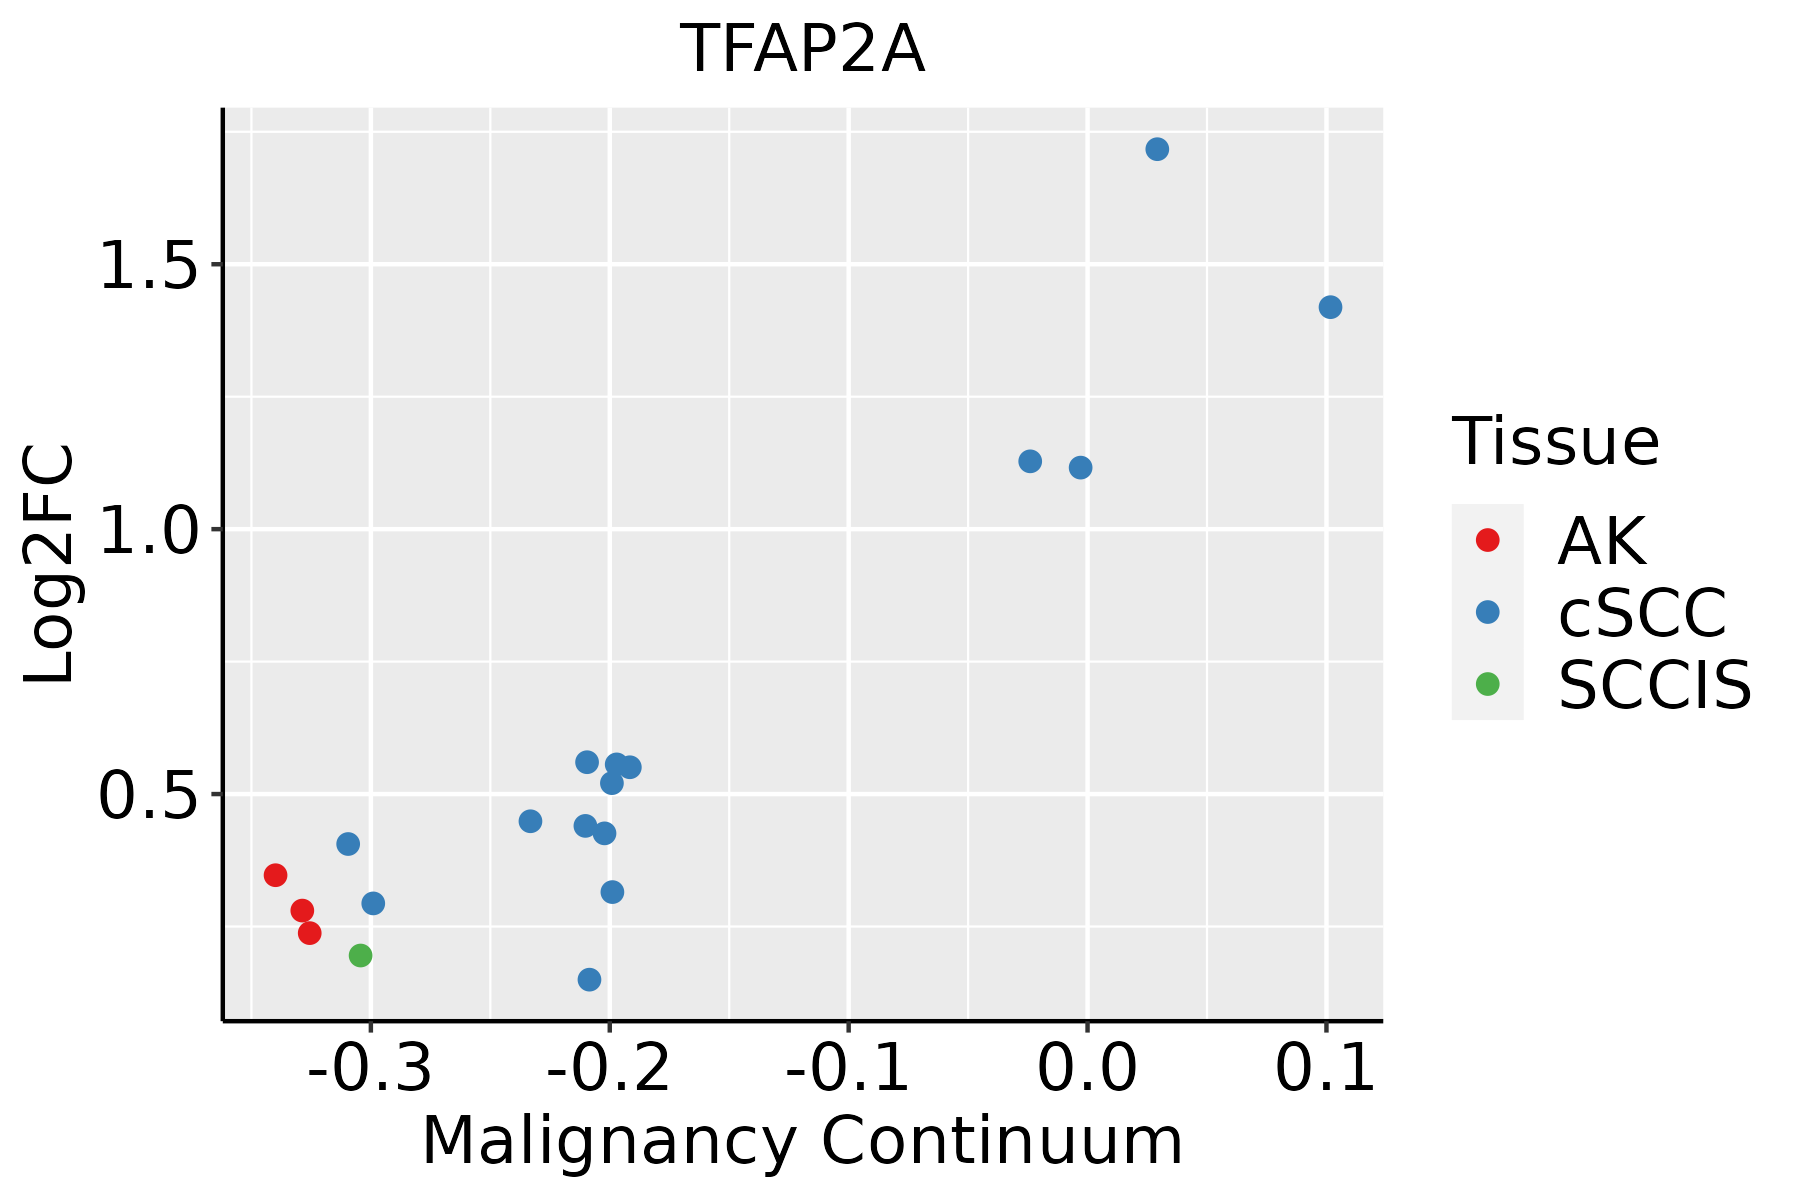 | AK: Actinic keratosis |
| cSCC: Cutaneous squamous cell carcinoma | ||
| SCCIS:squamous cell carcinoma in situ |
| ∗log2FC in expression of this searched gene in stem-like cells from each diseased tissue sample relative to stem-like cells in normal samples in each tissue plotted against the malignancy continuum. Samples are colored based on if they are from different disease stage. |
Top |
Malignant transformation related pathway analysis |
| Find out the enriched GO biological processes and KEGG pathways involved in transition from healthy to precancer to cancer |
| Tissue | Disease Stage | Enriched GO biological Processes |
| Colorectum | AD |  |
| Colorectum | SER |  |
| Colorectum | MSS |  |
| Colorectum | MSI-H |  |
| Colorectum | FAP |  |
| ∗Top 15 enriched GO BP terms are showed in the bar plot of each disease state in each tissue. Each row represents a significant GO biological process which is colored according to the -log10(p.adjust). |
| Page: 1 2 3 4 5 6 7 8 9 |
| GO ID | Tissue | Disease Stage | Description | Gene Ratio | Bg Ratio | pvalue | p.adjust | Count |
| GO:00015038 | Endometrium | AEH | ossification | 78/2100 | 408/18723 | 1.54e-06 | 4.85e-05 | 78 |
| GO:00016556 | Endometrium | AEH | urogenital system development | 67/2100 | 338/18723 | 2.30e-06 | 6.76e-05 | 67 |
| GO:00720015 | Endometrium | AEH | renal system development | 61/2100 | 302/18723 | 3.43e-06 | 9.24e-05 | 61 |
| GO:190121616 | Endometrium | AEH | positive regulation of neuron death | 27/2100 | 97/18723 | 5.35e-06 | 1.36e-04 | 27 |
| GO:00018224 | Endometrium | AEH | kidney development | 57/2100 | 293/18723 | 2.25e-05 | 4.35e-04 | 57 |
| GO:001003816 | Endometrium | AEH | response to metal ion | 65/2100 | 373/18723 | 2.02e-04 | 2.54e-03 | 65 |
| GO:004352510 | Endometrium | AEH | positive regulation of neuron apoptotic process | 16/2100 | 58/18723 | 4.75e-04 | 4.91e-03 | 16 |
| GO:00351073 | Endometrium | AEH | appendage morphogenesis | 29/2100 | 138/18723 | 6.06e-04 | 5.94e-03 | 29 |
| GO:00351083 | Endometrium | AEH | limb morphogenesis | 29/2100 | 138/18723 | 6.06e-04 | 5.94e-03 | 29 |
| GO:00487366 | Endometrium | AEH | appendage development | 33/2100 | 172/18723 | 1.41e-03 | 1.18e-02 | 33 |
| GO:00601736 | Endometrium | AEH | limb development | 33/2100 | 172/18723 | 1.41e-03 | 1.18e-02 | 33 |
| GO:0010944 | Endometrium | AEH | negative regulation of transcription by competitive promoter binding | 5/2100 | 10/18723 | 2.74e-03 | 1.97e-02 | 5 |
| GO:0030326 | Endometrium | AEH | embryonic limb morphogenesis | 23/2100 | 116/18723 | 4.58e-03 | 2.95e-02 | 23 |
| GO:0035113 | Endometrium | AEH | embryonic appendage morphogenesis | 23/2100 | 116/18723 | 4.58e-03 | 2.95e-02 | 23 |
| GO:0070167 | Endometrium | AEH | regulation of biomineral tissue development | 20/2100 | 97/18723 | 5.00e-03 | 3.14e-02 | 20 |
| GO:0035115 | Endometrium | AEH | embryonic forelimb morphogenesis | 9/2100 | 31/18723 | 5.59e-03 | 3.44e-02 | 9 |
| GO:190121416 | Endometrium | AEH | regulation of neuron death | 51/2100 | 319/18723 | 5.82e-03 | 3.55e-02 | 51 |
| GO:00302822 | Endometrium | AEH | bone mineralization | 23/2100 | 119/18723 | 6.32e-03 | 3.75e-02 | 23 |
| GO:0110149 | Endometrium | AEH | regulation of biomineralization | 20/2100 | 99/18723 | 6.34e-03 | 3.76e-02 | 20 |
| GO:00163313 | Endometrium | AEH | morphogenesis of embryonic epithelium | 27/2100 | 147/18723 | 6.70e-03 | 3.94e-02 | 27 |
| Page: 1 2 3 4 5 6 7 |
| Pathway ID | Tissue | Disease Stage | Description | Gene Ratio | Bg Ratio | pvalue | p.adjust | qvalue | Count |
| Page: 1 |
Top |
Cell-cell communication analysis |
| Identification of potential cell-cell interactions between two cell types and their ligand-receptor pairs for different disease states |
| Ligand | Receptor | LRpair | Pathway | Tissue | Disease Stage |
| Page: 1 |
Top |
Single-cell gene regulatory network inference analysis |
| Find out the significant the regulons (TFs) and the target genes of each regulon across cell types for different disease states |
| TF | Cell Type | Tissue | Disease Stage | Target Gene | RSS | Regulon Activity |
| TFAP2A | NEUT | Cervix | HSIL_HPV | S100A7,FABP5,HS3ST4, etc. | 4.34e-01 |  |
| TFAP2A | M1MAC | Cervix | HSIL_HPV | S100A7,FABP5,HS3ST4, etc. | 7.66e-03 | |
| TFAP2A | NEUT | Cervix | N_HPV | S100A7,FABP5,HS3ST4, etc. | 4.75e-01 |  |
| TFAP2A | DUCT1 | Pancreas | PDAC | MIA,HOXB3,SMAD7, etc. | 6.25e-01 |  |
| TFAP2A | DPC | Skin | ADJ | KRT5,KRT14,SDC1, etc. | 1.24e-01 |  |
| ∗The dot plots of a searched regulon are shown for all cell subpopulations in each disease state of each tissue based on the regulon specific score inferred using pySCENIC and by calculating the average expression. |
| Page: 1 |
Top |
Somatic mutation of malignant transformation related genes |
| Annotation of somatic variants for genes involved in malignant transformation |
| Hugo Symbol | Variant Class | Variant Classification | dbSNP RS | HGVSc | HGVSp | HGVSp Short | SWISSPROT | BIOTYPE | SIFT | PolyPhen | Tumor Sample Barcode | Tissue | Histology | Sex | Age | Stage | Therapy Types | Drugs | Outcome |
| TFAP2A | SNV | Missense_Mutation | c.262N>G | p.Gln88Glu | p.Q88E | P05549 | protein_coding | tolerated(0.21) | possibly_damaging(0.759) | TCGA-A2-A1G0-01 | Breast | breast invasive carcinoma | Female | <65 | I/II | Chemotherapy | taxotere | SD | |
| TFAP2A | SNV | Missense_Mutation | c.476N>C | p.Val159Ala | p.V159A | P05549 | protein_coding | tolerated(0.1) | benign(0) | TCGA-A7-A13F-01 | Breast | breast invasive carcinoma | Female | <65 | III/IV | Chemotherapy | doxorubicin | SD | |
| TFAP2A | SNV | Missense_Mutation | c.625G>A | p.Glu209Lys | p.E209K | P05549 | protein_coding | deleterious(0.01) | benign(0.404) | TCGA-AO-A0J9-01 | Breast | breast invasive carcinoma | Female | <65 | III/IV | Chemotherapy | cyclophosphamide | PD | |
| TFAP2A | SNV | Missense_Mutation | c.1043N>G | p.Phe348Cys | p.F348C | P05549 | protein_coding | deleterious(0) | probably_damaging(0.946) | TCGA-AO-A0JM-01 | Breast | breast invasive carcinoma | Female | <65 | I/II | Chemotherapy | doxorubicin | SD | |
| TFAP2A | SNV | Missense_Mutation | c.1033T>C | p.Cys345Arg | p.C345R | P05549 | protein_coding | deleterious(0) | probably_damaging(0.96) | TCGA-BH-A0BS-01 | Breast | breast invasive carcinoma | Female | <65 | III/IV | Chemotherapy | adriamycin | CR | |
| TFAP2A | SNV | Missense_Mutation | c.572N>T | p.Ser191Phe | p.S191F | P05549 | protein_coding | deleterious(0.05) | benign(0.243) | TCGA-EW-A6SA-01 | Breast | breast invasive carcinoma | Male | <65 | I/II | Unknown | Unknown | SD | |
| TFAP2A | SNV | Missense_Mutation | c.740N>T | p.Ser247Leu | p.S247L | P05549 | protein_coding | deleterious(0.01) | benign(0.202) | TCGA-C5-A1MN-01 | Cervix | cervical & endocervical cancer | Female | <65 | III/IV | Chemotherapy | cisplatin | SD | |
| TFAP2A | SNV | Missense_Mutation | rs151344526 | c.724G>A | p.Glu242Lys | p.E242K | P05549 | protein_coding | deleterious(0.01) | possibly_damaging(0.508) | TCGA-C5-A3HD-01 | Cervix | cervical & endocervical cancer | Female | <65 | I/II | Chemotherapy | cisplatin | SD |
| TFAP2A | SNV | Missense_Mutation | novel | c.161N>T | p.Gln54Leu | p.Q54L | P05549 | protein_coding | deleterious(0.03) | possibly_damaging(0.885) | TCGA-DS-A1OD-01 | Cervix | cervical & endocervical cancer | Female | <65 | I/II | Chemotherapy | cisplatin | SD |
| TFAP2A | SNV | Missense_Mutation | c.878T>G | p.Val293Gly | p.V293G | P05549 | protein_coding | deleterious(0) | probably_damaging(0.998) | TCGA-EK-A2PM-01 | Cervix | cervical & endocervical cancer | Female | >=65 | I/II | Unknown | Unknown | SD |
| Page: 1 2 3 4 5 6 7 |
Top |
Related drugs of malignant transformation related genes |
| Identification of chemicals and drugs interact with genes involved in malignant transfromation |
| (DGIdb 4.0) |
| Entrez ID | Symbol | Category | Interaction Types | Drug Claim Name | Drug Name | PMIDs |
| 7020 | TFAP2A | TRANSCRIPTION FACTOR | HORMONES | 12704799 | ||
| 7020 | TFAP2A | TRANSCRIPTION FACTOR | NELFINAVIR | NELFINAVIR | 10996400 | |
| 7020 | TFAP2A | TRANSCRIPTION FACTOR | INDINAVIR | INDINAVIR | 10996400 | |
| 7020 | TFAP2A | TRANSCRIPTION FACTOR | TUMOR NECROSIS FACTOR | 11438643 | ||
| 7020 | TFAP2A | TRANSCRIPTION FACTOR | AMPRENAVIR | AMPRENAVIR | 10996400 | |
| 7020 | TFAP2A | TRANSCRIPTION FACTOR | TNF-ALPHA | 11438643 |
| Page: 1 |

Copyright 2023-Present -The University of Texas Health Science Center at Houston |