
|
|||||
|
 | |
| |
| |
| |
| |
| |
|
Gene: TFAM |
Gene summary for TFAM |
| Gene information | Species | Human | Gene symbol | TFAM | Gene ID | 7019 |
| Gene name | transcription factor A, mitochondrial | |
| Gene Alias | MTDPS15 | |
| Cytomap | 10q21.1 | |
| Gene Type | protein-coding | GO ID | GO:0000959 | UniProtAcc | Q00059 |
Top |
Malignant transformation analysis |
| Identification of the aberrant gene expression in precancerous and cancerous lesions by comparing the gene expression of stem-like cells in diseased tissues with normal stem cells |
| Entrez ID | Symbol | Replicates | Species | Organ | Tissue | Adj P-value | Log2FC | Malignancy |
| 7019 | TFAM | LZE2T | Human | Esophagus | ESCC | 2.07e-02 | 7.41e-01 | 0.082 |
| 7019 | TFAM | LZE4T | Human | Esophagus | ESCC | 1.93e-10 | 3.22e-01 | 0.0811 |
| 7019 | TFAM | LZE8T | Human | Esophagus | ESCC | 6.53e-07 | 1.52e-01 | 0.067 |
| 7019 | TFAM | LZE20T | Human | Esophagus | ESCC | 1.90e-04 | 1.27e-01 | 0.0662 |
| 7019 | TFAM | LZE24T | Human | Esophagus | ESCC | 3.44e-11 | 5.50e-01 | 0.0596 |
| 7019 | TFAM | LZE21T | Human | Esophagus | ESCC | 4.26e-02 | 1.19e-01 | 0.0655 |
| 7019 | TFAM | P1T-E | Human | Esophagus | ESCC | 3.51e-04 | 3.60e-01 | 0.0875 |
| 7019 | TFAM | P2T-E | Human | Esophagus | ESCC | 6.19e-52 | 9.91e-01 | 0.1177 |
| 7019 | TFAM | P4T-E | Human | Esophagus | ESCC | 1.98e-33 | 1.12e+00 | 0.1323 |
| 7019 | TFAM | P5T-E | Human | Esophagus | ESCC | 1.80e-21 | 8.06e-01 | 0.1327 |
| 7019 | TFAM | P8T-E | Human | Esophagus | ESCC | 8.06e-36 | 7.98e-01 | 0.0889 |
| 7019 | TFAM | P9T-E | Human | Esophagus | ESCC | 6.98e-18 | 3.33e-01 | 0.1131 |
| 7019 | TFAM | P10T-E | Human | Esophagus | ESCC | 8.18e-24 | 6.36e-01 | 0.116 |
| 7019 | TFAM | P11T-E | Human | Esophagus | ESCC | 1.11e-13 | 7.14e-01 | 0.1426 |
| 7019 | TFAM | P12T-E | Human | Esophagus | ESCC | 2.23e-37 | 9.20e-01 | 0.1122 |
| 7019 | TFAM | P15T-E | Human | Esophagus | ESCC | 6.85e-28 | 6.09e-01 | 0.1149 |
| 7019 | TFAM | P16T-E | Human | Esophagus | ESCC | 9.31e-41 | 9.87e-01 | 0.1153 |
| 7019 | TFAM | P20T-E | Human | Esophagus | ESCC | 1.56e-18 | 4.77e-01 | 0.1124 |
| 7019 | TFAM | P21T-E | Human | Esophagus | ESCC | 8.32e-41 | 1.14e+00 | 0.1617 |
| 7019 | TFAM | P22T-E | Human | Esophagus | ESCC | 4.89e-24 | 5.35e-01 | 0.1236 |
| Page: 1 2 3 4 5 6 |
| Tissue | Expression Dynamics | Abbreviation |
| Esophagus | 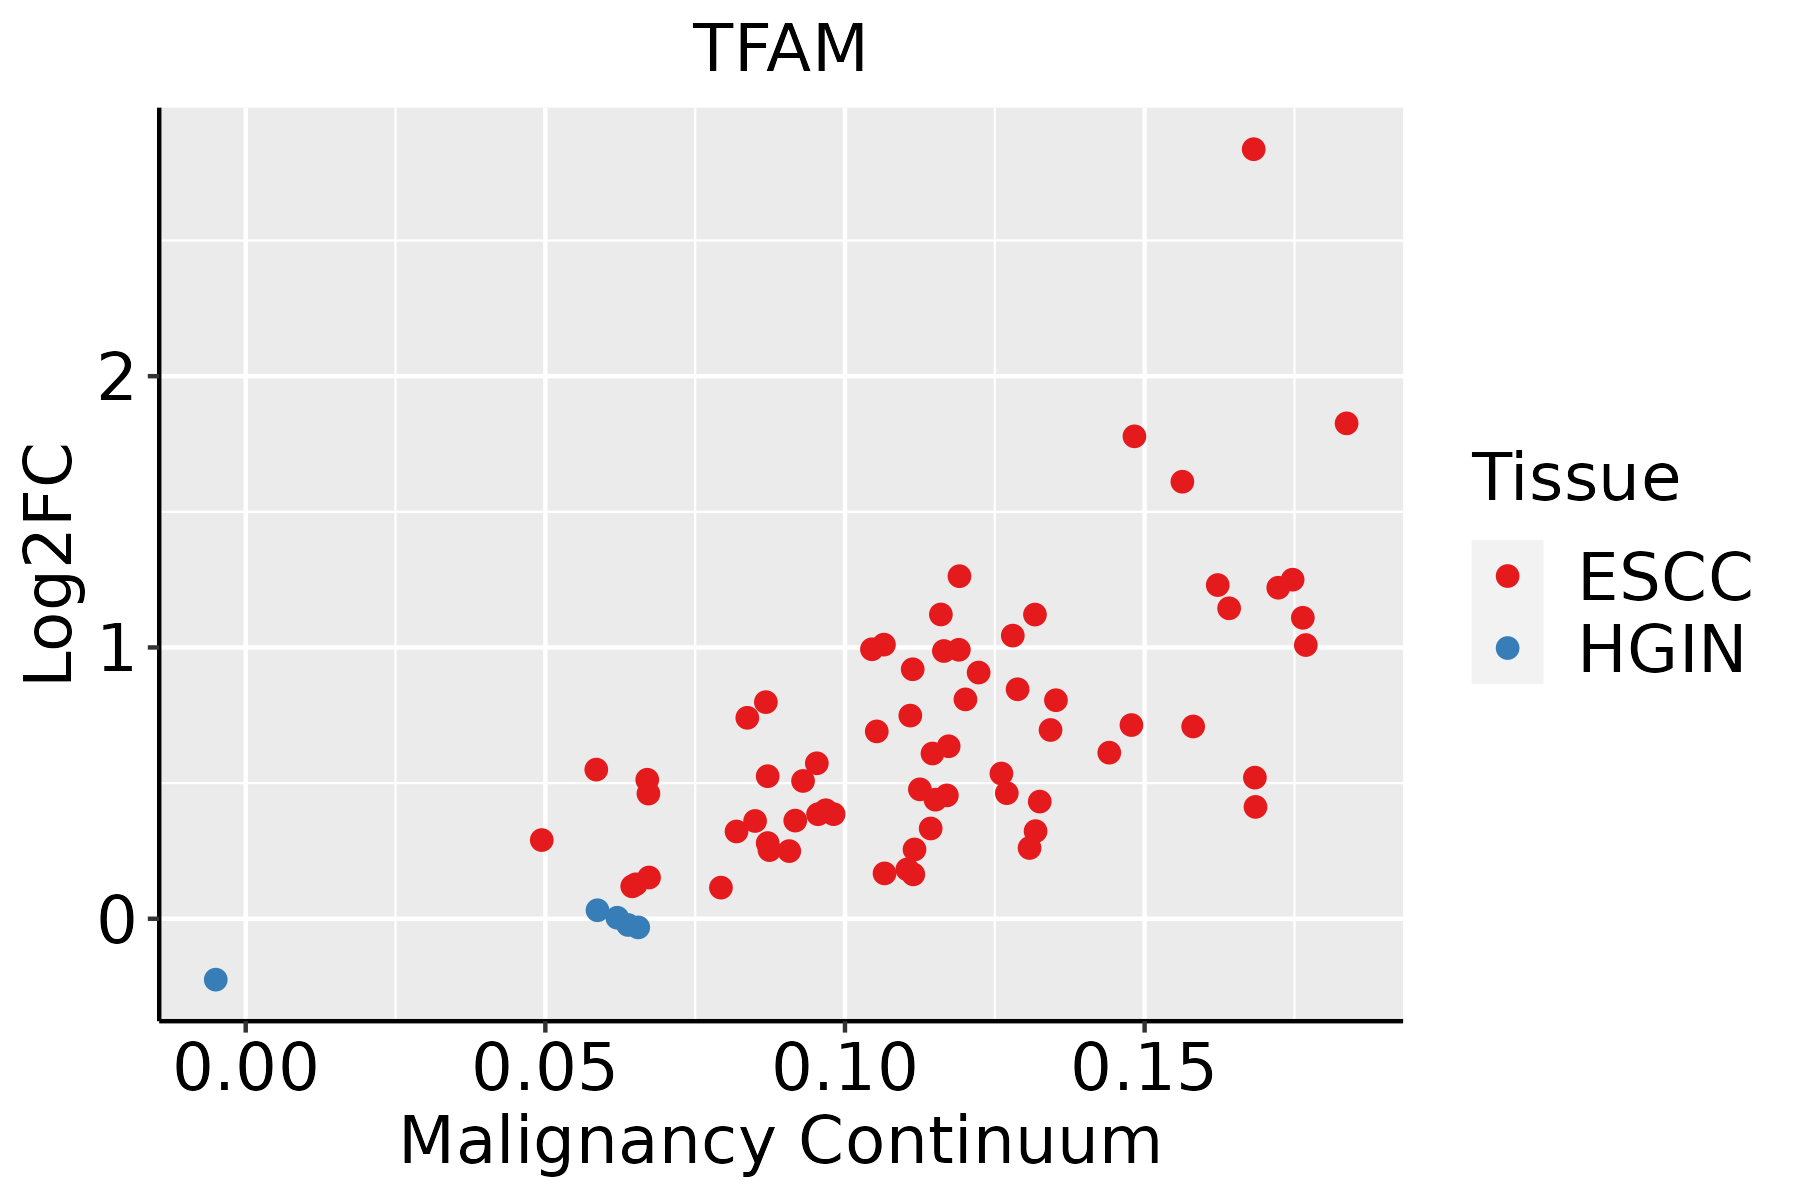 | ESCC: Esophageal squamous cell carcinoma |
| HGIN: High-grade intraepithelial neoplasias | ||
| LGIN: Low-grade intraepithelial neoplasias | ||
| Liver |  | HCC: Hepatocellular carcinoma |
| NAFLD: Non-alcoholic fatty liver disease | ||
| Oral Cavity | 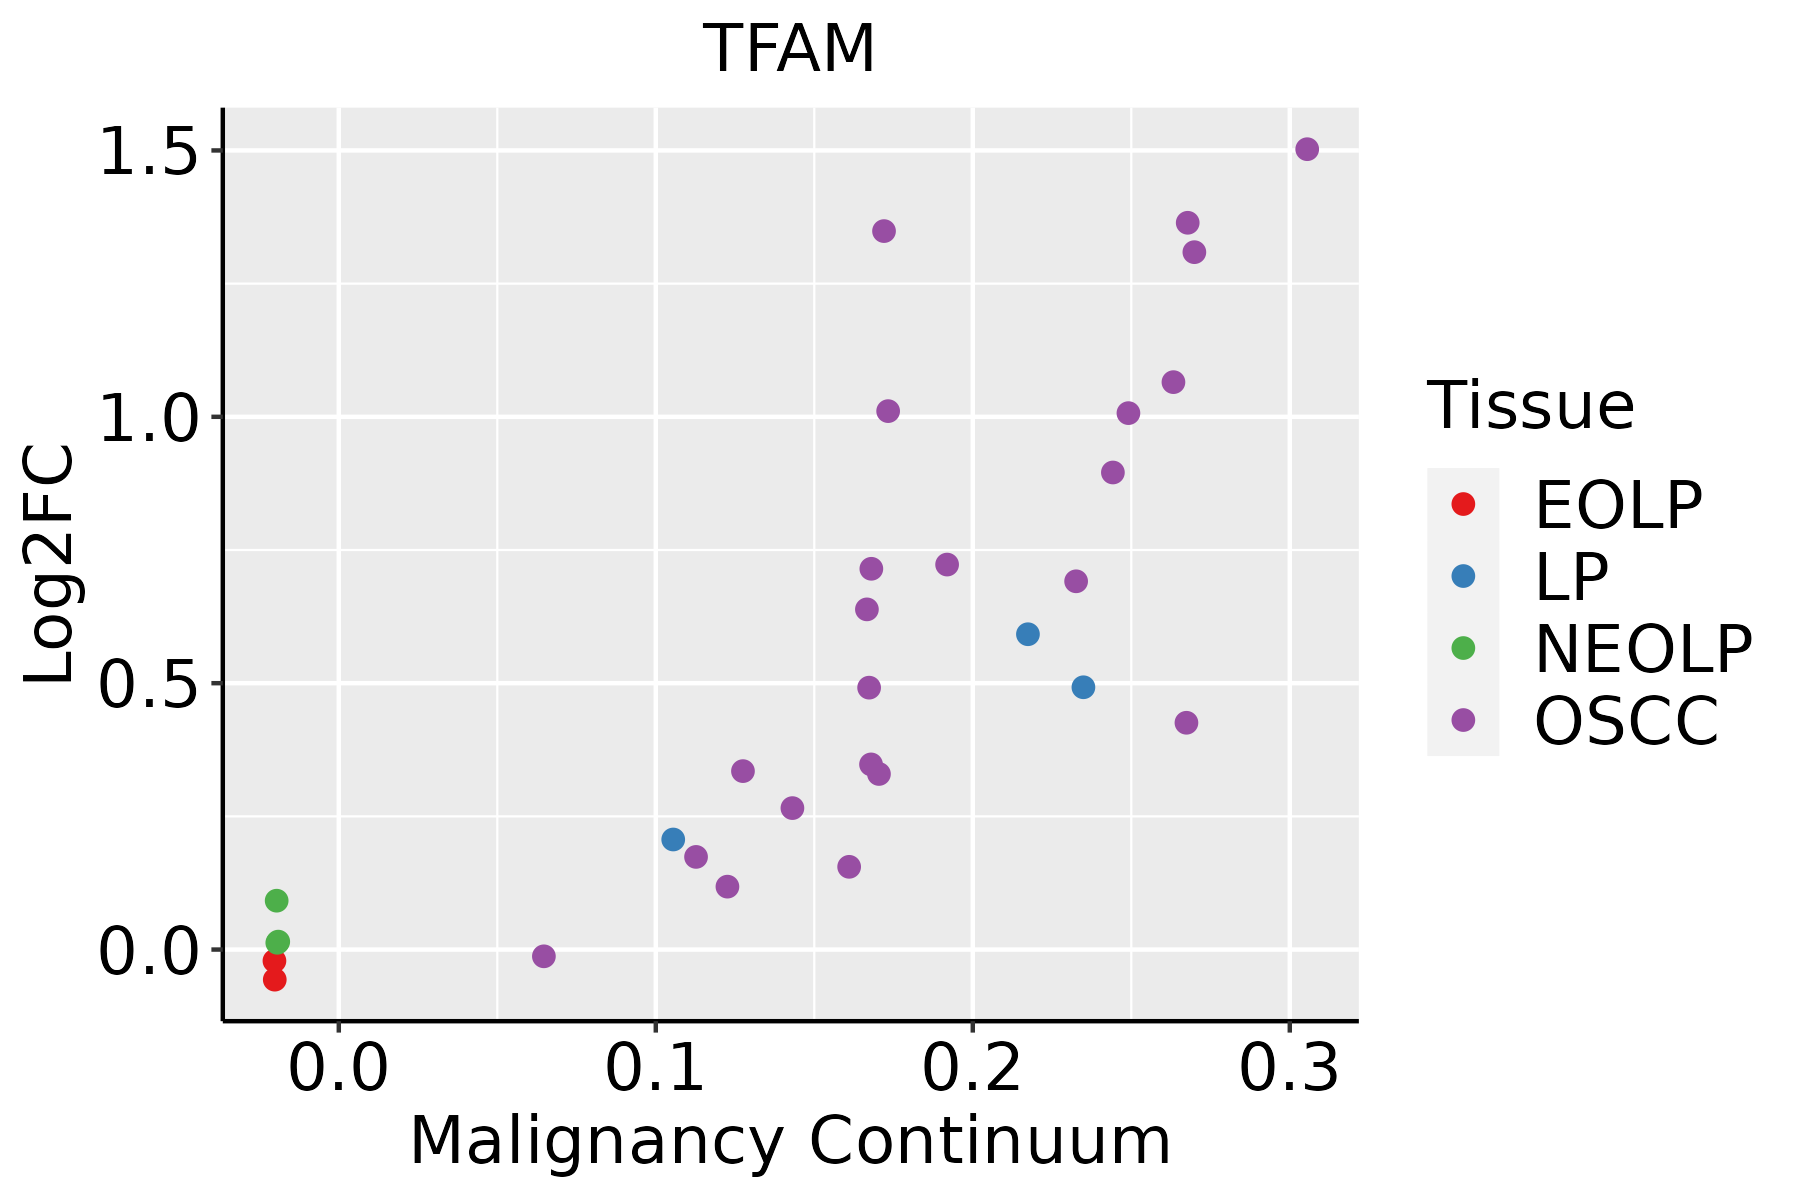 | EOLP: Erosive Oral lichen planus |
| LP: leukoplakia | ||
| NEOLP: Non-erosive oral lichen planus | ||
| OSCC: Oral squamous cell carcinoma | ||
| Prostate | 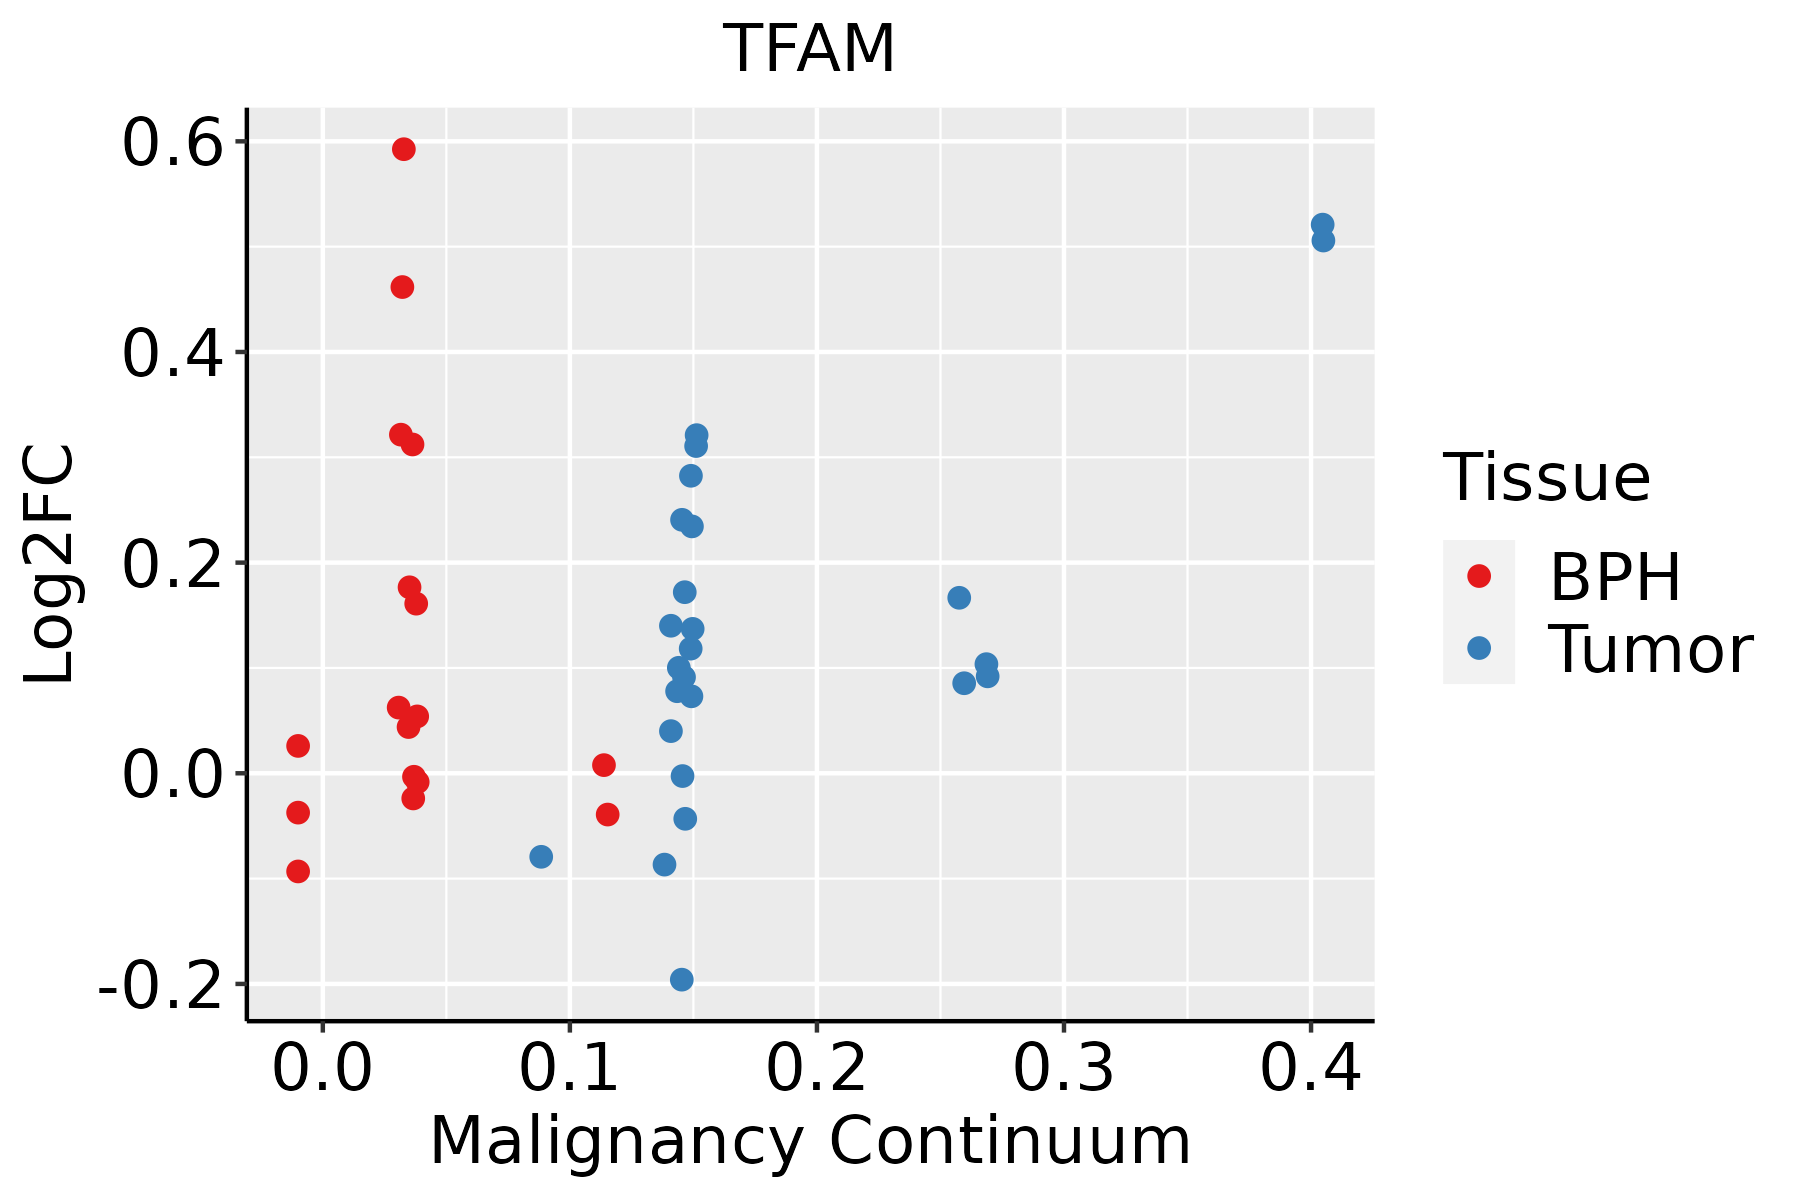 | BPH: Benign Prostatic Hyperplasia |
| Skin | 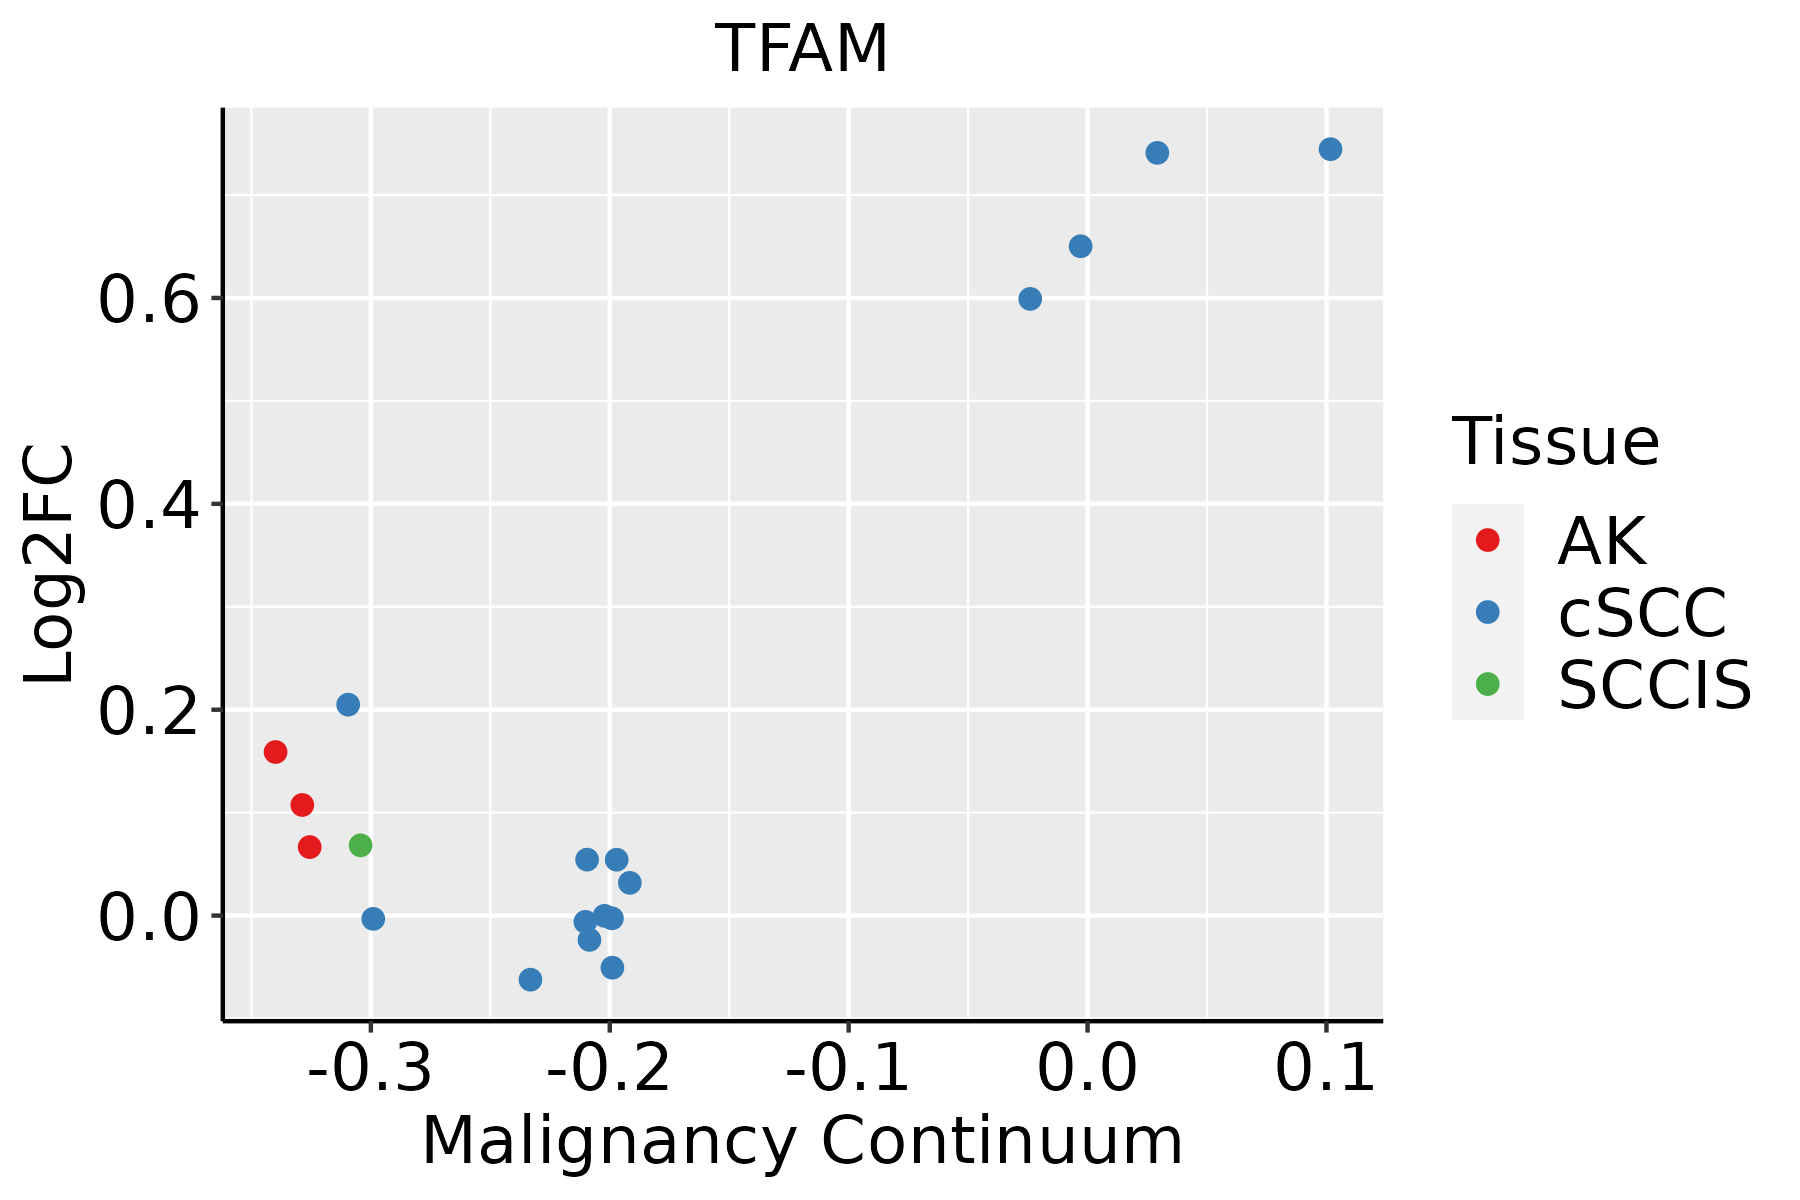 | AK: Actinic keratosis |
| cSCC: Cutaneous squamous cell carcinoma | ||
| SCCIS:squamous cell carcinoma in situ | ||
| Thyroid | 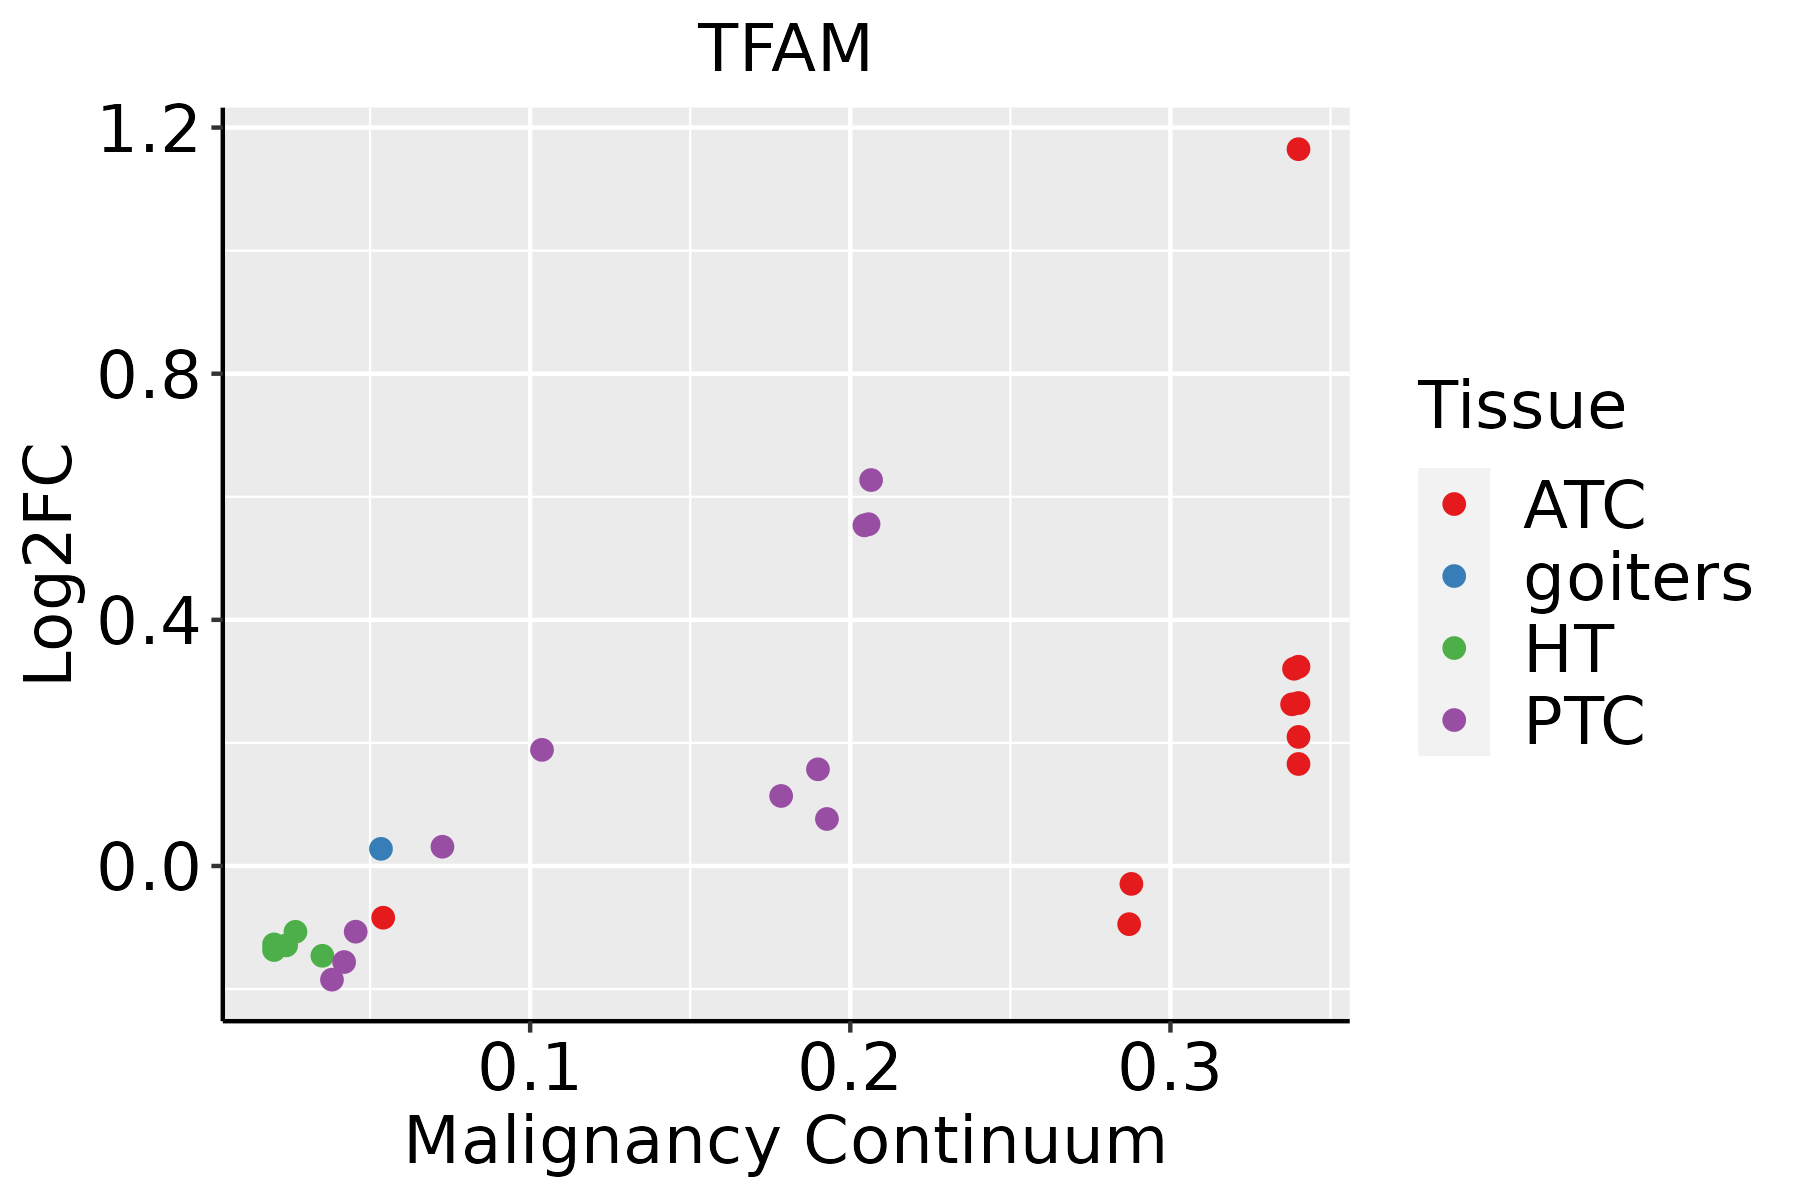 | ATC: Anaplastic thyroid cancer |
| HT: Hashimoto's thyroiditis | ||
| PTC: Papillary thyroid cancer |
| ∗log2FC in expression of this searched gene in stem-like cells from each diseased tissue sample relative to stem-like cells in normal samples in each tissue plotted against the malignancy continuum. Samples are colored based on if they are from different disease stage. |
Top |
Malignant transformation related pathway analysis |
| Find out the enriched GO biological processes and KEGG pathways involved in transition from healthy to precancer to cancer |
| Tissue | Disease Stage | Enriched GO biological Processes |
| Colorectum | AD |  |
| Colorectum | SER |  |
| Colorectum | MSS |  |
| Colorectum | MSI-H |  |
| Colorectum | FAP |  |
| ∗Top 15 enriched GO BP terms are showed in the bar plot of each disease state in each tissue. Each row represents a significant GO biological process which is colored according to the -log10(p.adjust). |
| Page: 1 2 3 4 5 6 7 8 9 |
| GO ID | Tissue | Disease Stage | Description | Gene Ratio | Bg Ratio | pvalue | p.adjust | Count |
| GO:0033108110 | Esophagus | ESCC | mitochondrial respiratory chain complex assembly | 83/8552 | 93/18723 | 9.56e-19 | 1.05e-16 | 83 |
| GO:014005313 | Esophagus | ESCC | mitochondrial gene expression | 93/8552 | 108/18723 | 1.96e-18 | 2.03e-16 | 93 |
| GO:00009592 | Esophagus | ESCC | mitochondrial RNA metabolic process | 39/8552 | 49/18723 | 1.20e-06 | 1.49e-05 | 39 |
| GO:000635211 | Esophagus | ESCC | DNA-templated transcription, initiation | 86/8552 | 130/18723 | 1.88e-06 | 2.19e-05 | 86 |
| GO:00331087 | Liver | Cirrhotic | mitochondrial respiratory chain complex assembly | 64/4634 | 93/18723 | 3.85e-19 | 7.79e-17 | 64 |
| GO:0140053 | Liver | Cirrhotic | mitochondrial gene expression | 49/4634 | 108/18723 | 2.35e-06 | 4.31e-05 | 49 |
| GO:003310812 | Liver | HCC | mitochondrial respiratory chain complex assembly | 80/7958 | 93/18723 | 3.47e-18 | 4.15e-16 | 80 |
| GO:01400531 | Liver | HCC | mitochondrial gene expression | 82/7958 | 108/18723 | 1.49e-12 | 7.20e-11 | 82 |
| GO:0006352 | Liver | HCC | DNA-templated transcription, initiation | 78/7958 | 130/18723 | 4.19e-05 | 4.11e-04 | 78 |
| GO:0000959 | Liver | HCC | mitochondrial RNA metabolic process | 30/7958 | 49/18723 | 6.31e-03 | 2.57e-02 | 30 |
| GO:003310818 | Oral cavity | OSCC | mitochondrial respiratory chain complex assembly | 75/7305 | 93/18723 | 2.17e-16 | 1.68e-14 | 75 |
| GO:01400533 | Oral cavity | OSCC | mitochondrial gene expression | 78/7305 | 108/18723 | 2.37e-12 | 9.86e-11 | 78 |
| GO:00063522 | Oral cavity | OSCC | DNA-templated transcription, initiation | 74/7305 | 130/18723 | 2.56e-05 | 2.39e-04 | 74 |
| GO:00009591 | Oral cavity | OSCC | mitochondrial RNA metabolic process | 29/7305 | 49/18723 | 3.33e-03 | 1.42e-02 | 29 |
| GO:003310816 | Prostate | BPH | mitochondrial respiratory chain complex assembly | 45/3107 | 93/18723 | 1.08e-12 | 9.32e-11 | 45 |
| GO:01400532 | Prostate | BPH | mitochondrial gene expression | 29/3107 | 108/18723 | 4.68e-03 | 2.25e-02 | 29 |
| GO:003310817 | Prostate | Tumor | mitochondrial respiratory chain complex assembly | 47/3246 | 93/18723 | 2.28e-13 | 2.49e-11 | 47 |
| GO:014005311 | Prostate | Tumor | mitochondrial gene expression | 31/3246 | 108/18723 | 2.31e-03 | 1.30e-02 | 31 |
| GO:003310824 | Skin | cSCC | mitochondrial respiratory chain complex assembly | 64/4864 | 93/18723 | 5.48e-18 | 6.58e-16 | 64 |
| GO:01400535 | Skin | cSCC | mitochondrial gene expression | 56/4864 | 108/18723 | 8.06e-09 | 2.56e-07 | 56 |
| Page: 1 2 |
| Pathway ID | Tissue | Disease Stage | Description | Gene Ratio | Bg Ratio | pvalue | p.adjust | qvalue | Count |
| hsa05016210 | Esophagus | ESCC | Huntington disease | 226/4205 | 306/8465 | 1.38e-18 | 8.72e-17 | 4.46e-17 | 226 |
| hsa0501638 | Esophagus | ESCC | Huntington disease | 226/4205 | 306/8465 | 1.38e-18 | 8.72e-17 | 4.46e-17 | 226 |
| hsa0501614 | Liver | Cirrhotic | Huntington disease | 172/2530 | 306/8465 | 1.65e-22 | 1.10e-20 | 6.77e-21 | 172 |
| hsa0501615 | Liver | Cirrhotic | Huntington disease | 172/2530 | 306/8465 | 1.65e-22 | 1.10e-20 | 6.77e-21 | 172 |
| hsa0501622 | Liver | HCC | Huntington disease | 219/4020 | 306/8465 | 3.06e-18 | 3.42e-16 | 1.90e-16 | 219 |
| hsa0501632 | Liver | HCC | Huntington disease | 219/4020 | 306/8465 | 3.06e-18 | 3.42e-16 | 1.90e-16 | 219 |
| hsa0501628 | Oral cavity | OSCC | Huntington disease | 204/3704 | 306/8465 | 1.70e-16 | 7.13e-15 | 3.63e-15 | 204 |
| hsa05016112 | Oral cavity | OSCC | Huntington disease | 204/3704 | 306/8465 | 1.70e-16 | 7.13e-15 | 3.63e-15 | 204 |
| hsa0501626 | Prostate | BPH | Huntington disease | 149/1718 | 306/8465 | 8.82e-30 | 7.27e-28 | 4.50e-28 | 149 |
| hsa05016111 | Prostate | BPH | Huntington disease | 149/1718 | 306/8465 | 8.82e-30 | 7.27e-28 | 4.50e-28 | 149 |
| hsa0501627 | Prostate | Tumor | Huntington disease | 150/1791 | 306/8465 | 2.72e-28 | 2.25e-26 | 1.40e-26 | 150 |
| hsa0501636 | Prostate | Tumor | Huntington disease | 150/1791 | 306/8465 | 2.72e-28 | 2.25e-26 | 1.40e-26 | 150 |
| Page: 1 |
Top |
Cell-cell communication analysis |
| Identification of potential cell-cell interactions between two cell types and their ligand-receptor pairs for different disease states |
| Ligand | Receptor | LRpair | Pathway | Tissue | Disease Stage |
| Page: 1 |
Top |
Single-cell gene regulatory network inference analysis |
| Find out the significant the regulons (TFs) and the target genes of each regulon across cell types for different disease states |
| TF | Cell Type | Tissue | Disease Stage | Target Gene | RSS | Regulon Activity |
| TFAM | MEN | Oral cavity | ADJ | LUC7L3,LYAR,SMC3, etc. | -2.22e-16 |  |
| TFAM | COR | Oral cavity | EOLP | LUC7L3,LYAR,SMC3, etc. | 0.00e+00 |  |
| TFAM | MEN | Oral cavity | OSCC | LUC7L3,LYAR,SMC3, etc. | 2.22e-16 |  |
| ∗The dot plots of a searched regulon are shown for all cell subpopulations in each disease state of each tissue based on the regulon specific score inferred using pySCENIC and by calculating the average expression. |
| Page: 1 |
Top |
Somatic mutation of malignant transformation related genes |
| Annotation of somatic variants for genes involved in malignant transformation |
| Hugo Symbol | Variant Class | Variant Classification | dbSNP RS | HGVSc | HGVSp | HGVSp Short | SWISSPROT | BIOTYPE | SIFT | PolyPhen | Tumor Sample Barcode | Tissue | Histology | Sex | Age | Stage | Therapy Types | Drugs | Outcome |
| TFAM | SNV | Missense_Mutation | c.658G>A | p.Glu220Lys | p.E220K | Q00059 | protein_coding | tolerated(0.06) | benign(0.242) | TCGA-A7-A0DB-01 | Breast | breast invasive carcinoma | Female | <65 | I/II | Hormone Therapy | arimidex | SD | |
| TFAM | SNV | Missense_Mutation | novel | c.732G>T | p.Glu244Asp | p.E244D | Q00059 | protein_coding | tolerated_low_confidence(0.11) | benign(0.107) | TCGA-2W-A8YY-01 | Cervix | cervical & endocervical cancer | Female | <65 | I/II | Chemotherapy | cisplatin | CR |
| TFAM | SNV | Missense_Mutation | novel | c.383N>T | p.Ser128Phe | p.S128F | Q00059 | protein_coding | deleterious(0.01) | possibly_damaging(0.875) | TCGA-C5-A2LY-01 | Cervix | cervical & endocervical cancer | Female | <65 | I/II | Chemotherapy | cisplatin | SD |
| TFAM | SNV | Missense_Mutation | novel | c.445T>A | p.Leu149Ile | p.L149I | Q00059 | protein_coding | deleterious(0) | possibly_damaging(0.808) | TCGA-EA-A410-01 | Cervix | cervical & endocervical cancer | Female | <65 | I/II | Unknown | Unknown | SD |
| TFAM | SNV | Missense_Mutation | c.337N>C | p.Glu113Gln | p.E113Q | Q00059 | protein_coding | tolerated(0.31) | benign(0.249) | TCGA-D5-6532-01 | Colorectum | colon adenocarcinoma | Male | <65 | I/II | Unknown | Unknown | SD | |
| TFAM | SNV | Missense_Mutation | c.25N>C | p.Gly9Arg | p.G9R | Q00059 | protein_coding | tolerated(0.08) | possibly_damaging(0.459) | TCGA-D5-6535-01 | Colorectum | colon adenocarcinoma | Female | >=65 | III/IV | Unknown | Unknown | SD | |
| TFAM | SNV | Missense_Mutation | novel | c.645N>T | p.Met215Ile | p.M215I | Q00059 | protein_coding | tolerated(0.56) | benign(0.013) | TCGA-EI-6917-01 | Colorectum | rectum adenocarcinoma | Male | <65 | III/IV | Chemotherapy | 5fluorouracil+oxaciplatina+l-folinian | SD |
| TFAM | SNV | Missense_Mutation | novel | c.626N>A | p.Thr209Asn | p.T209N | Q00059 | protein_coding | deleterious(0) | benign(0.062) | TCGA-A5-A0G2-01 | Endometrium | uterine corpus endometrioid carcinoma | Female | <65 | III/IV | Unknown | Unknown | SD |
| TFAM | SNV | Missense_Mutation | novel | c.253N>A | p.Ala85Thr | p.A85T | Q00059 | protein_coding | deleterious(0.03) | probably_damaging(0.969) | TCGA-A5-A1OF-01 | Endometrium | uterine corpus endometrioid carcinoma | Female | <65 | I/II | Unknown | Unknown | SD |
| TFAM | SNV | Missense_Mutation | novel | c.716N>A | p.Arg239Gln | p.R239Q | Q00059 | protein_coding | tolerated(0.61) | benign(0) | TCGA-AJ-A3EK-01 | Endometrium | uterine corpus endometrioid carcinoma | Female | <65 | I/II | Chemotherapy | carboplatin | CR |
| Page: 1 2 3 |
Top |
Related drugs of malignant transformation related genes |
| Identification of chemicals and drugs interact with genes involved in malignant transfromation |
| (DGIdb 4.0) |
| Entrez ID | Symbol | Category | Interaction Types | Drug Claim Name | Drug Name | PMIDs |
| Page: 1 |

Copyright 2023-Present -The University of Texas Health Science Center at Houston |