
|
|||||
|
 | |
| |
| |
| |
| |
| |
|
Gene: TEX264 |
Gene summary for TEX264 |
| Gene information | Species | Human | Gene symbol | TEX264 | Gene ID | 51368 |
| Gene name | testis expressed 264, ER-phagy receptor | |
| Gene Alias | ZSIG11 | |
| Cytomap | 3p21.2 | |
| Gene Type | protein-coding | GO ID | GO:0006139 | UniProtAcc | Q9Y6I9 |
Top |
Malignant transformation analysis |
| Identification of the aberrant gene expression in precancerous and cancerous lesions by comparing the gene expression of stem-like cells in diseased tissues with normal stem cells |
| Entrez ID | Symbol | Replicates | Species | Organ | Tissue | Adj P-value | Log2FC | Malignancy |
| 51368 | TEX264 | LZE2D | Human | Esophagus | HGIN | 1.04e-04 | 3.59e-01 | 0.0642 |
| 51368 | TEX264 | LZE2T | Human | Esophagus | ESCC | 1.17e-03 | 3.88e-01 | 0.082 |
| 51368 | TEX264 | LZE4T | Human | Esophagus | ESCC | 1.51e-09 | 2.00e-01 | 0.0811 |
| 51368 | TEX264 | LZE7T | Human | Esophagus | ESCC | 2.79e-04 | 2.73e-01 | 0.0667 |
| 51368 | TEX264 | LZE8T | Human | Esophagus | ESCC | 2.80e-03 | 2.31e-01 | 0.067 |
| 51368 | TEX264 | LZE20T | Human | Esophagus | ESCC | 9.84e-04 | 1.35e-01 | 0.0662 |
| 51368 | TEX264 | LZE22D1 | Human | Esophagus | HGIN | 3.64e-06 | 2.00e-01 | 0.0595 |
| 51368 | TEX264 | LZE22T | Human | Esophagus | ESCC | 1.19e-02 | 3.88e-01 | 0.068 |
| 51368 | TEX264 | LZE24T | Human | Esophagus | ESCC | 5.90e-26 | 7.16e-01 | 0.0596 |
| 51368 | TEX264 | LZE6T | Human | Esophagus | ESCC | 3.92e-07 | 2.71e-01 | 0.0845 |
| 51368 | TEX264 | P1T-E | Human | Esophagus | ESCC | 1.30e-07 | 5.16e-01 | 0.0875 |
| 51368 | TEX264 | P2T-E | Human | Esophagus | ESCC | 4.89e-23 | 3.80e-01 | 0.1177 |
| 51368 | TEX264 | P4T-E | Human | Esophagus | ESCC | 1.82e-28 | 8.20e-01 | 0.1323 |
| 51368 | TEX264 | P5T-E | Human | Esophagus | ESCC | 5.89e-20 | 3.51e-01 | 0.1327 |
| 51368 | TEX264 | P8T-E | Human | Esophagus | ESCC | 2.67e-22 | 3.97e-01 | 0.0889 |
| 51368 | TEX264 | P9T-E | Human | Esophagus | ESCC | 5.29e-19 | 6.39e-01 | 0.1131 |
| 51368 | TEX264 | P10T-E | Human | Esophagus | ESCC | 3.57e-53 | 1.07e+00 | 0.116 |
| 51368 | TEX264 | P11T-E | Human | Esophagus | ESCC | 2.00e-19 | 6.81e-01 | 0.1426 |
| 51368 | TEX264 | P12T-E | Human | Esophagus | ESCC | 2.26e-47 | 8.53e-01 | 0.1122 |
| 51368 | TEX264 | P15T-E | Human | Esophagus | ESCC | 9.03e-28 | 5.24e-01 | 0.1149 |
| Page: 1 2 3 4 5 6 7 |
| Tissue | Expression Dynamics | Abbreviation |
| Esophagus | 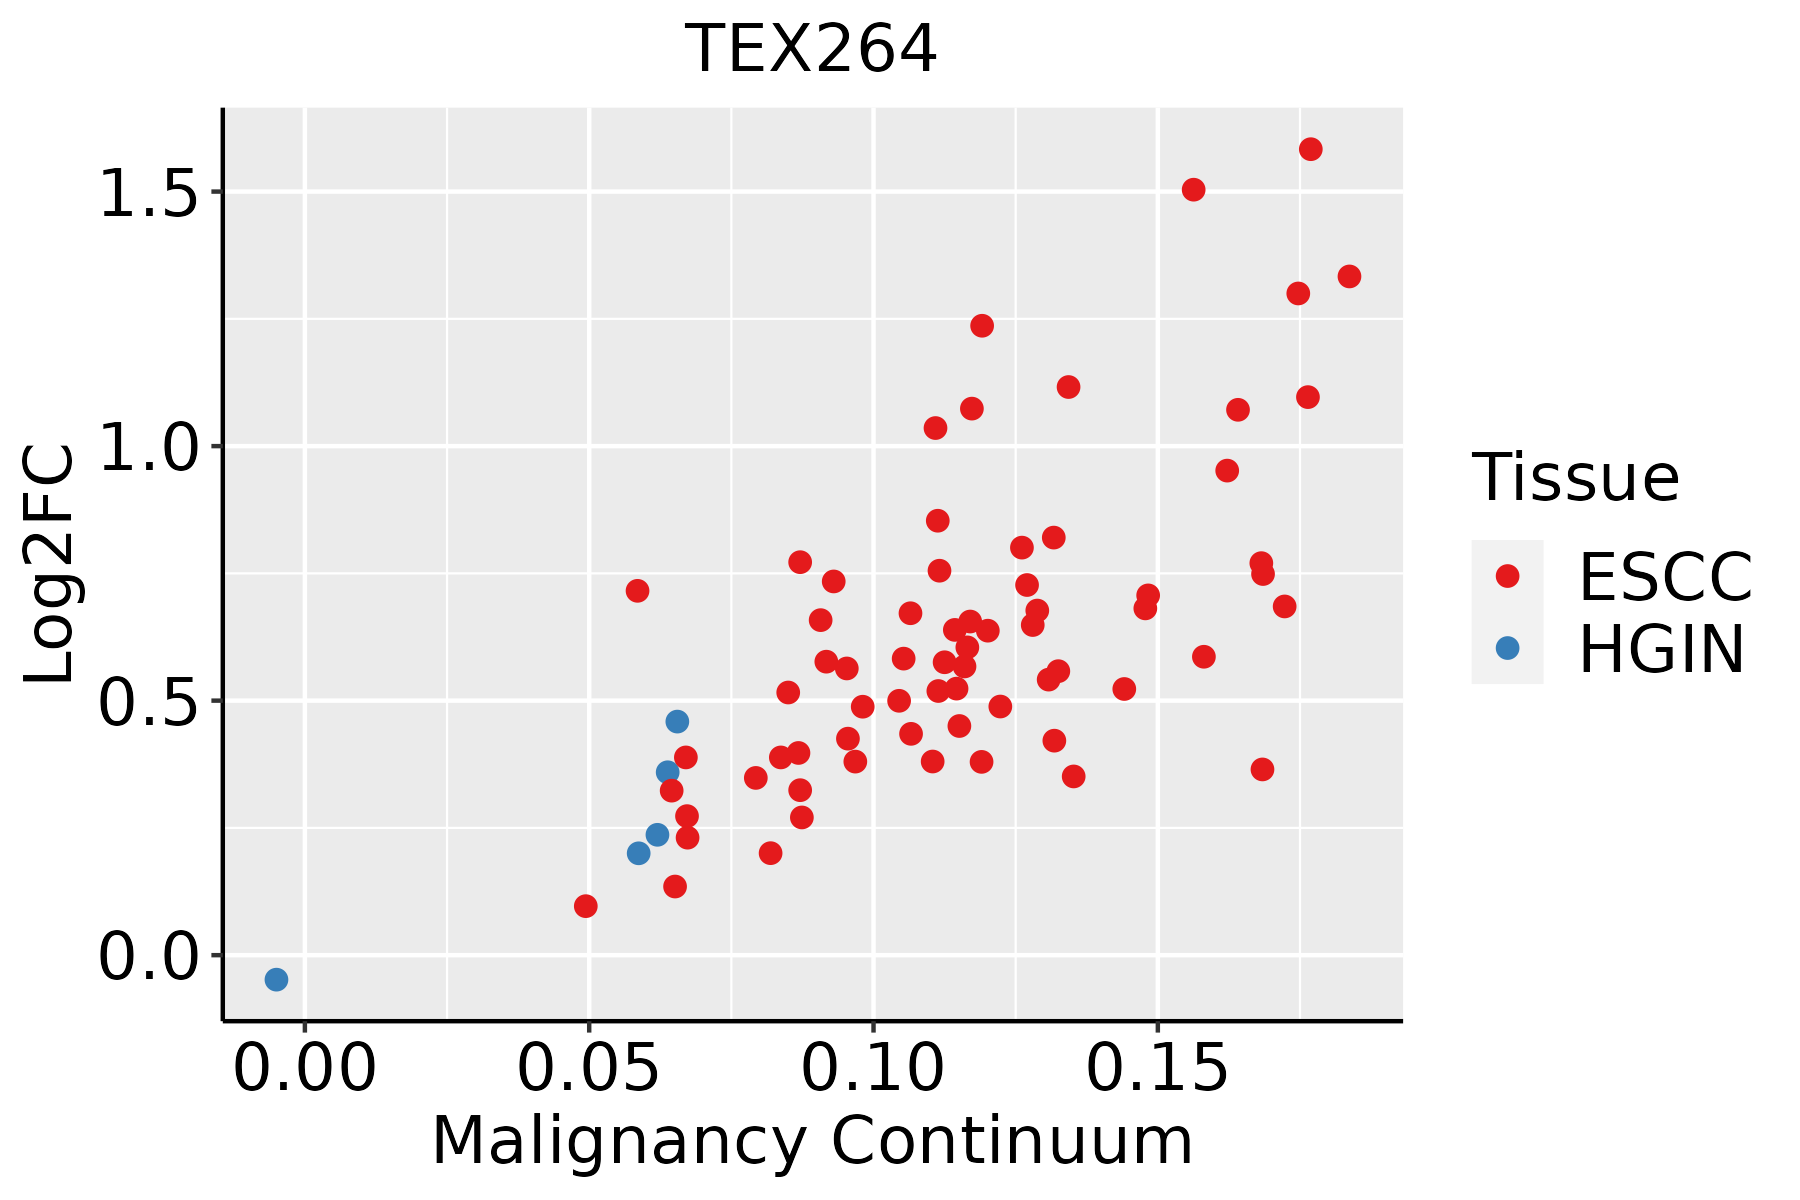 | ESCC: Esophageal squamous cell carcinoma |
| HGIN: High-grade intraepithelial neoplasias | ||
| LGIN: Low-grade intraepithelial neoplasias | ||
| Liver |  | HCC: Hepatocellular carcinoma |
| NAFLD: Non-alcoholic fatty liver disease | ||
| Oral Cavity | 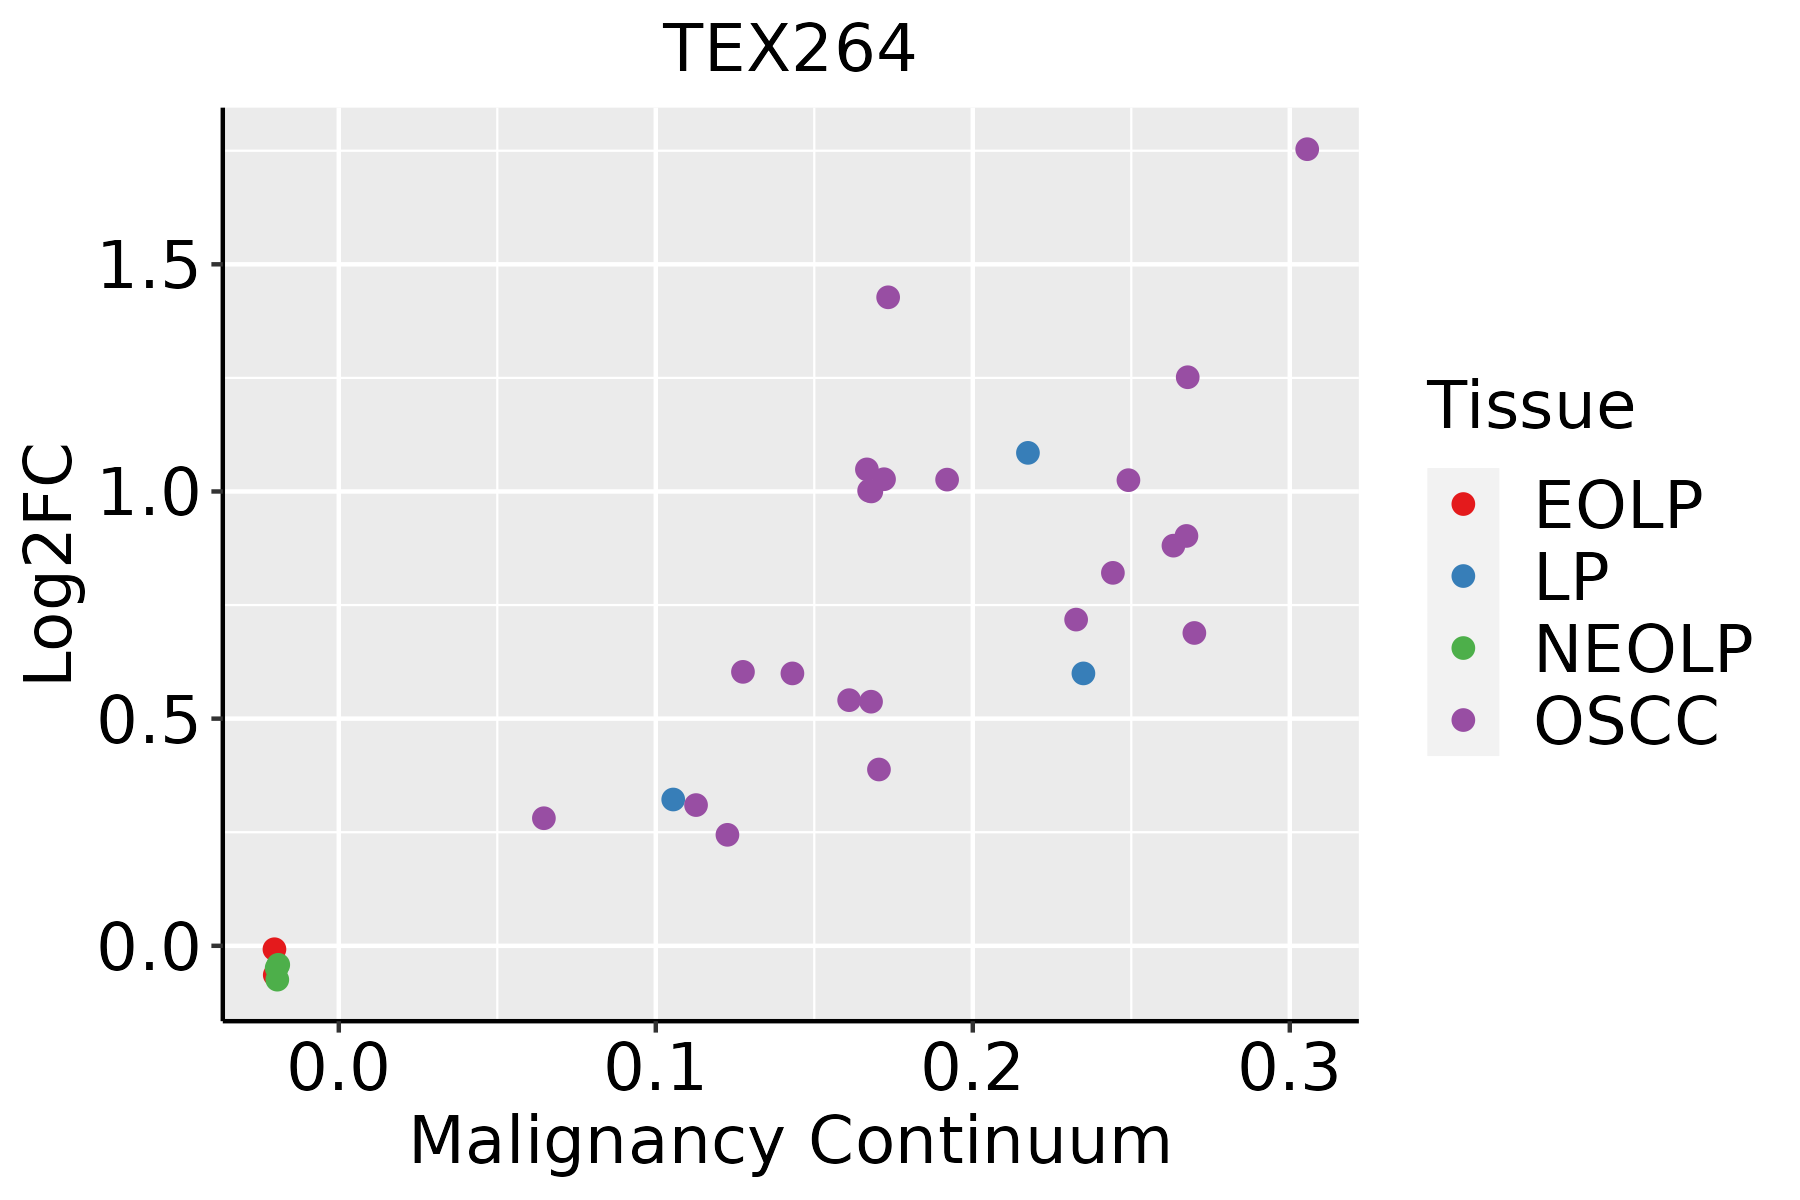 | EOLP: Erosive Oral lichen planus |
| LP: leukoplakia | ||
| NEOLP: Non-erosive oral lichen planus | ||
| OSCC: Oral squamous cell carcinoma | ||
| Prostate | 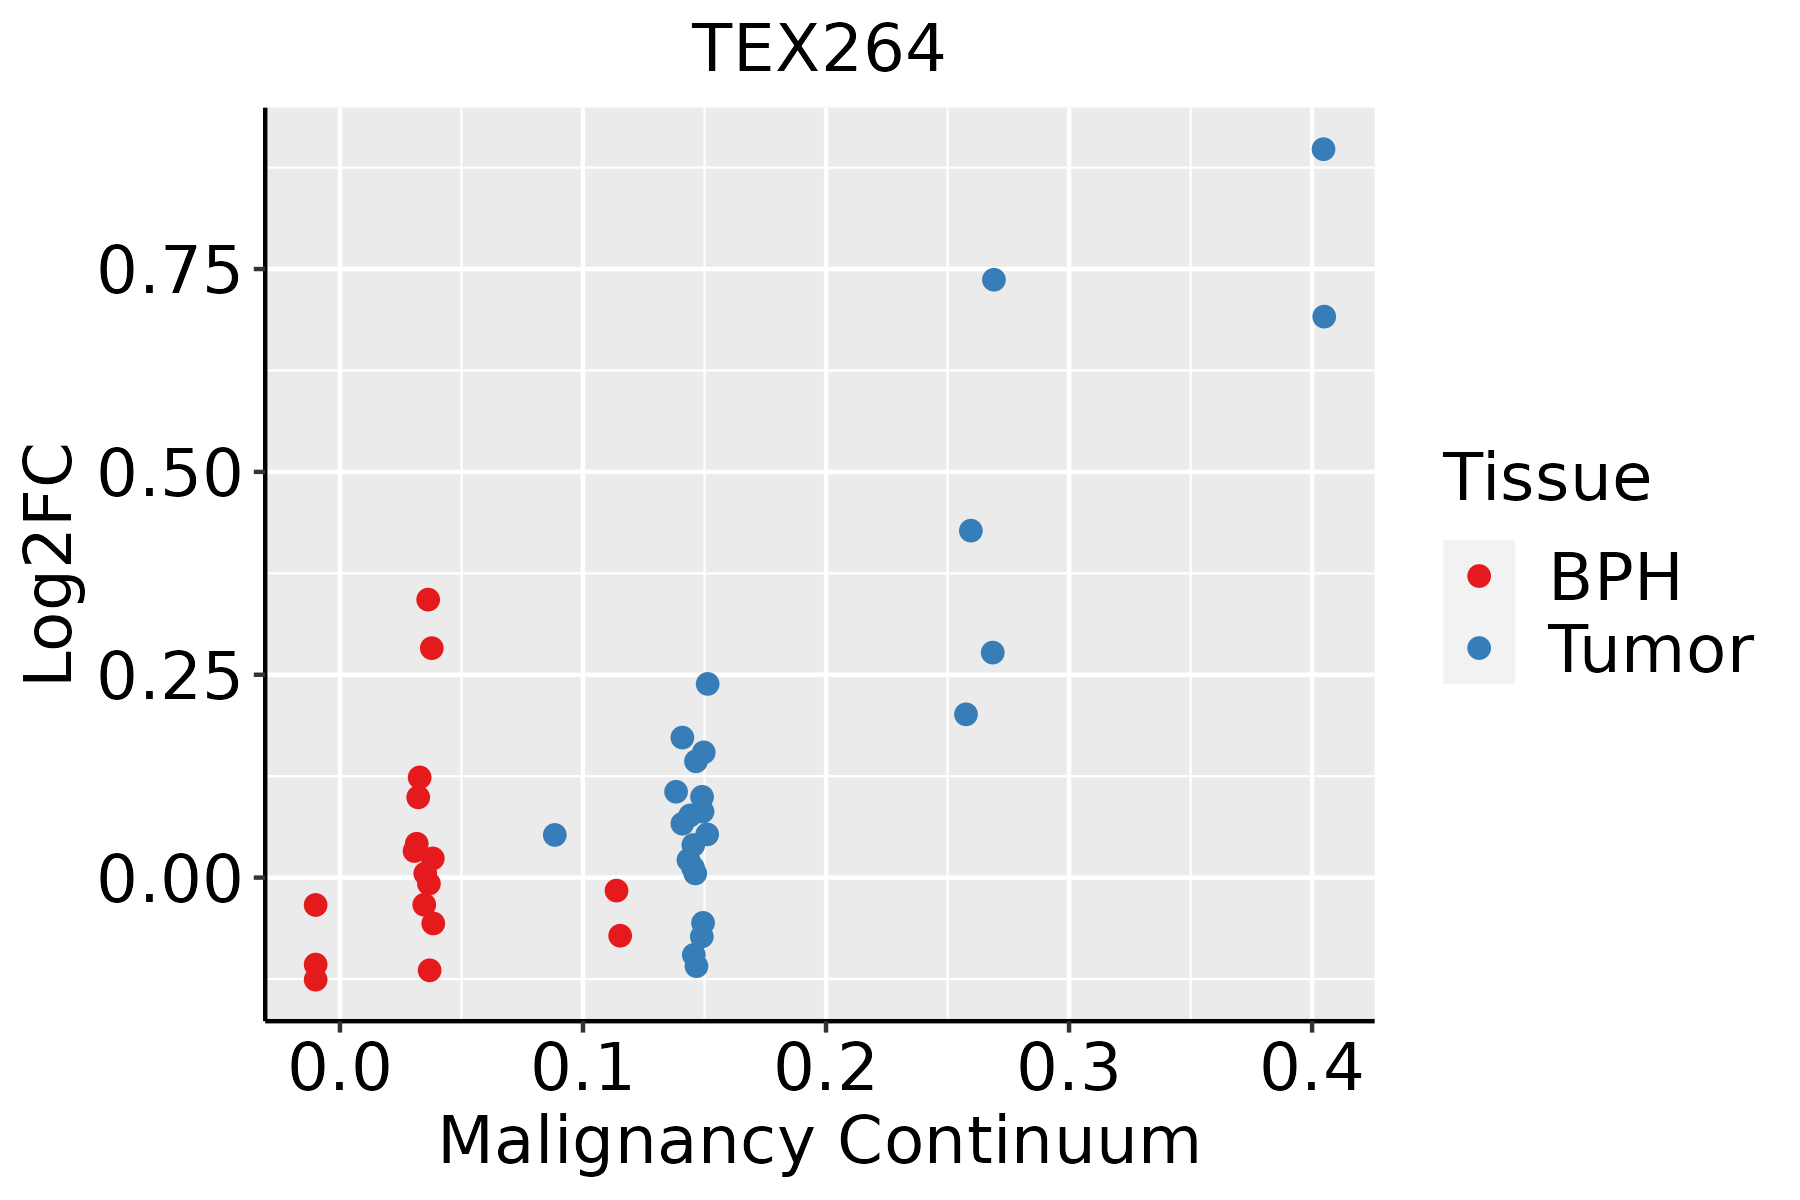 | BPH: Benign Prostatic Hyperplasia |
| Skin | 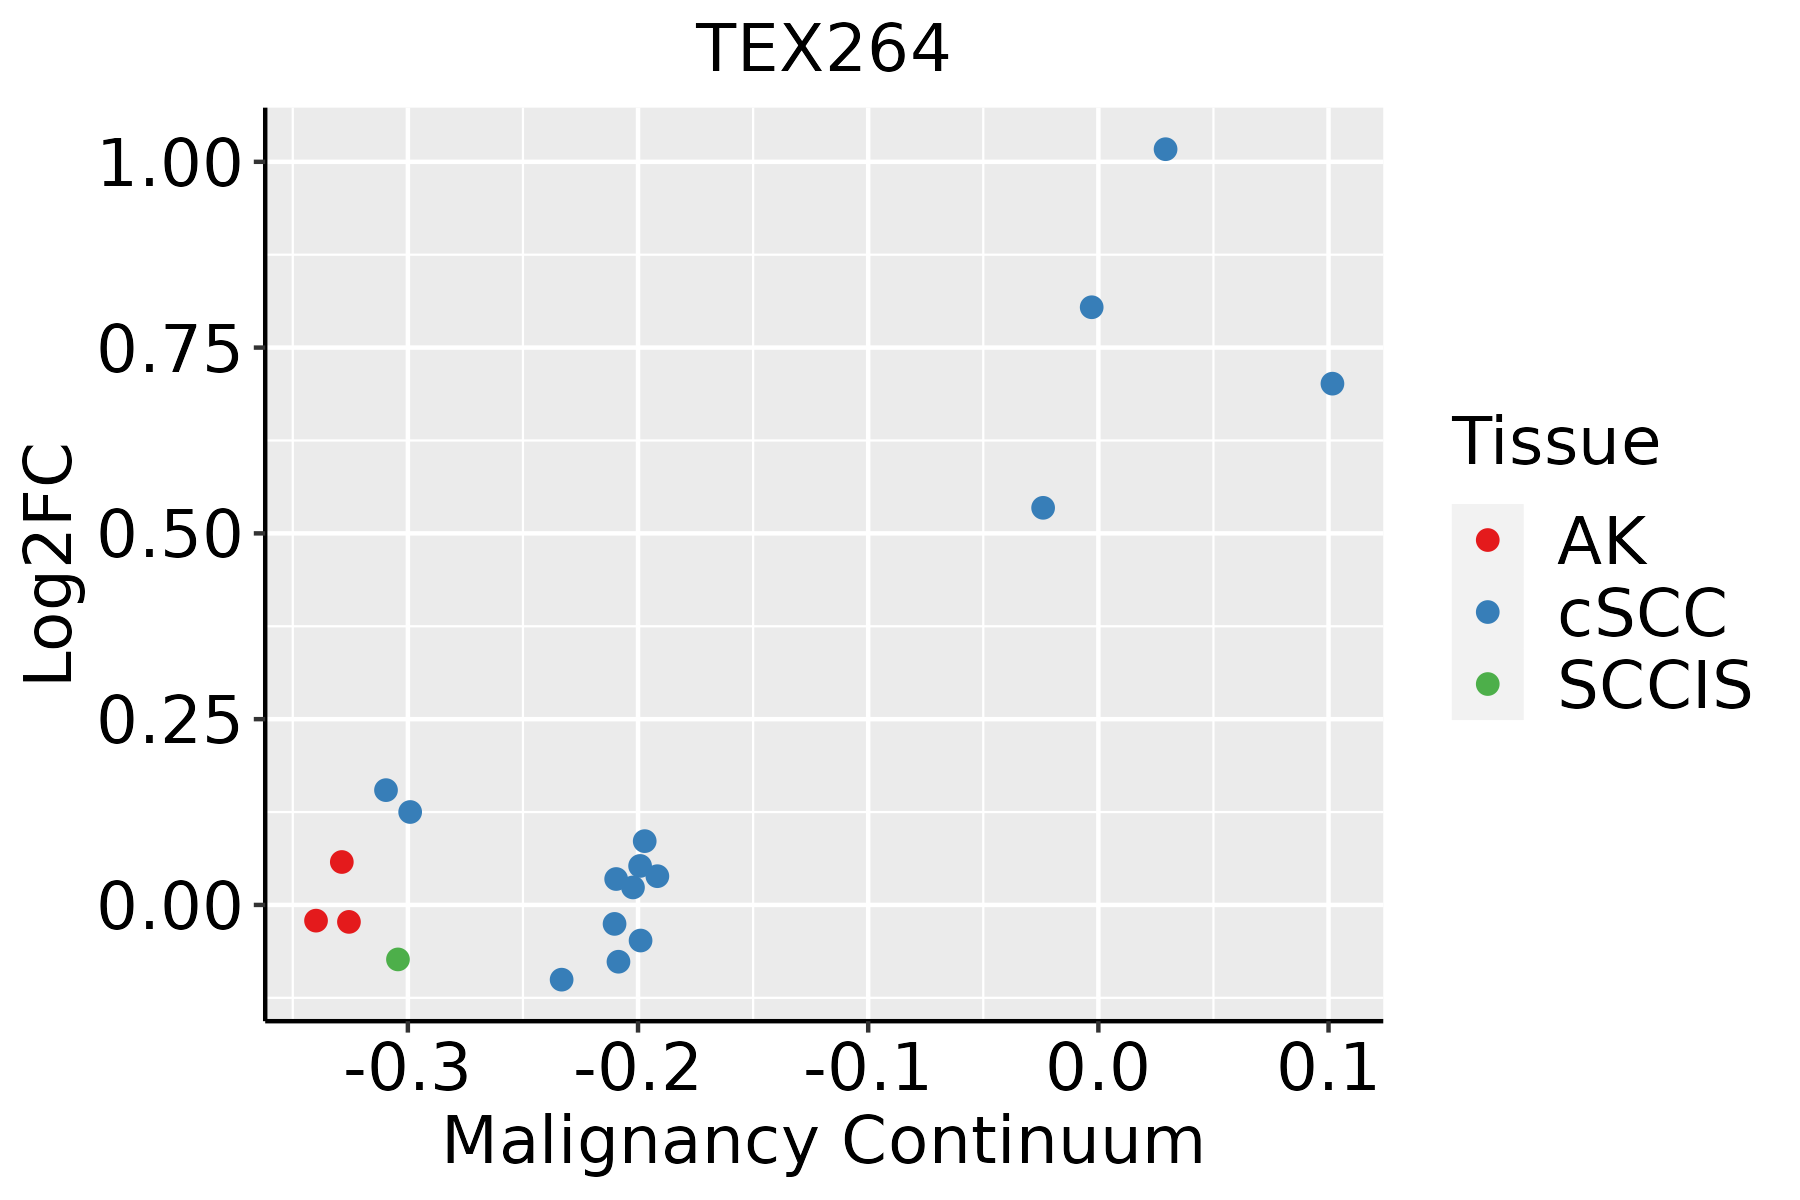 | AK: Actinic keratosis |
| cSCC: Cutaneous squamous cell carcinoma | ||
| SCCIS:squamous cell carcinoma in situ | ||
| Thyroid |  | ATC: Anaplastic thyroid cancer |
| HT: Hashimoto's thyroiditis | ||
| PTC: Papillary thyroid cancer |
| ∗log2FC in expression of this searched gene in stem-like cells from each diseased tissue sample relative to stem-like cells in normal samples in each tissue plotted against the malignancy continuum. Samples are colored based on if they are from different disease stage. |
Top |
Malignant transformation related pathway analysis |
| Find out the enriched GO biological processes and KEGG pathways involved in transition from healthy to precancer to cancer |
| Tissue | Disease Stage | Enriched GO biological Processes |
| Colorectum | AD |  |
| Colorectum | SER |  |
| Colorectum | MSS |  |
| Colorectum | MSI-H |  |
| Colorectum | FAP |  |
| ∗Top 15 enriched GO BP terms are showed in the bar plot of each disease state in each tissue. Each row represents a significant GO biological process which is colored according to the -log10(p.adjust). |
| Page: 1 2 3 4 5 6 7 8 9 |
| GO ID | Tissue | Disease Stage | Description | Gene Ratio | Bg Ratio | pvalue | p.adjust | Count |
| GO:001623616 | Esophagus | HGIN | macroautophagy | 77/2587 | 291/18723 | 7.15e-09 | 4.61e-07 | 77 |
| GO:002241120 | Esophagus | HGIN | cellular component disassembly | 102/2587 | 443/18723 | 8.31e-08 | 4.33e-06 | 102 |
| GO:19030089 | Esophagus | HGIN | organelle disassembly | 36/2587 | 114/18723 | 8.60e-07 | 3.58e-05 | 36 |
| GO:00619128 | Esophagus | HGIN | selective autophagy | 19/2587 | 68/18723 | 1.68e-03 | 1.85e-02 | 19 |
| GO:001623617 | Esophagus | ESCC | macroautophagy | 216/8552 | 291/18723 | 1.94e-23 | 4.57e-21 | 216 |
| GO:0022411111 | Esophagus | ESCC | cellular component disassembly | 305/8552 | 443/18723 | 1.94e-23 | 4.57e-21 | 305 |
| GO:190300816 | Esophagus | ESCC | organelle disassembly | 89/8552 | 114/18723 | 1.36e-12 | 5.80e-11 | 89 |
| GO:006191215 | Esophagus | ESCC | selective autophagy | 47/8552 | 68/18723 | 7.81e-05 | 5.80e-04 | 47 |
| GO:00224117 | Liver | Cirrhotic | cellular component disassembly | 182/4634 | 443/18723 | 1.59e-14 | 1.54e-12 | 182 |
| GO:001623611 | Liver | Cirrhotic | macroautophagy | 129/4634 | 291/18723 | 1.75e-13 | 1.41e-11 | 129 |
| GO:19030084 | Liver | Cirrhotic | organelle disassembly | 59/4634 | 114/18723 | 4.82e-10 | 2.27e-08 | 59 |
| GO:00619124 | Liver | Cirrhotic | selective autophagy | 30/4634 | 68/18723 | 3.72e-04 | 3.12e-03 | 30 |
| GO:001623621 | Liver | HCC | macroautophagy | 204/7958 | 291/18723 | 8.66e-22 | 1.41e-19 | 204 |
| GO:002241112 | Liver | HCC | cellular component disassembly | 282/7958 | 443/18723 | 1.02e-19 | 1.38e-17 | 282 |
| GO:190300811 | Liver | HCC | organelle disassembly | 89/7958 | 114/18723 | 8.68e-15 | 5.73e-13 | 89 |
| GO:006191211 | Liver | HCC | selective autophagy | 49/7958 | 68/18723 | 7.43e-07 | 1.15e-05 | 49 |
| GO:002241119 | Oral cavity | OSCC | cellular component disassembly | 283/7305 | 443/18723 | 9.57e-27 | 3.37e-24 | 283 |
| GO:001623610 | Oral cavity | OSCC | macroautophagy | 192/7305 | 291/18723 | 7.01e-21 | 1.14e-18 | 192 |
| GO:19030088 | Oral cavity | OSCC | organelle disassembly | 85/7305 | 114/18723 | 1.15e-14 | 6.93e-13 | 85 |
| GO:00619127 | Oral cavity | OSCC | selective autophagy | 44/7305 | 68/18723 | 1.57e-05 | 1.57e-04 | 44 |
| Page: 1 2 3 |
| Pathway ID | Tissue | Disease Stage | Description | Gene Ratio | Bg Ratio | pvalue | p.adjust | qvalue | Count |
| Page: 1 |
Top |
Cell-cell communication analysis |
| Identification of potential cell-cell interactions between two cell types and their ligand-receptor pairs for different disease states |
| Ligand | Receptor | LRpair | Pathway | Tissue | Disease Stage |
| Page: 1 |
Top |
Single-cell gene regulatory network inference analysis |
| Find out the significant the regulons (TFs) and the target genes of each regulon across cell types for different disease states |
| TF | Cell Type | Tissue | Disease Stage | Target Gene | RSS | Regulon Activity |
| ∗The dot plots of a searched regulon are shown for all cell subpopulations in each disease state of each tissue based on the regulon specific score inferred using pySCENIC and by calculating the average expression. |
| Page: 1 |
Top |
Somatic mutation of malignant transformation related genes |
| Annotation of somatic variants for genes involved in malignant transformation |
| Hugo Symbol | Variant Class | Variant Classification | dbSNP RS | HGVSc | HGVSp | HGVSp Short | SWISSPROT | BIOTYPE | SIFT | PolyPhen | Tumor Sample Barcode | Tissue | Histology | Sex | Age | Stage | Therapy Types | Drugs | Outcome |
| TEX264 | SNV | Missense_Mutation | c.312N>T | p.Glu104Asp | p.E104D | Q9Y6I9 | protein_coding | tolerated(0.28) | benign(0.019) | TCGA-A2-A25A-01 | Breast | breast invasive carcinoma | Female | <65 | I/II | Unspecific | Cytoxan | SD | |
| TEX264 | SNV | Missense_Mutation | novel | c.608N>T | p.Arg203Leu | p.R203L | Q9Y6I9 | protein_coding | deleterious(0.02) | benign(0) | TCGA-A7-A0DB-01 | Breast | breast invasive carcinoma | Female | <65 | I/II | Hormone Therapy | arimidex | SD |
| TEX264 | SNV | Missense_Mutation | c.719N>T | p.Ala240Val | p.A240V | Q9Y6I9 | protein_coding | tolerated(0.76) | benign(0.001) | TCGA-A8-A07U-01 | Breast | breast invasive carcinoma | Female | >=65 | III/IV | Chemotherapy | 5-fluorouracil | SD | |
| TEX264 | insertion | Frame_Shift_Ins | novel | c.699_700insACCCAGGGGTTGCTCCTGGACA | p.Gly234ThrfsTer28 | p.G234Tfs*28 | Q9Y6I9 | protein_coding | TCGA-BH-A0B8-01 | Breast | breast invasive carcinoma | Female | <65 | I/II | Hormone Therapy | arimidex | SD | ||
| TEX264 | SNV | Missense_Mutation | novel | c.236T>C | p.Val79Ala | p.V79A | Q9Y6I9 | protein_coding | deleterious(0.01) | possibly_damaging(0.487) | TCGA-2W-A8YY-01 | Cervix | cervical & endocervical cancer | Female | <65 | I/II | Chemotherapy | cisplatin | CR |
| TEX264 | SNV | Missense_Mutation | rs751516569 | c.76N>A | p.Gly26Arg | p.G26R | Q9Y6I9 | protein_coding | tolerated(0.35) | benign(0.003) | TCGA-EA-A410-01 | Cervix | cervical & endocervical cancer | Female | <65 | I/II | Unknown | Unknown | SD |
| TEX264 | SNV | Missense_Mutation | c.925N>A | p.Glu309Lys | p.E309K | Q9Y6I9 | protein_coding | deleterious_low_confidence(0) | probably_damaging(0.971) | TCGA-Q1-A5R2-01 | Cervix | cervical & endocervical cancer | Female | <65 | I/II | Chemotherapy | cisplatin | PR | |
| TEX264 | SNV | Missense_Mutation | novel | c.565G>C | p.Asp189His | p.D189H | Q9Y6I9 | protein_coding | deleterious(0.02) | benign(0.199) | TCGA-Q1-A73O-01 | Cervix | cervical & endocervical cancer | Female | <65 | I/II | Chemotherapy | cisplatin | CR |
| TEX264 | SNV | Missense_Mutation | novel | c.137T>C | p.Val46Ala | p.V46A | Q9Y6I9 | protein_coding | deleterious(0) | benign(0.06) | TCGA-AA-A029-01 | Colorectum | colon adenocarcinoma | Male | >=65 | I/II | Unknown | Unknown | SD |
| TEX264 | SNV | Missense_Mutation | c.763N>A | p.Gly255Ser | p.G255S | Q9Y6I9 | protein_coding | tolerated(0.45) | benign(0.006) | TCGA-CM-6171-01 | Colorectum | colon adenocarcinoma | Female | >=65 | I/II | Unknown | Unknown | SD |
| Page: 1 2 3 4 |
Top |
Related drugs of malignant transformation related genes |
| Identification of chemicals and drugs interact with genes involved in malignant transfromation |
| (DGIdb 4.0) |
| Entrez ID | Symbol | Category | Interaction Types | Drug Claim Name | Drug Name | PMIDs |
| Page: 1 |

Copyright 2023-Present -The University of Texas Health Science Center at Houston |