
|
|||||
|
 | |
| |
| |
| |
| |
| |
|
Gene: TEX261 |
Gene summary for TEX261 |
| Gene information | Species | Human | Gene symbol | TEX261 | Gene ID | 113419 |
| Gene name | testis expressed 261 | |
| Gene Alias | TEG-261 | |
| Cytomap | 2p13.3 | |
| Gene Type | protein-coding | GO ID | GO:0006810 | UniProtAcc | Q6UWH6 |
Top |
Malignant transformation analysis |
| Identification of the aberrant gene expression in precancerous and cancerous lesions by comparing the gene expression of stem-like cells in diseased tissues with normal stem cells |
| Entrez ID | Symbol | Replicates | Species | Organ | Tissue | Adj P-value | Log2FC | Malignancy |
| 113419 | TEX261 | HTA11_3410_2000001011 | Human | Colorectum | AD | 1.41e-07 | 1.79e-01 | 0.0155 |
| 113419 | TEX261 | HTA11_2487_2000001011 | Human | Colorectum | SER | 4.32e-13 | 3.64e-01 | -0.1808 |
| 113419 | TEX261 | HTA11_1938_2000001011 | Human | Colorectum | AD | 3.41e-16 | 3.82e-01 | -0.0811 |
| 113419 | TEX261 | HTA11_78_2000001011 | Human | Colorectum | AD | 8.38e-10 | 3.12e-01 | -0.1088 |
| 113419 | TEX261 | HTA11_347_2000001011 | Human | Colorectum | AD | 5.91e-20 | 3.76e-01 | -0.1954 |
| 113419 | TEX261 | HTA11_411_2000001011 | Human | Colorectum | SER | 1.20e-07 | 5.05e-01 | -0.2602 |
| 113419 | TEX261 | HTA11_2112_2000001011 | Human | Colorectum | SER | 1.90e-02 | 3.07e-01 | -0.2196 |
| 113419 | TEX261 | HTA11_3361_2000001011 | Human | Colorectum | AD | 3.26e-04 | 2.13e-01 | -0.1207 |
| 113419 | TEX261 | HTA11_83_2000001011 | Human | Colorectum | SER | 2.92e-07 | 3.59e-01 | -0.1526 |
| 113419 | TEX261 | HTA11_696_2000001011 | Human | Colorectum | AD | 1.73e-12 | 2.83e-01 | -0.1464 |
| 113419 | TEX261 | HTA11_866_2000001011 | Human | Colorectum | AD | 2.07e-08 | 1.81e-01 | -0.1001 |
| 113419 | TEX261 | HTA11_1391_2000001011 | Human | Colorectum | AD | 6.55e-21 | 4.63e-01 | -0.059 |
| 113419 | TEX261 | HTA11_2992_2000001011 | Human | Colorectum | SER | 1.72e-05 | 3.10e-01 | -0.1706 |
| 113419 | TEX261 | HTA11_5212_2000001011 | Human | Colorectum | AD | 1.21e-08 | 3.63e-01 | -0.2061 |
| 113419 | TEX261 | HTA11_5216_2000001011 | Human | Colorectum | SER | 3.34e-04 | 3.63e-01 | -0.1462 |
| 113419 | TEX261 | HTA11_546_2000001011 | Human | Colorectum | AD | 8.36e-09 | 3.04e-01 | -0.0842 |
| 113419 | TEX261 | HTA11_7862_2000001011 | Human | Colorectum | AD | 1.12e-06 | 3.55e-01 | -0.0179 |
| 113419 | TEX261 | HTA11_866_3004761011 | Human | Colorectum | AD | 4.76e-13 | 2.93e-01 | 0.096 |
| 113419 | TEX261 | HTA11_8622_2000001021 | Human | Colorectum | SER | 6.14e-04 | 3.07e-01 | 0.0528 |
| 113419 | TEX261 | HTA11_10623_2000001011 | Human | Colorectum | AD | 4.46e-06 | 2.81e-01 | -0.0177 |
| Page: 1 2 3 4 5 6 |
| Tissue | Expression Dynamics | Abbreviation |
| Colorectum (GSE201348) | 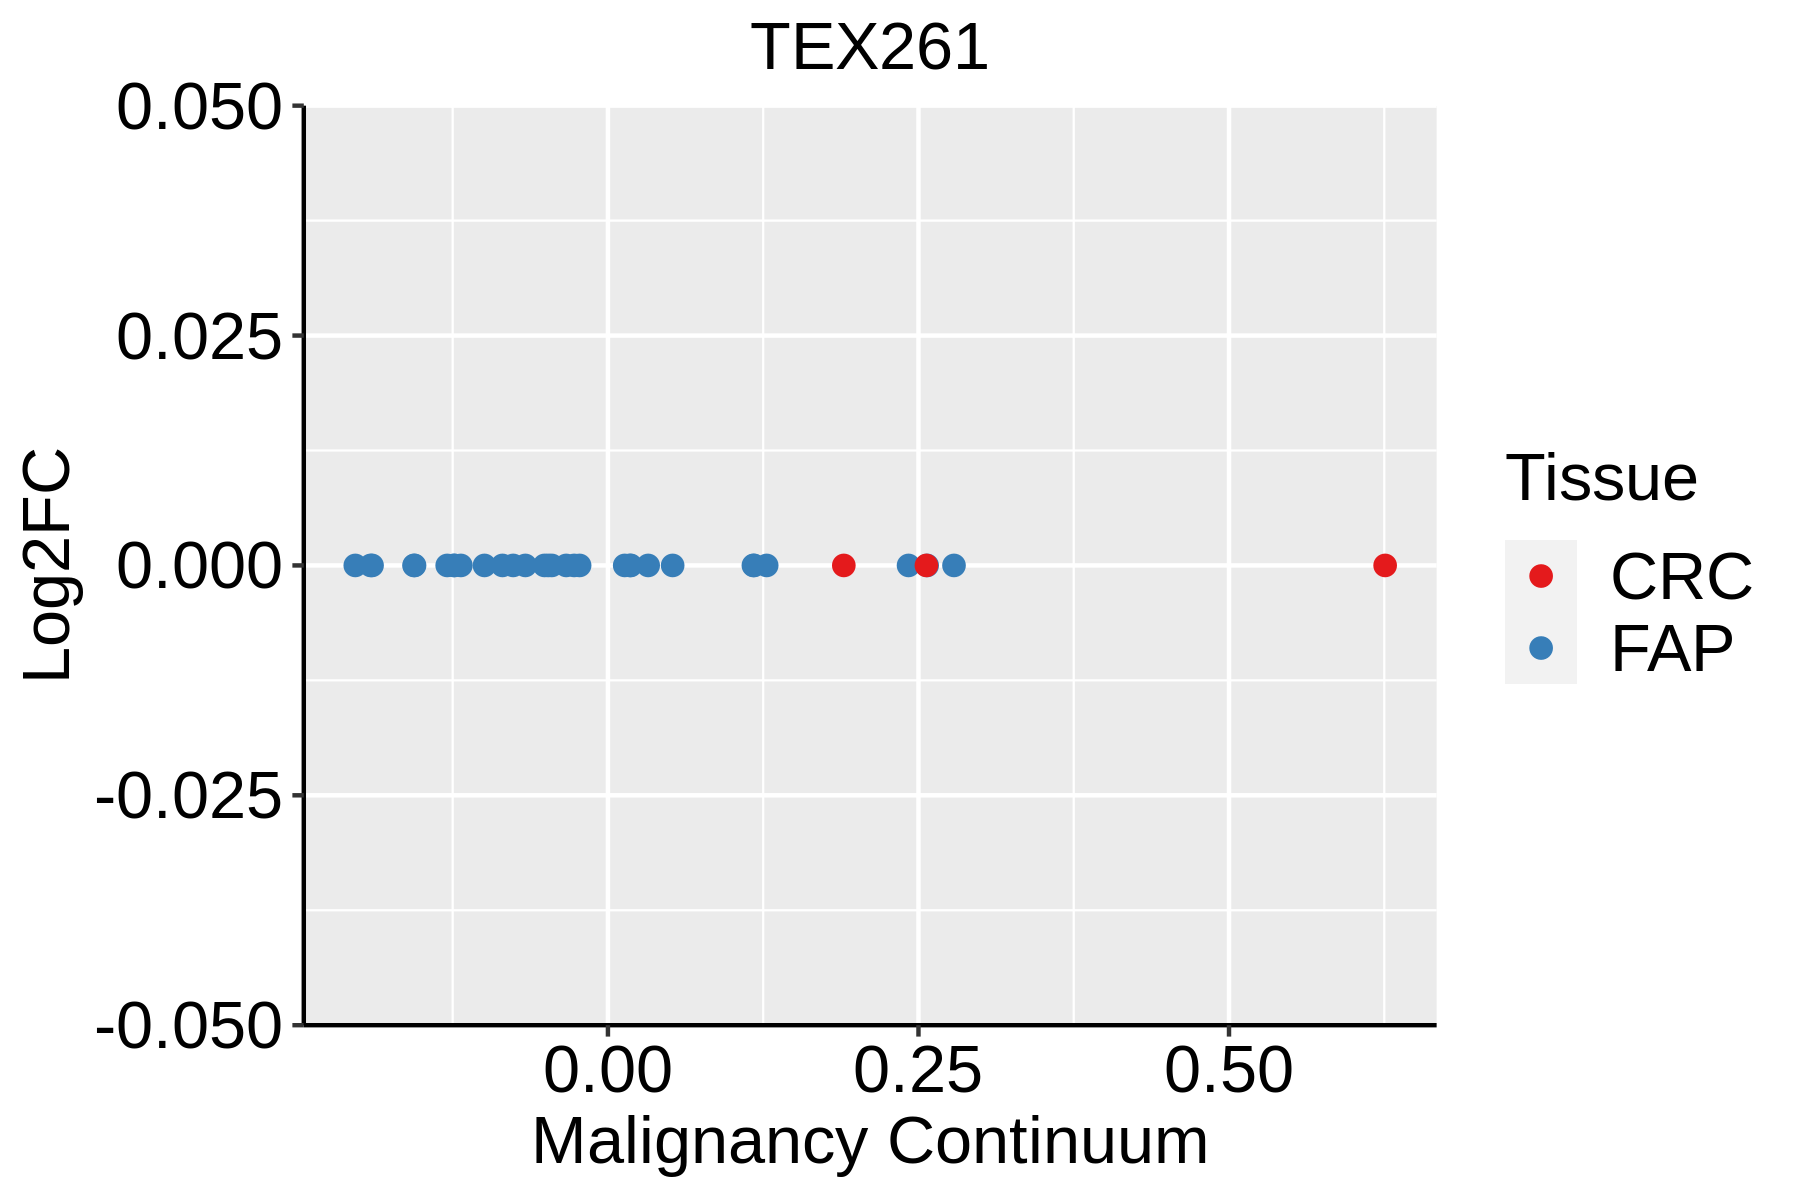 | FAP: Familial adenomatous polyposis |
| CRC: Colorectal cancer | ||
| Colorectum (HTA11) |  | AD: Adenomas |
| SER: Sessile serrated lesions | ||
| MSI-H: Microsatellite-high colorectal cancer | ||
| MSS: Microsatellite stable colorectal cancer | ||
| Liver | 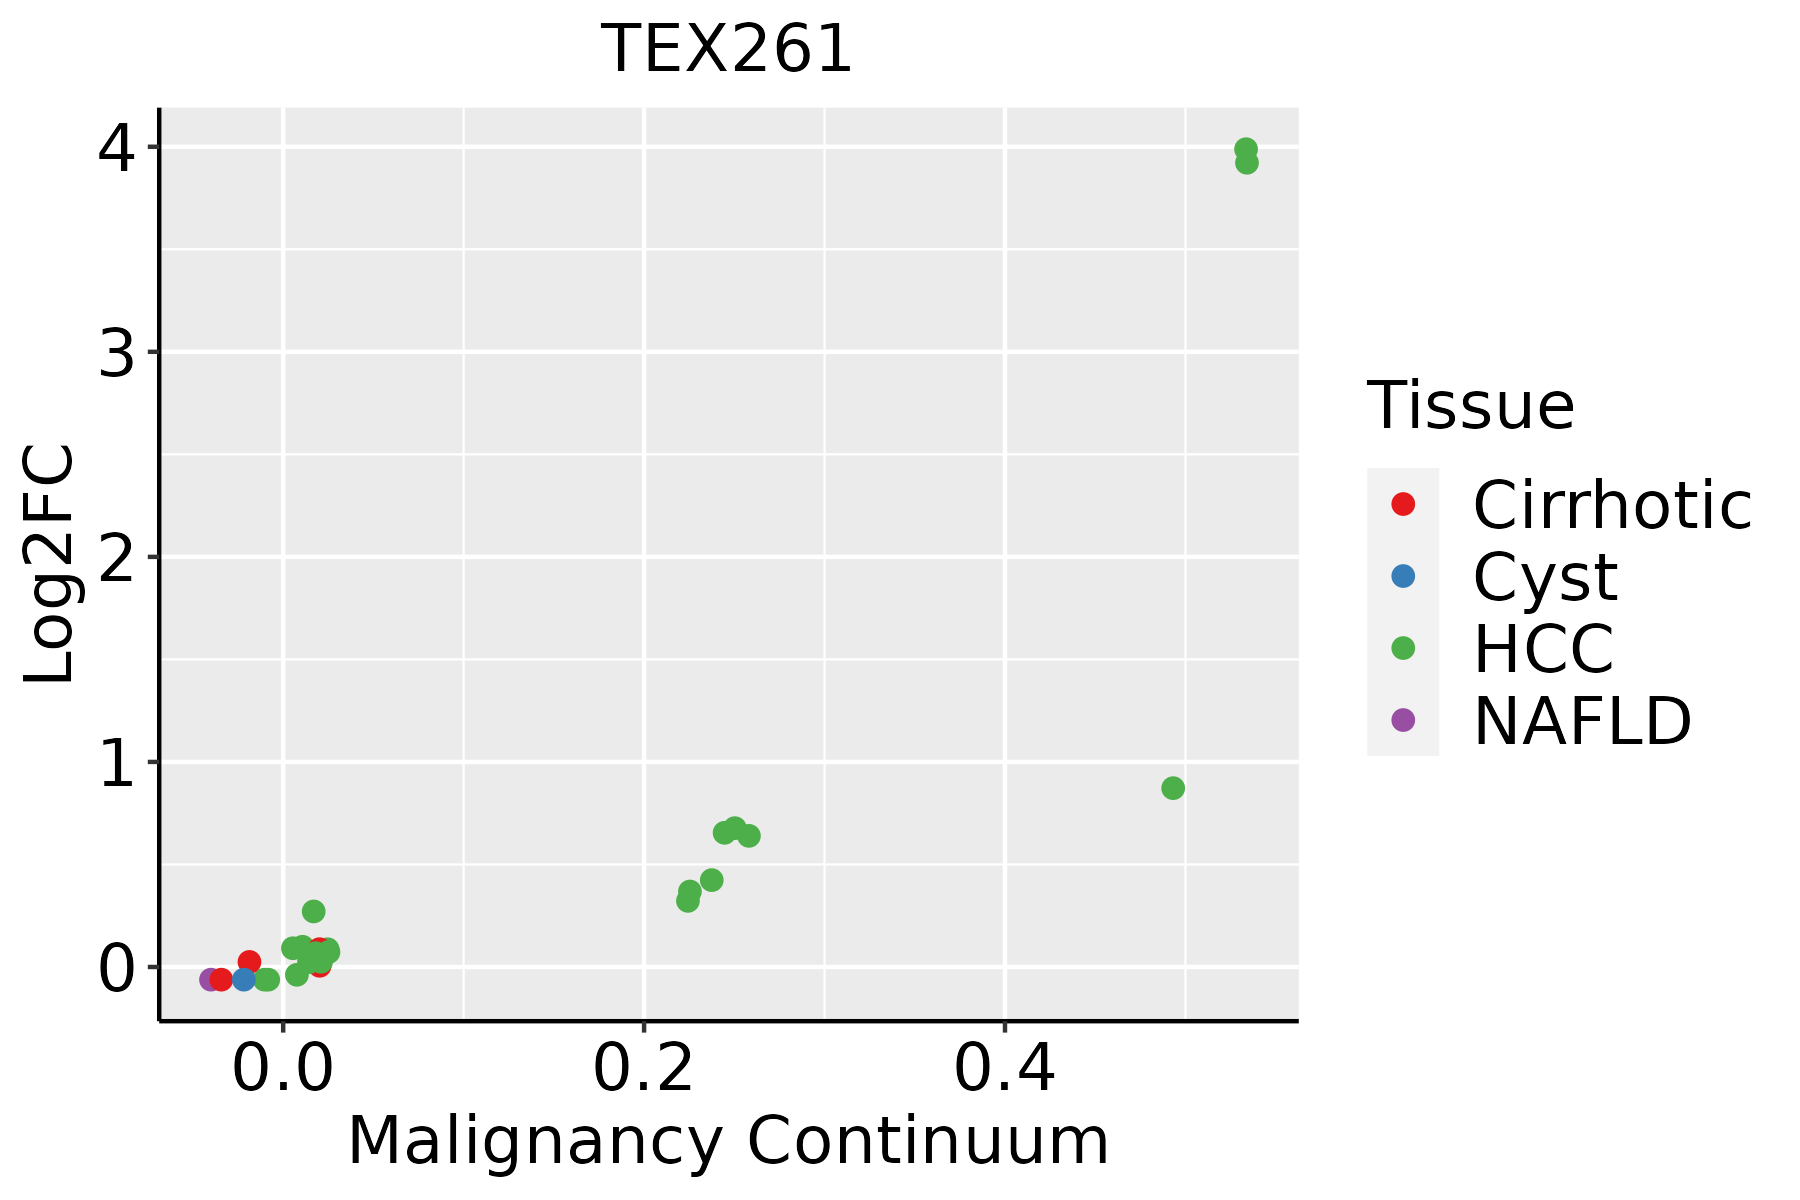 | HCC: Hepatocellular carcinoma |
| NAFLD: Non-alcoholic fatty liver disease | ||
| Oral Cavity | 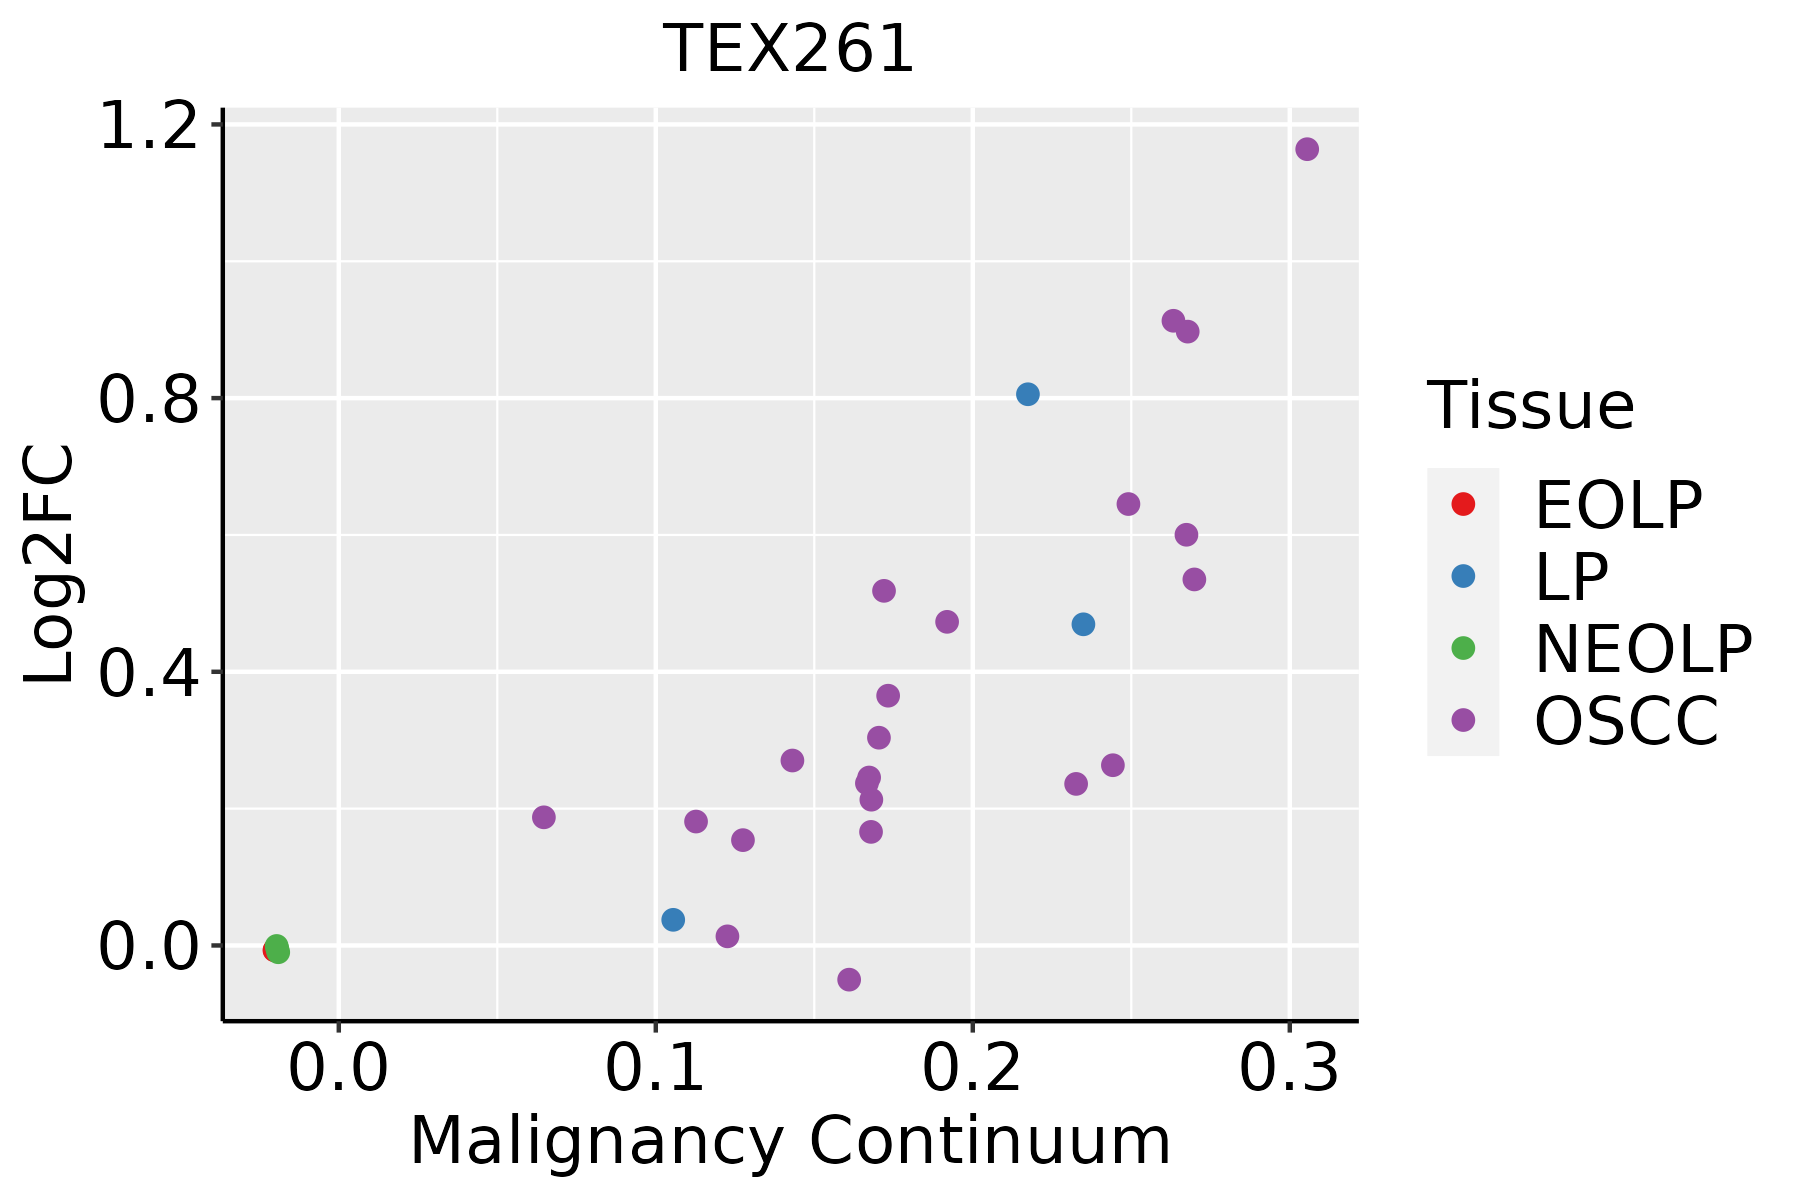 | EOLP: Erosive Oral lichen planus |
| LP: leukoplakia | ||
| NEOLP: Non-erosive oral lichen planus | ||
| OSCC: Oral squamous cell carcinoma |
| ∗log2FC in expression of this searched gene in stem-like cells from each diseased tissue sample relative to stem-like cells in normal samples in each tissue plotted against the malignancy continuum. Samples are colored based on if they are from different disease stage. |
Top |
Malignant transformation related pathway analysis |
| Find out the enriched GO biological processes and KEGG pathways involved in transition from healthy to precancer to cancer |
| Tissue | Disease Stage | Enriched GO biological Processes |
| Colorectum | AD |  |
| Colorectum | SER |  |
| Colorectum | MSS |  |
| Colorectum | MSI-H |  |
| Colorectum | FAP |  |
| ∗Top 15 enriched GO BP terms are showed in the bar plot of each disease state in each tissue. Each row represents a significant GO biological process which is colored according to the -log10(p.adjust). |
| Page: 1 2 3 4 5 6 7 8 9 |
| GO ID | Tissue | Disease Stage | Description | Gene Ratio | Bg Ratio | pvalue | p.adjust | Count |
| GO:0048193 | Colorectum | AD | Golgi vesicle transport | 109/3918 | 296/18723 | 1.80e-10 | 1.68e-08 | 109 |
| GO:0006888 | Colorectum | AD | endoplasmic reticulum to Golgi vesicle-mediated transport | 44/3918 | 130/18723 | 4.13e-04 | 4.68e-03 | 44 |
| GO:00481931 | Colorectum | SER | Golgi vesicle transport | 79/2897 | 296/18723 | 4.20e-07 | 2.15e-05 | 79 |
| GO:00068881 | Colorectum | SER | endoplasmic reticulum to Golgi vesicle-mediated transport | 34/2897 | 130/18723 | 1.13e-03 | 1.29e-02 | 34 |
| GO:00481932 | Colorectum | MSS | Golgi vesicle transport | 101/3467 | 296/18723 | 9.09e-11 | 9.77e-09 | 101 |
| GO:00068882 | Colorectum | MSS | endoplasmic reticulum to Golgi vesicle-mediated transport | 44/3467 | 130/18723 | 2.17e-05 | 4.60e-04 | 44 |
| GO:00068883 | Colorectum | MSI-H | endoplasmic reticulum to Golgi vesicle-mediated transport | 22/1319 | 130/18723 | 1.05e-04 | 3.24e-03 | 22 |
| GO:00481933 | Colorectum | MSI-H | Golgi vesicle transport | 39/1319 | 296/18723 | 1.17e-04 | 3.51e-03 | 39 |
| GO:004819311 | Liver | Cirrhotic | Golgi vesicle transport | 153/4634 | 296/18723 | 1.02e-23 | 6.43e-21 | 153 |
| GO:000688811 | Liver | Cirrhotic | endoplasmic reticulum to Golgi vesicle-mediated transport | 77/4634 | 130/18723 | 5.78e-17 | 7.56e-15 | 77 |
| GO:004819321 | Liver | HCC | Golgi vesicle transport | 217/7958 | 296/18723 | 2.58e-27 | 1.02e-24 | 217 |
| GO:000688821 | Liver | HCC | endoplasmic reticulum to Golgi vesicle-mediated transport | 100/7958 | 130/18723 | 1.15e-15 | 8.67e-14 | 100 |
| GO:004819315 | Oral cavity | OSCC | Golgi vesicle transport | 209/7305 | 296/18723 | 1.39e-28 | 6.30e-26 | 209 |
| GO:00068888 | Oral cavity | OSCC | endoplasmic reticulum to Golgi vesicle-mediated transport | 97/7305 | 130/18723 | 1.42e-16 | 1.15e-14 | 97 |
| GO:004819316 | Oral cavity | LP | Golgi vesicle transport | 141/4623 | 296/18723 | 6.11e-18 | 1.06e-15 | 141 |
| GO:000688814 | Oral cavity | LP | endoplasmic reticulum to Golgi vesicle-mediated transport | 67/4623 | 130/18723 | 3.74e-11 | 2.39e-09 | 67 |
| Page: 1 |
| Pathway ID | Tissue | Disease Stage | Description | Gene Ratio | Bg Ratio | pvalue | p.adjust | qvalue | Count |
| Page: 1 |
Top |
Cell-cell communication analysis |
| Identification of potential cell-cell interactions between two cell types and their ligand-receptor pairs for different disease states |
| Ligand | Receptor | LRpair | Pathway | Tissue | Disease Stage |
| Page: 1 |
Top |
Single-cell gene regulatory network inference analysis |
| Find out the significant the regulons (TFs) and the target genes of each regulon across cell types for different disease states |
| TF | Cell Type | Tissue | Disease Stage | Target Gene | RSS | Regulon Activity |
| ∗The dot plots of a searched regulon are shown for all cell subpopulations in each disease state of each tissue based on the regulon specific score inferred using pySCENIC and by calculating the average expression. |
| Page: 1 |
Top |
Somatic mutation of malignant transformation related genes |
| Annotation of somatic variants for genes involved in malignant transformation |
| Hugo Symbol | Variant Class | Variant Classification | dbSNP RS | HGVSc | HGVSp | HGVSp Short | SWISSPROT | BIOTYPE | SIFT | PolyPhen | Tumor Sample Barcode | Tissue | Histology | Sex | Age | Stage | Therapy Types | Drugs | Outcome |
| TEX261 | SNV | Missense_Mutation | c.305N>A | p.Gly102Glu | p.G102E | Q6UWH6 | protein_coding | deleterious(0.01) | benign(0.106) | TCGA-BH-A0HF-01 | Breast | breast invasive carcinoma | Female | >=65 | I/II | Hormone Therapy | arimidex | SD | |
| TEX261 | SNV | Missense_Mutation | rs782474395 | c.181N>A | p.Val61Ile | p.V61I | Q6UWH6 | protein_coding | tolerated(0.49) | benign(0.003) | TCGA-AA-A01V-01 | Colorectum | colon adenocarcinoma | Male | <65 | I/II | Unknown | Unknown | SD |
| TEX261 | SNV | Missense_Mutation | novel | c.500N>T | p.Thr167Ile | p.T167I | Q6UWH6 | protein_coding | tolerated(0.13) | probably_damaging(0.938) | TCGA-FI-A2F4-01 | Endometrium | uterine corpus endometrioid carcinoma | Female | <65 | I/II | Unknown | Unknown | SD |
| TEX261 | insertion | Frame_Shift_Ins | novel | c.423_424insT | p.Val142CysfsTer19 | p.V142Cfs*19 | Q6UWH6 | protein_coding | TCGA-D1-A177-01 | Endometrium | uterine corpus endometrioid carcinoma | Female | >=65 | I/II | Unknown | Unknown | PD | ||
| TEX261 | insertion | Frame_Shift_Ins | novel | c.264dupC | p.Phe89LeufsTer8 | p.F89Lfs*8 | Q6UWH6 | protein_coding | TCGA-EO-A3KX-01 | Endometrium | uterine corpus endometrioid carcinoma | Female | >=65 | I/II | Unknown | Unknown | SD | ||
| TEX261 | SNV | Missense_Mutation | rs782138539 | c.191G>A | p.Arg64His | p.R64H | Q6UWH6 | protein_coding | tolerated(0.19) | benign(0) | TCGA-BR-8591-01 | Stomach | stomach adenocarcinoma | Male | >=65 | III/IV | Unknown | Unknown | SD |
| TEX261 | SNV | Missense_Mutation | novel | c.568N>T | p.Pro190Ser | p.P190S | Q6UWH6 | protein_coding | deleterious(0.01) | probably_damaging(0.968) | TCGA-VQ-A8P2-01 | Stomach | stomach adenocarcinoma | Male | >=65 | III/IV | Unspecific | Complete Response |
| Page: 1 |
Top |
Related drugs of malignant transformation related genes |
| Identification of chemicals and drugs interact with genes involved in malignant transfromation |
| (DGIdb 4.0) |
| Entrez ID | Symbol | Category | Interaction Types | Drug Claim Name | Drug Name | PMIDs |
| Page: 1 |

Copyright 2023-Present -The University of Texas Health Science Center at Houston |