
|
|||||
|
 | |
| |
| |
| |
| |
| |
|
Gene: TEX2 |
Gene summary for TEX2 |
| Gene information | Species | Human | Gene symbol | TEX2 | Gene ID | 55852 |
| Gene name | testis expressed 2 | |
| Gene Alias | HT008 | |
| Cytomap | 17q23.3 | |
| Gene Type | protein-coding | GO ID | GO:0006629 | UniProtAcc | Q8IWB9 |
Top |
Malignant transformation analysis |
| Identification of the aberrant gene expression in precancerous and cancerous lesions by comparing the gene expression of stem-like cells in diseased tissues with normal stem cells |
| Entrez ID | Symbol | Replicates | Species | Organ | Tissue | Adj P-value | Log2FC | Malignancy |
| 55852 | TEX2 | LZE4T | Human | Esophagus | ESCC | 9.21e-03 | 1.39e-01 | 0.0811 |
| 55852 | TEX2 | LZE24T | Human | Esophagus | ESCC | 8.00e-04 | 1.31e-01 | 0.0596 |
| 55852 | TEX2 | P1T-E | Human | Esophagus | ESCC | 1.25e-16 | 9.13e-01 | 0.0875 |
| 55852 | TEX2 | P2T-E | Human | Esophagus | ESCC | 2.75e-08 | 5.85e-02 | 0.1177 |
| 55852 | TEX2 | P8T-E | Human | Esophagus | ESCC | 1.62e-09 | 6.61e-02 | 0.0889 |
| 55852 | TEX2 | P10T-E | Human | Esophagus | ESCC | 3.27e-06 | 4.42e-02 | 0.116 |
| 55852 | TEX2 | P11T-E | Human | Esophagus | ESCC | 1.06e-08 | 4.00e-01 | 0.1426 |
| 55852 | TEX2 | P12T-E | Human | Esophagus | ESCC | 2.66e-05 | 8.31e-02 | 0.1122 |
| 55852 | TEX2 | P15T-E | Human | Esophagus | ESCC | 1.53e-08 | 1.93e-01 | 0.1149 |
| 55852 | TEX2 | P16T-E | Human | Esophagus | ESCC | 1.37e-04 | 2.69e-02 | 0.1153 |
| 55852 | TEX2 | P21T-E | Human | Esophagus | ESCC | 3.18e-14 | 1.77e-01 | 0.1617 |
| 55852 | TEX2 | P22T-E | Human | Esophagus | ESCC | 4.57e-08 | 4.02e-02 | 0.1236 |
| 55852 | TEX2 | P23T-E | Human | Esophagus | ESCC | 3.26e-08 | 2.50e-01 | 0.108 |
| 55852 | TEX2 | P26T-E | Human | Esophagus | ESCC | 2.55e-06 | 1.58e-01 | 0.1276 |
| 55852 | TEX2 | P27T-E | Human | Esophagus | ESCC | 2.92e-04 | 3.64e-02 | 0.1055 |
| 55852 | TEX2 | P28T-E | Human | Esophagus | ESCC | 6.91e-10 | 1.36e-01 | 0.1149 |
| 55852 | TEX2 | P30T-E | Human | Esophagus | ESCC | 5.27e-07 | 1.75e-01 | 0.137 |
| 55852 | TEX2 | P31T-E | Human | Esophagus | ESCC | 1.00e-02 | 4.19e-02 | 0.1251 |
| 55852 | TEX2 | P32T-E | Human | Esophagus | ESCC | 8.93e-17 | 1.94e-01 | 0.1666 |
| 55852 | TEX2 | P36T-E | Human | Esophagus | ESCC | 9.76e-05 | 1.54e-01 | 0.1187 |
| Page: 1 2 3 |
| Tissue | Expression Dynamics | Abbreviation |
| Esophagus |  | ESCC: Esophageal squamous cell carcinoma |
| HGIN: High-grade intraepithelial neoplasias | ||
| LGIN: Low-grade intraepithelial neoplasias | ||
| Liver | 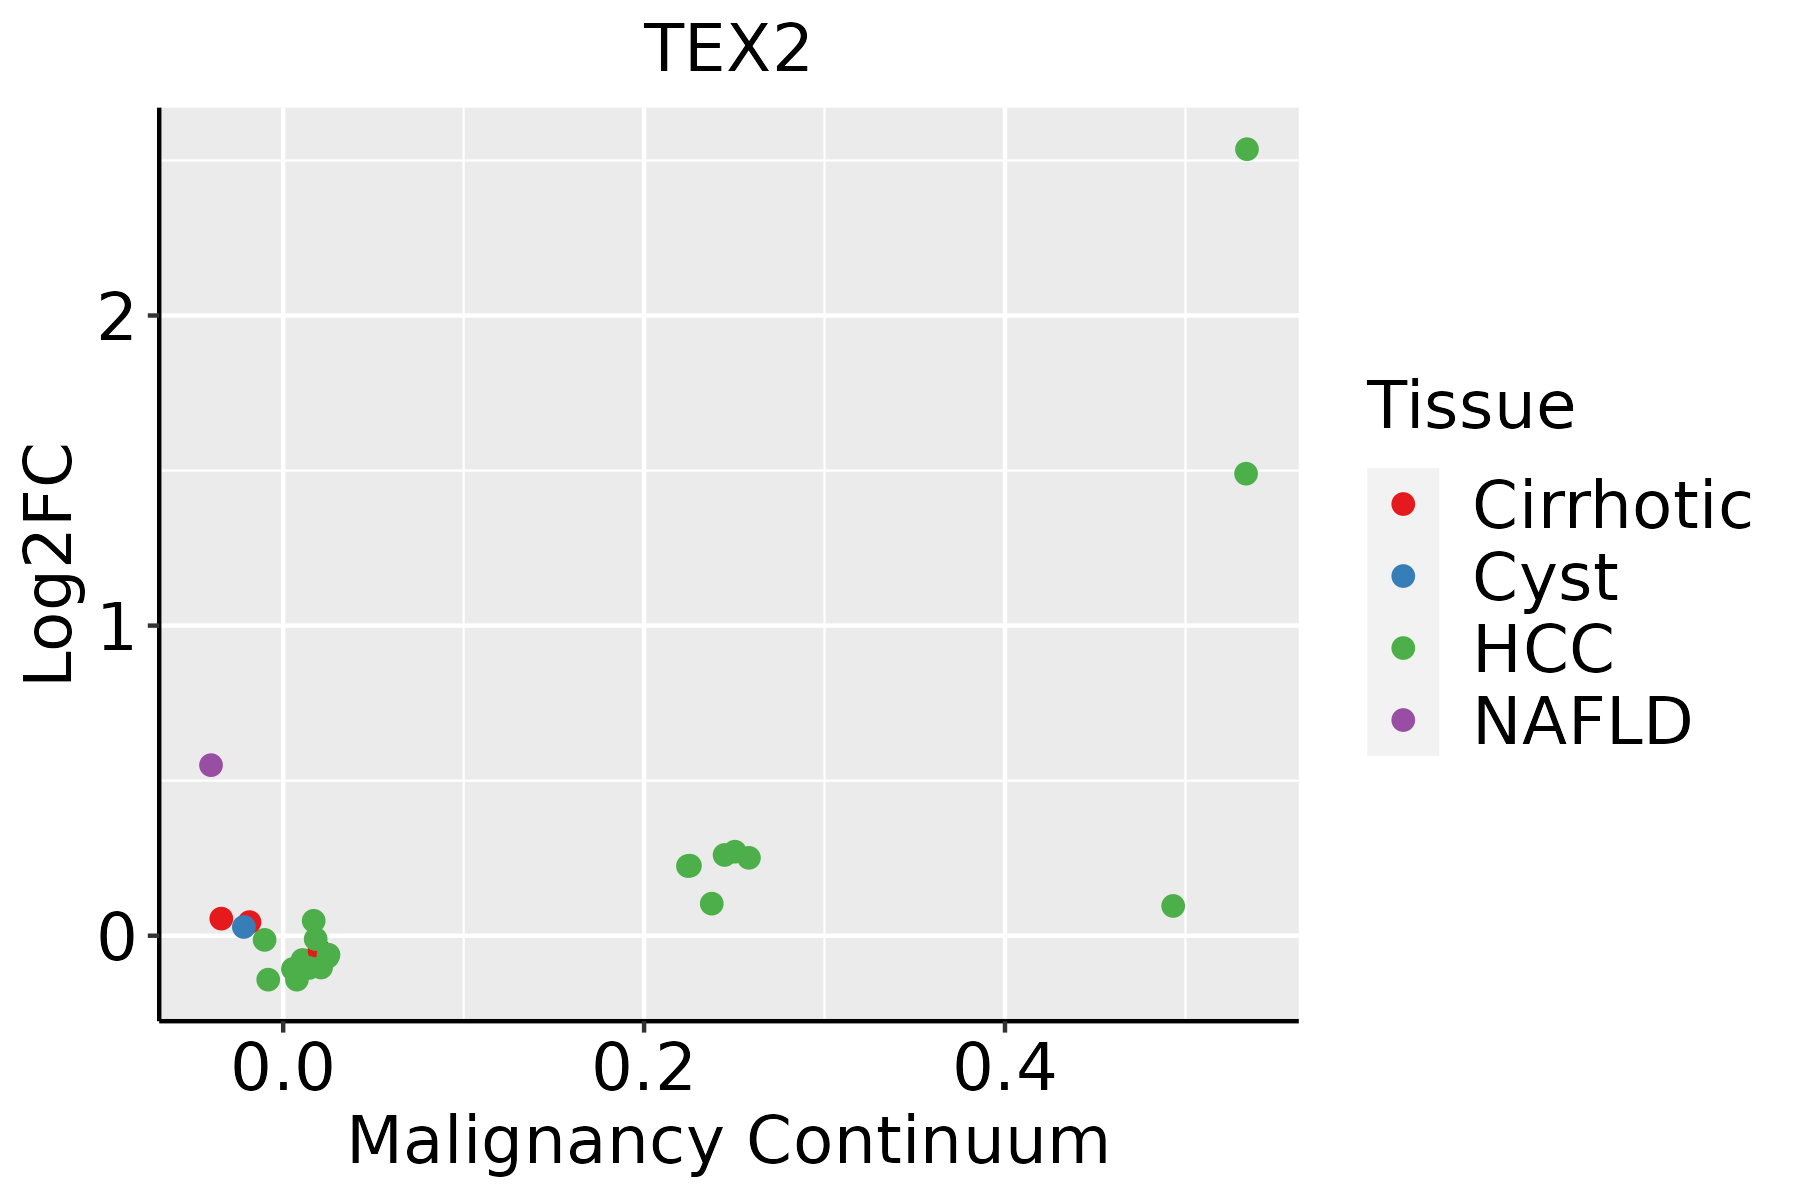 | HCC: Hepatocellular carcinoma |
| NAFLD: Non-alcoholic fatty liver disease |
| ∗log2FC in expression of this searched gene in stem-like cells from each diseased tissue sample relative to stem-like cells in normal samples in each tissue plotted against the malignancy continuum. Samples are colored based on if they are from different disease stage. |
Top |
Malignant transformation related pathway analysis |
| Find out the enriched GO biological processes and KEGG pathways involved in transition from healthy to precancer to cancer |
| Tissue | Disease Stage | Enriched GO biological Processes |
| Colorectum | AD |  |
| Colorectum | SER |  |
| Colorectum | MSS |  |
| Colorectum | MSI-H |  |
| Colorectum | FAP |  |
| ∗Top 15 enriched GO BP terms are showed in the bar plot of each disease state in each tissue. Each row represents a significant GO biological process which is colored according to the -log10(p.adjust). |
| Page: 1 2 3 4 5 6 7 8 9 |
| GO ID | Tissue | Disease Stage | Description | Gene Ratio | Bg Ratio | pvalue | p.adjust | Count |
| GO:0048193 | Colorectum | AD | Golgi vesicle transport | 109/3918 | 296/18723 | 1.80e-10 | 1.68e-08 | 109 |
| GO:0006888 | Colorectum | AD | endoplasmic reticulum to Golgi vesicle-mediated transport | 44/3918 | 130/18723 | 4.13e-04 | 4.68e-03 | 44 |
| GO:00481931 | Colorectum | SER | Golgi vesicle transport | 79/2897 | 296/18723 | 4.20e-07 | 2.15e-05 | 79 |
| GO:00068881 | Colorectum | SER | endoplasmic reticulum to Golgi vesicle-mediated transport | 34/2897 | 130/18723 | 1.13e-03 | 1.29e-02 | 34 |
| GO:00481932 | Colorectum | MSS | Golgi vesicle transport | 101/3467 | 296/18723 | 9.09e-11 | 9.77e-09 | 101 |
| GO:00068882 | Colorectum | MSS | endoplasmic reticulum to Golgi vesicle-mediated transport | 44/3467 | 130/18723 | 2.17e-05 | 4.60e-04 | 44 |
| GO:00068883 | Colorectum | MSI-H | endoplasmic reticulum to Golgi vesicle-mediated transport | 22/1319 | 130/18723 | 1.05e-04 | 3.24e-03 | 22 |
| GO:00481933 | Colorectum | MSI-H | Golgi vesicle transport | 39/1319 | 296/18723 | 1.17e-04 | 3.51e-03 | 39 |
| GO:001623616 | Esophagus | HGIN | macroautophagy | 77/2587 | 291/18723 | 7.15e-09 | 4.61e-07 | 77 |
| GO:002241120 | Esophagus | HGIN | cellular component disassembly | 102/2587 | 443/18723 | 8.31e-08 | 4.33e-06 | 102 |
| GO:19030089 | Esophagus | HGIN | organelle disassembly | 36/2587 | 114/18723 | 8.60e-07 | 3.58e-05 | 36 |
| GO:00619128 | Esophagus | HGIN | selective autophagy | 19/2587 | 68/18723 | 1.68e-03 | 1.85e-02 | 19 |
| GO:001623617 | Esophagus | ESCC | macroautophagy | 216/8552 | 291/18723 | 1.94e-23 | 4.57e-21 | 216 |
| GO:0022411111 | Esophagus | ESCC | cellular component disassembly | 305/8552 | 443/18723 | 1.94e-23 | 4.57e-21 | 305 |
| GO:190300816 | Esophagus | ESCC | organelle disassembly | 89/8552 | 114/18723 | 1.36e-12 | 5.80e-11 | 89 |
| GO:00066433 | Esophagus | ESCC | membrane lipid metabolic process | 130/8552 | 203/18723 | 9.29e-08 | 1.54e-06 | 130 |
| GO:00066652 | Esophagus | ESCC | sphingolipid metabolic process | 96/8552 | 155/18723 | 3.21e-05 | 2.66e-04 | 96 |
| GO:006191215 | Esophagus | ESCC | selective autophagy | 47/8552 | 68/18723 | 7.81e-05 | 5.80e-04 | 47 |
| GO:00108765 | Liver | NAFLD | lipid localization | 79/1882 | 448/18723 | 4.75e-07 | 2.92e-05 | 79 |
| GO:00068694 | Liver | NAFLD | lipid transport | 71/1882 | 398/18723 | 1.16e-06 | 5.59e-05 | 71 |
| Page: 1 2 3 4 |
| Pathway ID | Tissue | Disease Stage | Description | Gene Ratio | Bg Ratio | pvalue | p.adjust | qvalue | Count |
| Page: 1 |
Top |
Cell-cell communication analysis |
| Identification of potential cell-cell interactions between two cell types and their ligand-receptor pairs for different disease states |
| Ligand | Receptor | LRpair | Pathway | Tissue | Disease Stage |
| Page: 1 |
Top |
Single-cell gene regulatory network inference analysis |
| Find out the significant the regulons (TFs) and the target genes of each regulon across cell types for different disease states |
| TF | Cell Type | Tissue | Disease Stage | Target Gene | RSS | Regulon Activity |
| ∗The dot plots of a searched regulon are shown for all cell subpopulations in each disease state of each tissue based on the regulon specific score inferred using pySCENIC and by calculating the average expression. |
| Page: 1 |
Top |
Somatic mutation of malignant transformation related genes |
| Annotation of somatic variants for genes involved in malignant transformation |
| Hugo Symbol | Variant Class | Variant Classification | dbSNP RS | HGVSc | HGVSp | HGVSp Short | SWISSPROT | BIOTYPE | SIFT | PolyPhen | Tumor Sample Barcode | Tissue | Histology | Sex | Age | Stage | Therapy Types | Drugs | Outcome |
| TEX2 | SNV | Missense_Mutation | novel | c.735N>G | p.His245Gln | p.H245Q | Q8IWB9 | protein_coding | tolerated(0.4) | benign(0.227) | TCGA-A8-A06X-01 | Breast | breast invasive carcinoma | Female | >=65 | I/II | Unknown | Unknown | SD |
| TEX2 | SNV | Missense_Mutation | c.463N>A | p.Glu155Lys | p.E155K | Q8IWB9 | protein_coding | tolerated(0.12) | benign(0.011) | TCGA-AC-A23H-01 | Breast | breast invasive carcinoma | Female | >=65 | I/II | Unknown | Unknown | PD | |
| TEX2 | SNV | Missense_Mutation | novel | c.2848N>G | p.Leu950Val | p.L950V | Q8IWB9 | protein_coding | deleterious(0) | possibly_damaging(0.799) | TCGA-AC-A62Y-01 | Breast | breast invasive carcinoma | Female | >=65 | I/II | Unknown | Unknown | SD |
| TEX2 | SNV | Missense_Mutation | novel | c.1000N>G | p.Leu334Val | p.L334V | Q8IWB9 | protein_coding | tolerated(0.39) | benign(0.122) | TCGA-Z7-A8R6-01 | Breast | breast invasive carcinoma | Female | <65 | I/II | Chemotherapy | taxol | CR |
| TEX2 | insertion | Frame_Shift_Ins | novel | c.707_708insAAAGAAAAAAAAAAGGCAAATACTAAGTGGAGGATTGGAGAAGTGG | p.Pro237LysfsTer18 | p.P237Kfs*18 | Q8IWB9 | protein_coding | TCGA-A2-A04Y-01 | Breast | breast invasive carcinoma | Female | <65 | I/II | Chemotherapy | cytoxan | SD | ||
| TEX2 | insertion | Nonsense_Mutation | novel | c.736_737insATCAAGGAGGAGGAGTGTGATTCTGAGGGGGATGGCTACGG | p.Leu246HisfsTer7 | p.L246Hfs*7 | Q8IWB9 | protein_coding | TCGA-A8-A06X-01 | Breast | breast invasive carcinoma | Female | >=65 | I/II | Unknown | Unknown | SD | ||
| TEX2 | insertion | In_Frame_Ins | novel | c.1487_1488insCCTAGAACTTCTATTTATTATTATTTTTTT | p.Ser496_Gly497insLeuGluLeuLeuPheIleIleIlePhePhe | p.S496_G497insLELLFIIIFF | Q8IWB9 | protein_coding | TCGA-AN-A046-01 | Breast | breast invasive carcinoma | Female | >=65 | I/II | Unknown | Unknown | SD | ||
| TEX2 | insertion | Frame_Shift_Ins | novel | c.3006_3007insTGTGA | p.Lys1003CysfsTer65 | p.K1003Cfs*65 | Q8IWB9 | protein_coding | TCGA-AN-A0FX-01 | Breast | breast invasive carcinoma | Female | <65 | I/II | Unknown | Unknown | SD | ||
| TEX2 | insertion | In_Frame_Ins | novel | c.3005_3006insTGATGAGTTCAGCATCACTGC | p.Thr1002_Lys1003insAspGluPheSerIleThrAla | p.T1002_K1003insDEFSITA | Q8IWB9 | protein_coding | TCGA-AN-A0FX-01 | Breast | breast invasive carcinoma | Female | <65 | I/II | Unknown | Unknown | SD | ||
| TEX2 | insertion | Nonsense_Mutation | novel | c.2022_2023insGTAAGTCTGGGTTGCCTTTGAAAGCTATGAATTGAGATATTTATGGTA | p.Pro674_Gln675insValSerLeuGlyCysLeuTerLysLeuTerIleGluIlePheMetVal | p.P674_Q675insVSLGCL*KL*IEIFMV | Q8IWB9 | protein_coding | TCGA-BH-A0B1-01 | Breast | breast invasive carcinoma | Female | >=65 | I/II | Chemotherapy | adriamycin | SD |
| Page: 1 2 3 4 5 6 7 8 9 10 11 12 13 |
Top |
Related drugs of malignant transformation related genes |
| Identification of chemicals and drugs interact with genes involved in malignant transfromation |
| (DGIdb 4.0) |
| Entrez ID | Symbol | Category | Interaction Types | Drug Claim Name | Drug Name | PMIDs |
| Page: 1 |

Copyright 2023-Present -The University of Texas Health Science Center at Houston |