
|
|||||
|
 | |
| |
| |
| |
| |
| |
|
Gene: TEX14 |
Gene summary for TEX14 |
| Gene information | Species | Human | Gene symbol | TEX14 | Gene ID | 56155 |
| Gene name | testis expressed 14, intercellular bridge forming factor | |
| Gene Alias | CT113 | |
| Cytomap | 17q22 | |
| Gene Type | protein-coding | GO ID | GO:0000003 | UniProtAcc | Q8IWB6 |
Top |
Malignant transformation analysis |
| Identification of the aberrant gene expression in precancerous and cancerous lesions by comparing the gene expression of stem-like cells in diseased tissues with normal stem cells |
| Entrez ID | Symbol | Replicates | Species | Organ | Tissue | Adj P-value | Log2FC | Malignancy |
| 56155 | TEX14 | AEH-subject1 | Human | Endometrium | AEH | 5.67e-41 | 7.79e-01 | -0.3059 |
| 56155 | TEX14 | AEH-subject2 | Human | Endometrium | AEH | 9.01e-17 | 5.14e-01 | -0.2525 |
| 56155 | TEX14 | AEH-subject3 | Human | Endometrium | AEH | 8.38e-18 | 4.62e-01 | -0.2576 |
| 56155 | TEX14 | AEH-subject4 | Human | Endometrium | AEH | 1.07e-08 | 3.75e-01 | -0.2657 |
| 56155 | TEX14 | EEC-subject1 | Human | Endometrium | EEC | 1.30e-14 | 3.33e-01 | -0.2682 |
| 56155 | TEX14 | EEC-subject2 | Human | Endometrium | EEC | 8.49e-10 | 3.10e-01 | -0.2607 |
| 56155 | TEX14 | EEC-subject4 | Human | Endometrium | EEC | 1.85e-09 | 2.48e-01 | -0.2571 |
| 56155 | TEX14 | EEC-subject5 | Human | Endometrium | EEC | 3.71e-04 | 1.33e-01 | -0.249 |
| 56155 | TEX14 | TD9 | Human | Lung | IAC | 8.30e-17 | 1.58e+00 | 0.088 |
| 56155 | TEX14 | RNA-P17T-P17T-2 | Human | Lung | IAC | 2.13e-03 | 8.61e-01 | 0.3371 |
| 56155 | TEX14 | RNA-P17T-P17T-4 | Human | Lung | IAC | 2.66e-08 | 9.33e-01 | 0.343 |
| 56155 | TEX14 | RNA-P17T-P17T-6 | Human | Lung | IAC | 9.84e-12 | 1.21e+00 | 0.3385 |
| 56155 | TEX14 | RNA-P17T-P17T-8 | Human | Lung | IAC | 7.13e-14 | 1.16e+00 | 0.3329 |
| 56155 | TEX14 | RNA-P6T2-P6T2-1 | Human | Lung | IAC | 1.26e-04 | 2.82e-01 | -0.0166 |
| 56155 | TEX14 | RNA-P6T2-P6T2-2 | Human | Lung | IAC | 1.22e-08 | 4.15e-01 | -0.0132 |
| 56155 | TEX14 | RNA-P6T2-P6T2-3 | Human | Lung | IAC | 1.03e-05 | 3.22e-01 | -0.013 |
| 56155 | TEX14 | RNA-P6T2-P6T2-4 | Human | Lung | IAC | 1.62e-06 | 2.95e-01 | -0.0121 |
| 56155 | TEX14 | 047563_1562-all-cells | Human | Prostate | BPH | 1.43e-04 | 2.32e-01 | 0.0791 |
| 56155 | TEX14 | 048752_1579-all-cells | Human | Prostate | BPH | 2.09e-36 | 6.93e-01 | 0.1008 |
| 56155 | TEX14 | 052095_1628-all-cells | Human | Prostate | BPH | 3.00e-12 | 3.63e-01 | 0.1032 |
| Page: 1 2 3 |
| Tissue | Expression Dynamics | Abbreviation |
| Endometrium | 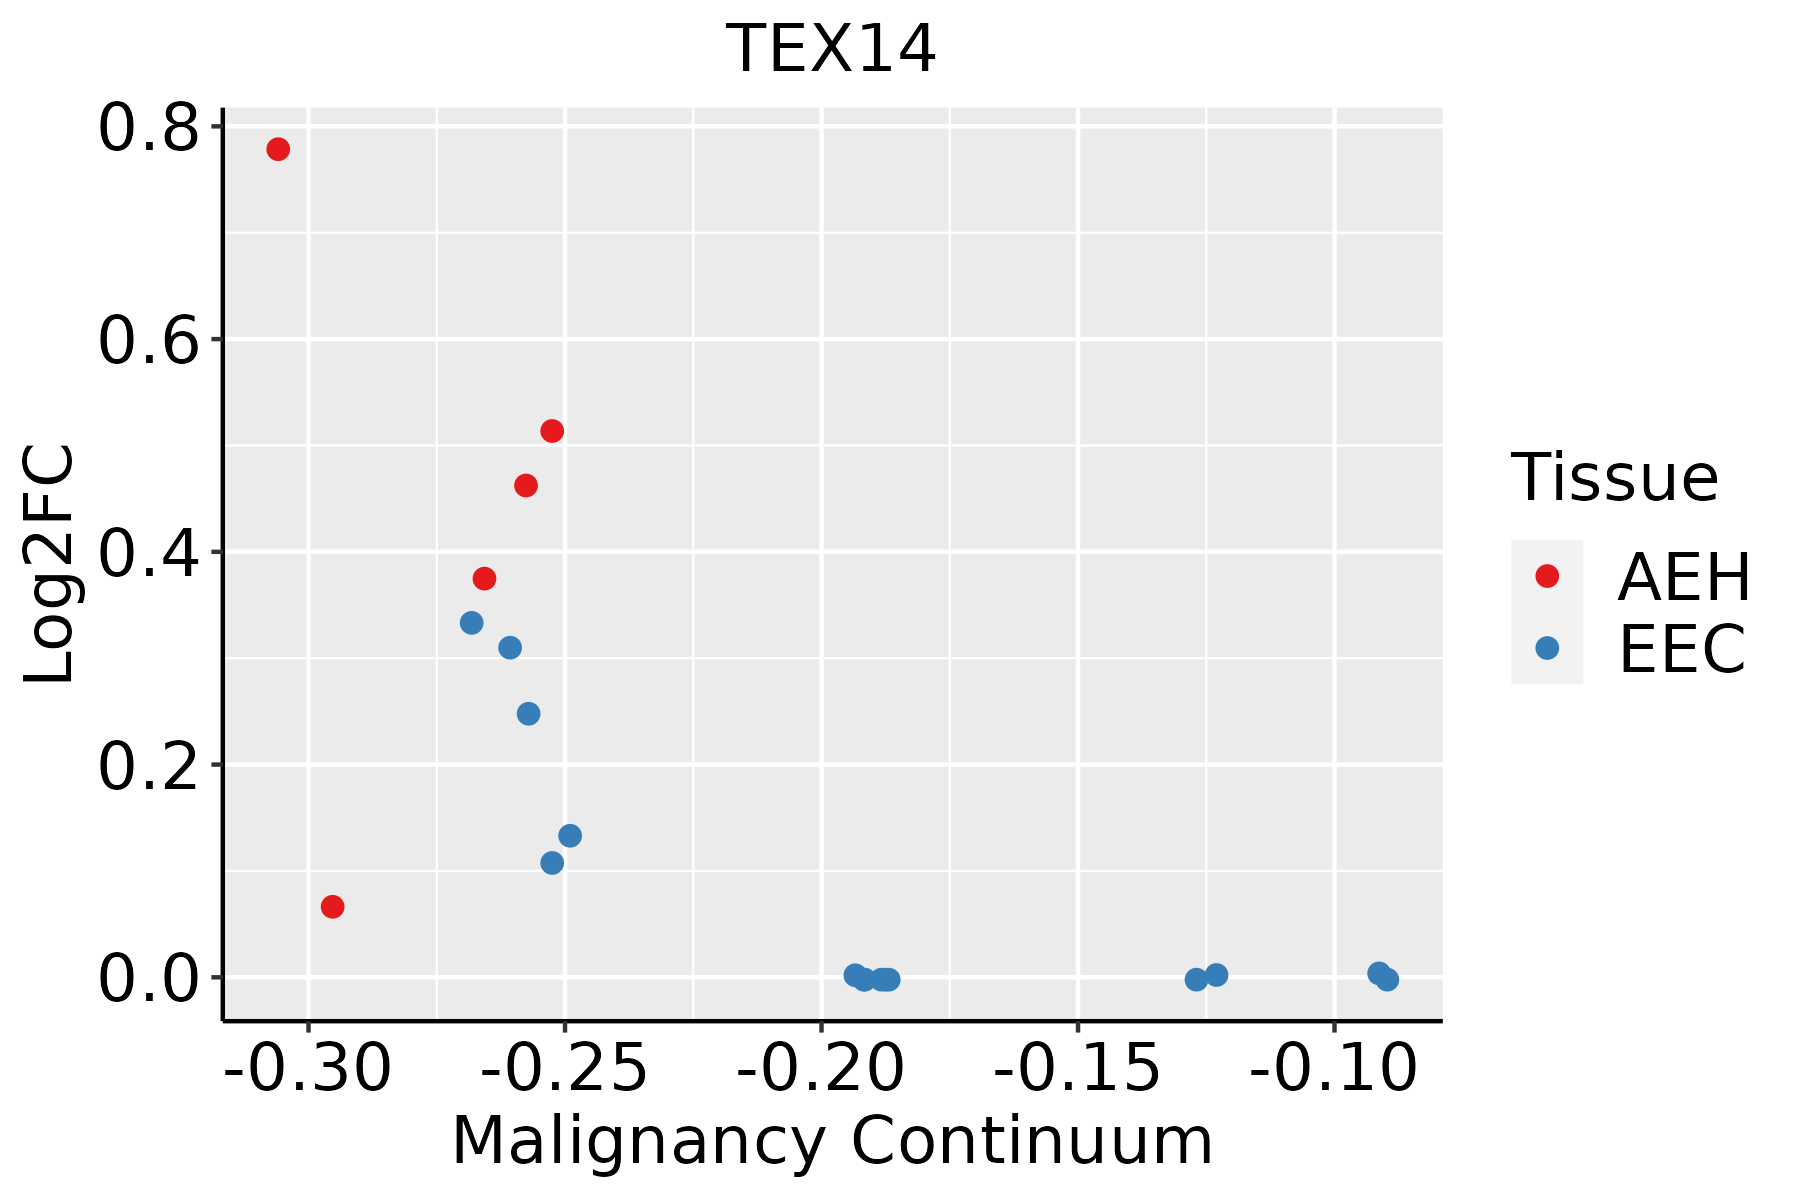 | AEH: Atypical endometrial hyperplasia |
| EEC: Endometrioid Cancer | ||
| GC | 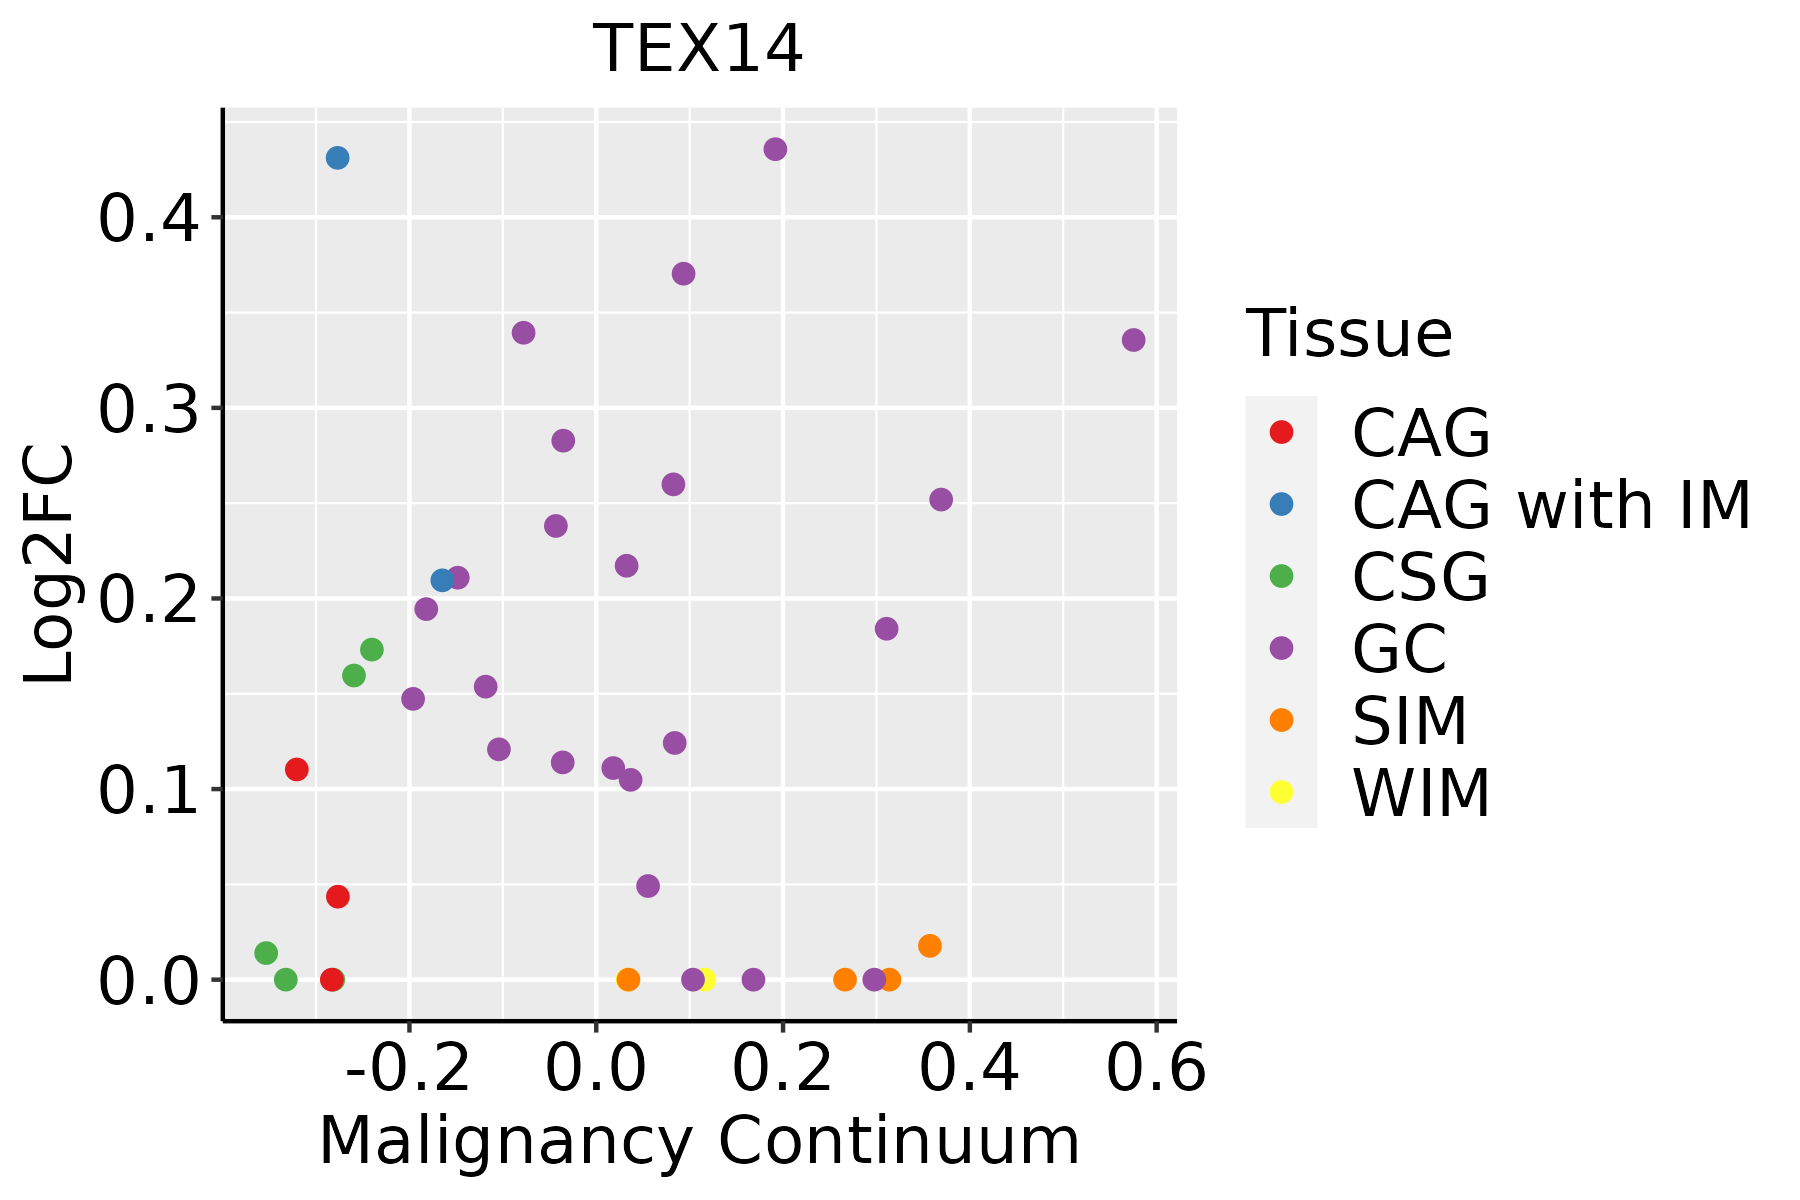 | CAG: Chronic atrophic gastritis |
| CAG with IM: Chronic atrophic gastritis with intestinal metaplasia | ||
| CSG: Chronic superficial gastritis | ||
| GC: Gastric cancer | ||
| SIM: Severe intestinal metaplasia | ||
| WIM: Wild intestinal metaplasia | ||
| Lung | 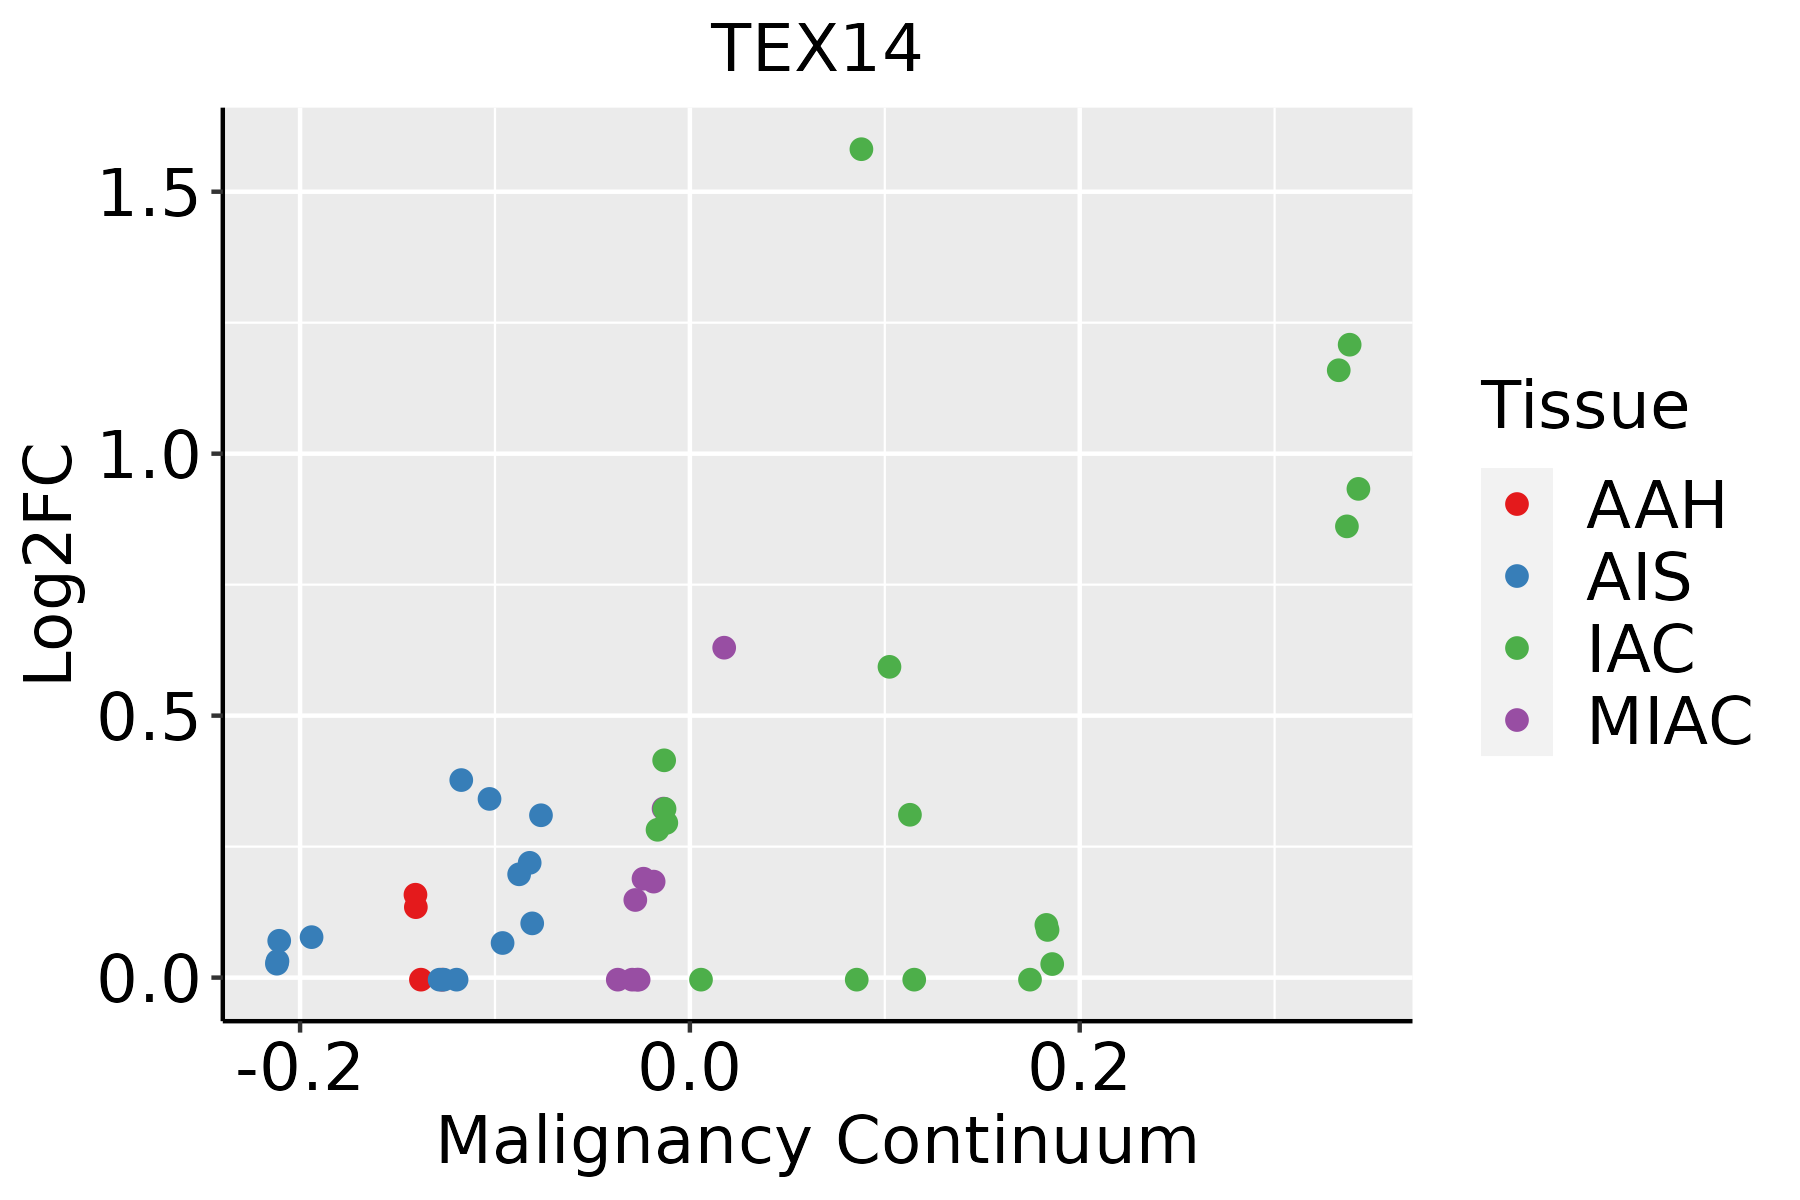 | AAH: Atypical adenomatous hyperplasia |
| AIS: Adenocarcinoma in situ | ||
| IAC: Invasive lung adenocarcinoma | ||
| MIA: Minimally invasive adenocarcinoma | ||
| Prostate |  | BPH: Benign Prostatic Hyperplasia |
| ∗log2FC in expression of this searched gene in stem-like cells from each diseased tissue sample relative to stem-like cells in normal samples in each tissue plotted against the malignancy continuum. Samples are colored based on if they are from different disease stage. |
Top |
Malignant transformation related pathway analysis |
| Find out the enriched GO biological processes and KEGG pathways involved in transition from healthy to precancer to cancer |
| Tissue | Disease Stage | Enriched GO biological Processes |
| Colorectum | AD |  |
| Colorectum | SER |  |
| Colorectum | MSS |  |
| Colorectum | MSI-H |  |
| Colorectum | FAP |  |
| ∗Top 15 enriched GO BP terms are showed in the bar plot of each disease state in each tissue. Each row represents a significant GO biological process which is colored according to the -log10(p.adjust). |
| Page: 1 2 3 4 5 6 7 8 9 |
| GO ID | Tissue | Disease Stage | Description | Gene Ratio | Bg Ratio | pvalue | p.adjust | Count |
| GO:005109816 | Endometrium | AEH | regulation of binding | 77/2100 | 363/18723 | 2.21e-08 | 1.31e-06 | 77 |
| GO:00009108 | Endometrium | AEH | cytokinesis | 40/2100 | 173/18723 | 6.01e-06 | 1.49e-04 | 40 |
| GO:004339310 | Endometrium | AEH | regulation of protein binding | 42/2100 | 196/18723 | 2.58e-05 | 4.86e-04 | 42 |
| GO:19908235 | Endometrium | AEH | response to leukemia inhibitory factor | 23/2100 | 95/18723 | 2.65e-04 | 3.09e-03 | 23 |
| GO:001063910 | Endometrium | AEH | negative regulation of organelle organization | 61/2100 | 348/18723 | 2.65e-04 | 3.09e-03 | 61 |
| GO:19908305 | Endometrium | AEH | cellular response to leukemia inhibitory factor | 22/2100 | 94/18723 | 5.89e-04 | 5.82e-03 | 22 |
| GO:00330446 | Endometrium | AEH | regulation of chromosome organization | 36/2100 | 187/18723 | 8.27e-04 | 7.73e-03 | 36 |
| GO:005110010 | Endometrium | AEH | negative regulation of binding | 32/2100 | 162/18723 | 1.00e-03 | 8.94e-03 | 32 |
| GO:00447726 | Endometrium | AEH | mitotic cell cycle phase transition | 67/2100 | 424/18723 | 2.37e-03 | 1.78e-02 | 67 |
| GO:00513022 | Endometrium | AEH | regulation of cell division | 32/2100 | 177/18723 | 4.33e-03 | 2.86e-02 | 32 |
| GO:00320917 | Endometrium | AEH | negative regulation of protein binding | 19/2100 | 94/18723 | 7.63e-03 | 4.31e-02 | 19 |
| GO:005109817 | Endometrium | EEC | regulation of binding | 83/2168 | 363/18723 | 6.72e-10 | 6.61e-08 | 83 |
| GO:004339315 | Endometrium | EEC | regulation of protein binding | 46/2168 | 196/18723 | 1.94e-06 | 5.80e-05 | 46 |
| GO:000091013 | Endometrium | EEC | cytokinesis | 40/2168 | 173/18723 | 1.29e-05 | 2.60e-04 | 40 |
| GO:199082313 | Endometrium | EEC | response to leukemia inhibitory factor | 25/2168 | 95/18723 | 5.72e-05 | 8.96e-04 | 25 |
| GO:001063915 | Endometrium | EEC | negative regulation of organelle organization | 64/2168 | 348/18723 | 1.15e-04 | 1.55e-03 | 64 |
| GO:199083012 | Endometrium | EEC | cellular response to leukemia inhibitory factor | 24/2168 | 94/18723 | 1.33e-04 | 1.74e-03 | 24 |
| GO:005110016 | Endometrium | EEC | negative regulation of binding | 35/2168 | 162/18723 | 1.85e-04 | 2.26e-03 | 35 |
| GO:003304413 | Endometrium | EEC | regulation of chromosome organization | 37/2168 | 187/18723 | 7.51e-04 | 7.05e-03 | 37 |
| GO:004477213 | Endometrium | EEC | mitotic cell cycle phase transition | 71/2168 | 424/18723 | 8.68e-04 | 7.97e-03 | 71 |
| Page: 1 2 3 4 |
| Pathway ID | Tissue | Disease Stage | Description | Gene Ratio | Bg Ratio | pvalue | p.adjust | qvalue | Count |
| Page: 1 |
Top |
Cell-cell communication analysis |
| Identification of potential cell-cell interactions between two cell types and their ligand-receptor pairs for different disease states |
| Ligand | Receptor | LRpair | Pathway | Tissue | Disease Stage |
| Page: 1 |
Top |
Single-cell gene regulatory network inference analysis |
| Find out the significant the regulons (TFs) and the target genes of each regulon across cell types for different disease states |
| TF | Cell Type | Tissue | Disease Stage | Target Gene | RSS | Regulon Activity |
| ∗The dot plots of a searched regulon are shown for all cell subpopulations in each disease state of each tissue based on the regulon specific score inferred using pySCENIC and by calculating the average expression. |
| Page: 1 |
Top |
Somatic mutation of malignant transformation related genes |
| Annotation of somatic variants for genes involved in malignant transformation |
| Hugo Symbol | Variant Class | Variant Classification | dbSNP RS | HGVSc | HGVSp | HGVSp Short | SWISSPROT | BIOTYPE | SIFT | PolyPhen | Tumor Sample Barcode | Tissue | Histology | Sex | Age | Stage | Therapy Types | Drugs | Outcome |
| TEX14 | SNV | Missense_Mutation | c.3887N>T | p.Ser1296Phe | p.S1296F | Q8IWB6 | protein_coding | tolerated(0.12) | possibly_damaging(0.771) | TCGA-A2-A4RW-01 | Breast | breast invasive carcinoma | Female | <65 | III/IV | Unknown | Unknown | SD | |
| TEX14 | SNV | Missense_Mutation | rs780914610 | c.4363N>C | p.Glu1455Gln | p.E1455Q | Q8IWB6 | protein_coding | deleterious(0.02) | benign(0.03) | TCGA-A8-A08R-01 | Breast | breast invasive carcinoma | Female | <65 | I/II | Unknown | Unknown | SD |
| TEX14 | SNV | Missense_Mutation | c.2157N>C | p.Lys719Asn | p.K719N | Q8IWB6 | protein_coding | tolerated(0.13) | benign(0.157) | TCGA-AC-A23H-01 | Breast | breast invasive carcinoma | Female | >=65 | I/II | Unknown | Unknown | PD | |
| TEX14 | SNV | Missense_Mutation | rs773123909 | c.908N>A | p.Arg303Gln | p.R303Q | Q8IWB6 | protein_coding | deleterious(0) | probably_damaging(0.97) | TCGA-AQ-A04H-01 | Breast | breast invasive carcinoma | Female | <65 | III/IV | Chemotherapy | taxotere | SD |
| TEX14 | SNV | Missense_Mutation | c.254N>C | p.Arg85Pro | p.R85P | Q8IWB6 | protein_coding | deleterious(0) | probably_damaging(1) | TCGA-B6-A0I8-01 | Breast | breast invasive carcinoma | Female | <65 | I/II | Unknown | Unknown | PD | |
| TEX14 | SNV | Missense_Mutation | c.1415A>T | p.Asn472Ile | p.N472I | Q8IWB6 | protein_coding | deleterious(0) | possibly_damaging(0.544) | TCGA-B6-A0RU-01 | Breast | breast invasive carcinoma | Female | <65 | I/II | Unknown | Unknown | PD | |
| TEX14 | SNV | Missense_Mutation | rs765166387 | c.3530C>T | p.Thr1177Met | p.T1177M | Q8IWB6 | protein_coding | deleterious(0.02) | benign(0.056) | TCGA-BH-A0RX-01 | Breast | breast invasive carcinoma | Female | <65 | I/II | Chemotherapy | fluorouracil | SD |
| TEX14 | SNV | Missense_Mutation | c.1429N>A | p.Asp477Asn | p.D477N | Q8IWB6 | protein_coding | deleterious(0) | probably_damaging(0.993) | TCGA-BH-A18K-01 | Breast | breast invasive carcinoma | Female | <65 | I/II | Unknown | Unknown | PD | |
| TEX14 | SNV | Missense_Mutation | rs767891713 | c.883N>A | p.Glu295Lys | p.E295K | Q8IWB6 | protein_coding | deleterious(0) | probably_damaging(0.999) | TCGA-PL-A8LZ-01 | Breast | breast invasive carcinoma | Female | <65 | III/IV | Chemotherapy | paclitaxel | SD |
| TEX14 | insertion | Nonsense_Mutation | novel | c.1770_1771insCCTTGCCTGGCCTAGACTCTGG | p.Cys591ProfsTer5 | p.C591Pfs*5 | Q8IWB6 | protein_coding | TCGA-A2-A04Y-01 | Breast | breast invasive carcinoma | Female | <65 | I/II | Chemotherapy | cytoxan | SD |
| Page: 1 2 3 4 5 6 7 8 9 10 11 12 13 14 15 16 17 |
Top |
Related drugs of malignant transformation related genes |
| Identification of chemicals and drugs interact with genes involved in malignant transfromation |
| (DGIdb 4.0) |
| Entrez ID | Symbol | Category | Interaction Types | Drug Claim Name | Drug Name | PMIDs |
| Page: 1 |

Copyright 2023-Present -The University of Texas Health Science Center at Houston |