
|
|||||
|
 | |
| |
| |
| |
| |
| |
|
Gene: TET3 |
Gene summary for TET3 |
| Gene information | Species | Human | Gene symbol | TET3 | Gene ID | 200424 |
| Gene name | tet methylcytosine dioxygenase 3 | |
| Gene Alias | BEFAHRS | |
| Cytomap | 2p13.1 | |
| Gene Type | protein-coding | GO ID | GO:0006139 | UniProtAcc | O43151 |
Top |
Malignant transformation analysis |
| Identification of the aberrant gene expression in precancerous and cancerous lesions by comparing the gene expression of stem-like cells in diseased tissues with normal stem cells |
| Entrez ID | Symbol | Replicates | Species | Organ | Tissue | Adj P-value | Log2FC | Malignancy |
| 200424 | TET3 | CCI_1 | Human | Cervix | CC | 3.90e-08 | 9.19e-01 | 0.528 |
| 200424 | TET3 | CCI_2 | Human | Cervix | CC | 1.36e-05 | 6.78e-01 | 0.5249 |
| 200424 | TET3 | CCI_3 | Human | Cervix | CC | 5.03e-15 | 7.14e-01 | 0.516 |
| Page: 1 |
| Tissue | Expression Dynamics | Abbreviation |
| Cervix | 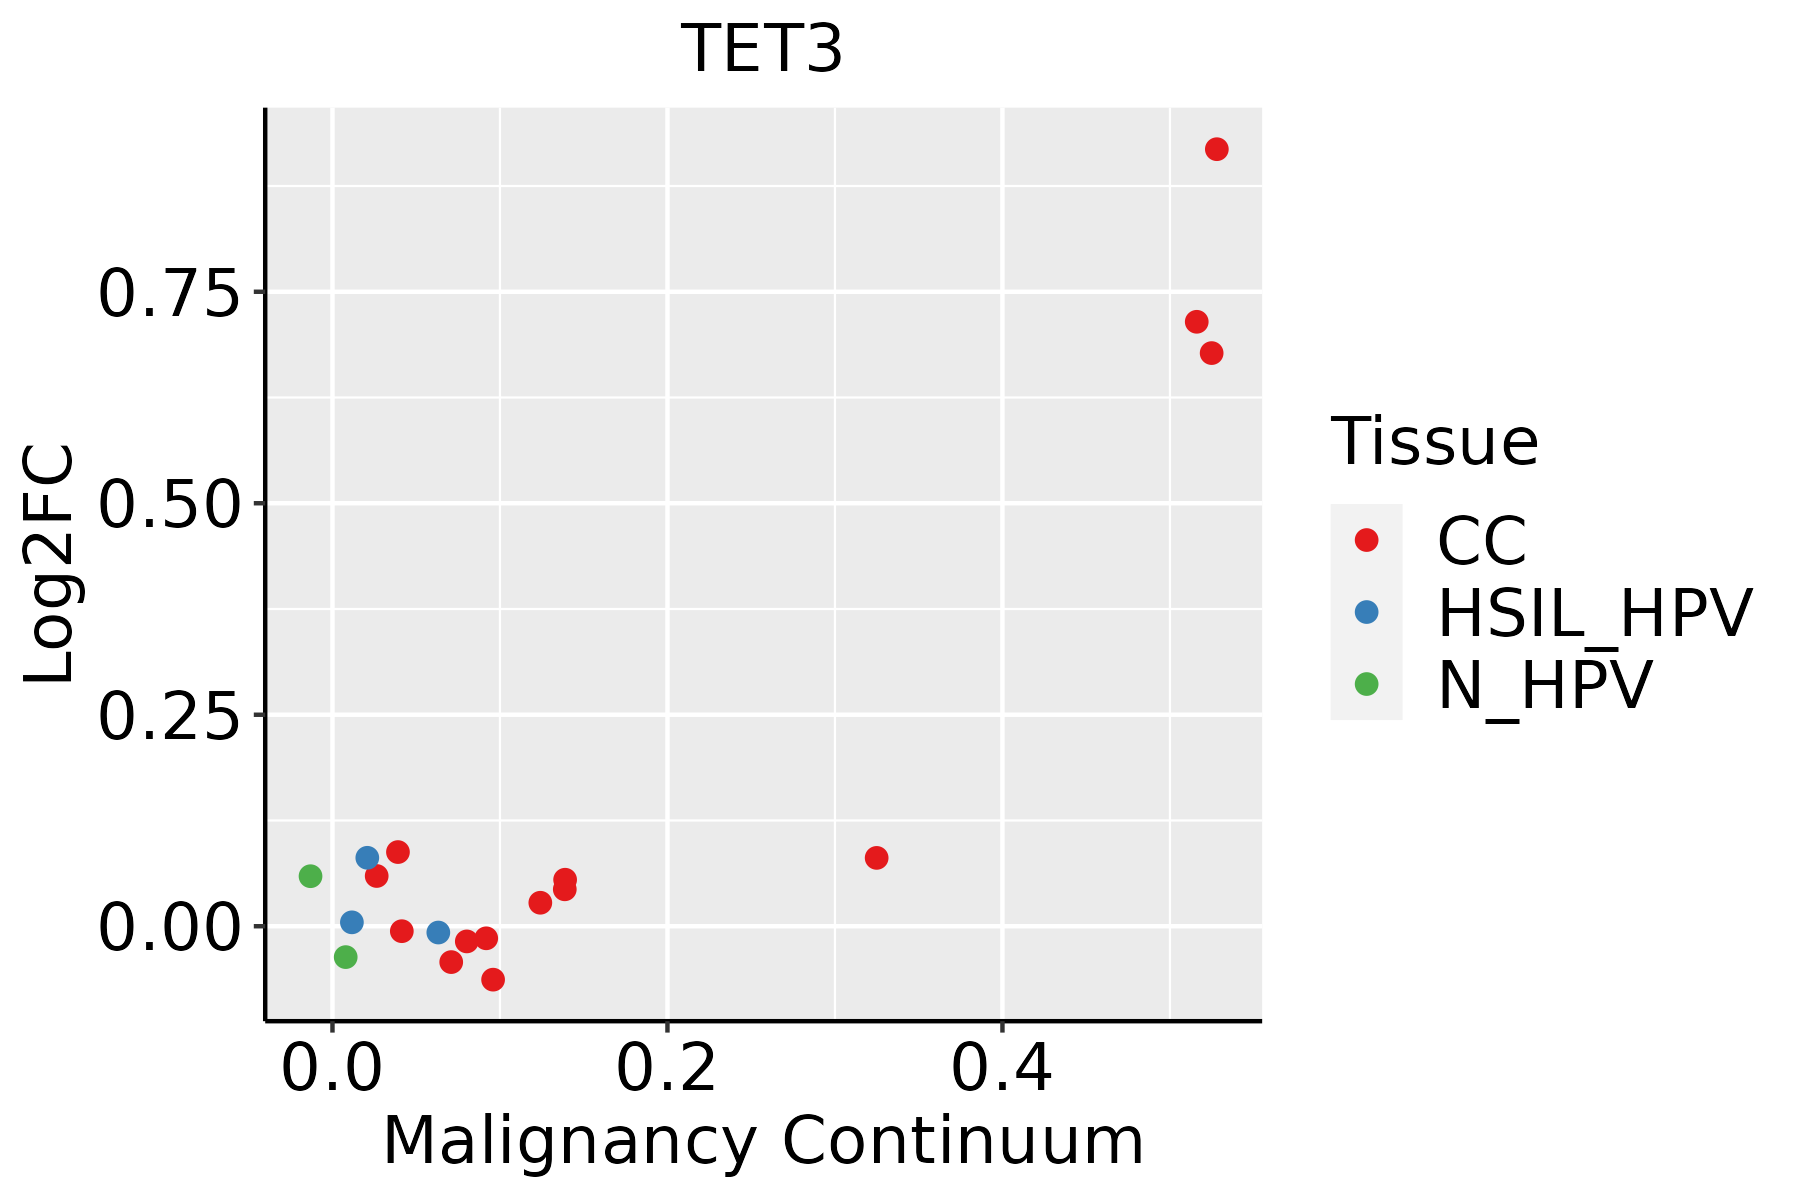 | CC: Cervix cancer |
| HSIL_HPV: HPV-infected high-grade squamous intraepithelial lesions | ||
| N_HPV: HPV-infected normal cervix |
| ∗log2FC in expression of this searched gene in stem-like cells from each diseased tissue sample relative to stem-like cells in normal samples in each tissue plotted against the malignancy continuum. Samples are colored based on if they are from different disease stage. |
Top |
Malignant transformation related pathway analysis |
| Find out the enriched GO biological processes and KEGG pathways involved in transition from healthy to precancer to cancer |
| Tissue | Disease Stage | Enriched GO biological Processes |
| Colorectum | AD |  |
| Colorectum | SER |  |
| Colorectum | MSS |  |
| Colorectum | MSI-H |  |
| Colorectum | FAP |  |
| ∗Top 15 enriched GO BP terms are showed in the bar plot of each disease state in each tissue. Each row represents a significant GO biological process which is colored according to the -log10(p.adjust). |
| Page: 1 2 3 4 5 6 7 8 9 |
| GO ID | Tissue | Disease Stage | Description | Gene Ratio | Bg Ratio | pvalue | p.adjust | Count |
| GO:00165705 | Cervix | CC | histone modification | 84/2311 | 463/18723 | 1.70e-04 | 2.01e-03 | 84 |
| GO:00467008 | Cervix | CC | heterocycle catabolic process | 80/2311 | 445/18723 | 3.23e-04 | 3.42e-03 | 80 |
| GO:00349685 | Cervix | CC | histone lysine methylation | 27/2311 | 115/18723 | 6.61e-04 | 6.09e-03 | 27 |
| GO:00442709 | Cervix | CC | cellular nitrogen compound catabolic process | 79/2311 | 451/18723 | 7.80e-04 | 6.91e-03 | 79 |
| GO:00165715 | Cervix | CC | histone methylation | 30/2311 | 141/18723 | 1.88e-03 | 1.39e-02 | 30 |
| GO:00194398 | Cervix | CC | aromatic compound catabolic process | 79/2311 | 467/18723 | 2.14e-03 | 1.54e-02 | 79 |
| GO:00180224 | Cervix | CC | peptidyl-lysine methylation | 28/2311 | 131/18723 | 2.43e-03 | 1.71e-02 | 28 |
| GO:00064795 | Cervix | CC | protein methylation | 36/2311 | 181/18723 | 2.46e-03 | 1.71e-02 | 36 |
| GO:00082135 | Cervix | CC | protein alkylation | 36/2311 | 181/18723 | 2.46e-03 | 1.71e-02 | 36 |
| GO:19013618 | Cervix | CC | organic cyclic compound catabolic process | 80/2311 | 495/18723 | 6.77e-03 | 3.72e-02 | 80 |
| GO:00182054 | Cervix | CC | peptidyl-lysine modification | 62/2311 | 376/18723 | 1.04e-02 | 4.97e-02 | 62 |
| Page: 1 |
| Pathway ID | Tissue | Disease Stage | Description | Gene Ratio | Bg Ratio | pvalue | p.adjust | qvalue | Count |
| Page: 1 |
Top |
Cell-cell communication analysis |
| Identification of potential cell-cell interactions between two cell types and their ligand-receptor pairs for different disease states |
| Ligand | Receptor | LRpair | Pathway | Tissue | Disease Stage |
| Page: 1 |
Top |
Single-cell gene regulatory network inference analysis |
| Find out the significant the regulons (TFs) and the target genes of each regulon across cell types for different disease states |
| TF | Cell Type | Tissue | Disease Stage | Target Gene | RSS | Regulon Activity |
| ∗The dot plots of a searched regulon are shown for all cell subpopulations in each disease state of each tissue based on the regulon specific score inferred using pySCENIC and by calculating the average expression. |
| Page: 1 |
Top |
Somatic mutation of malignant transformation related genes |
| Annotation of somatic variants for genes involved in malignant transformation |
| Hugo Symbol | Variant Class | Variant Classification | dbSNP RS | HGVSc | HGVSp | HGVSp Short | SWISSPROT | BIOTYPE | SIFT | PolyPhen | Tumor Sample Barcode | Tissue | Histology | Sex | Age | Stage | Therapy Types | Drugs | Outcome |
| TET3 | SNV | Missense_Mutation | novel | c.1510T>A | p.Ser504Thr | p.S504T | O43151 | protein_coding | deleterious(0.04) | benign(0.236) | TCGA-A1-A0SO-01 | Breast | breast invasive carcinoma | Female | >=65 | I/II | Chemotherapy | SD | |
| TET3 | SNV | Missense_Mutation | novel | c.35N>G | p.Pro12Arg | p.P12R | O43151 | protein_coding | deleterious_low_confidence(0.05) | benign(0.365) | TCGA-A7-A6VY-01 | Breast | breast invasive carcinoma | Female | <65 | I/II | Chemotherapy | cyclophosphamide | CR |
| TET3 | SNV | Missense_Mutation | c.3301G>C | p.Val1101Leu | p.V1101L | O43151 | protein_coding | deleterious(0) | benign(0.127) | TCGA-A8-A08R-01 | Breast | breast invasive carcinoma | Female | <65 | I/II | Unknown | Unknown | SD | |
| TET3 | SNV | Missense_Mutation | c.664N>C | p.Glu222Gln | p.E222Q | O43151 | protein_coding | deleterious(0.01) | probably_damaging(0.999) | TCGA-AC-A23H-01 | Breast | breast invasive carcinoma | Female | >=65 | I/II | Unknown | Unknown | PD | |
| TET3 | SNV | Missense_Mutation | c.1130N>A | p.Thr377Asn | p.T377N | O43151 | protein_coding | tolerated(0.32) | benign(0.127) | TCGA-AO-A0J6-01 | Breast | breast invasive carcinoma | Female | <65 | I/II | Chemotherapy | doxorubicin | SD | |
| TET3 | SNV | Missense_Mutation | c.1979N>T | p.Pro660Leu | p.P660L | O43151 | protein_coding | tolerated(0.12) | benign(0.127) | TCGA-B6-A0RS-01 | Breast | breast invasive carcinoma | Female | <65 | I/II | Unknown | Unknown | PD | |
| TET3 | SNV | Missense_Mutation | novel | c.3848C>G | p.Ser1283Cys | p.S1283C | O43151 | protein_coding | deleterious(0.02) | possibly_damaging(0.794) | TCGA-E2-A574-01 | Breast | breast invasive carcinoma | Female | <65 | I/II | Chemotherapy | adriamycin | SD |
| TET3 | insertion | Frame_Shift_Ins | novel | c.3978_3979insTGGGATTACAGGCGCATGCCACCACGCC | p.Ser1327TrpfsTer19 | p.S1327Wfs*19 | O43151 | protein_coding | TCGA-A2-A0CU-01 | Breast | breast invasive carcinoma | Female | >=65 | I/II | Hormone Therapy | tamoxiphen | SD | ||
| TET3 | deletion | Frame_Shift_Del | novel | c.3039+1delG | O43151 | protein_coding | TCGA-D8-A27V-01 | Breast | breast invasive carcinoma | Female | <65 | I/II | Hormone Therapy | tamoxiphen | SD | ||||
| TET3 | SNV | Missense_Mutation | novel | c.2725C>T | p.Arg909Trp | p.R909W | O43151 | protein_coding | deleterious(0) | probably_damaging(1) | TCGA-2W-A8YY-01 | Cervix | cervical & endocervical cancer | Female | <65 | I/II | Chemotherapy | cisplatin | CR |
| Page: 1 2 3 4 5 6 7 8 9 10 11 12 13 14 15 16 17 18 |
Top |
Related drugs of malignant transformation related genes |
| Identification of chemicals and drugs interact with genes involved in malignant transfromation |
| (DGIdb 4.0) |
| Entrez ID | Symbol | Category | Interaction Types | Drug Claim Name | Drug Name | PMIDs |
| Page: 1 |

Copyright 2023-Present -The University of Texas Health Science Center at Houston |