
|
|||||
|
 | |
| |
| |
| |
| |
| |
|
Gene: TESK1 |
Gene summary for TESK1 |
| Gene information | Species | Human | Gene symbol | TESK1 | Gene ID | 7016 |
| Gene name | testis associated actin remodelling kinase 1 | |
| Gene Alias | TESK1 | |
| Cytomap | 9p13.3 | |
| Gene Type | protein-coding | GO ID | GO:0000003 | UniProtAcc | Q15569 |
Top |
Malignant transformation analysis |
| Identification of the aberrant gene expression in precancerous and cancerous lesions by comparing the gene expression of stem-like cells in diseased tissues with normal stem cells |
| Entrez ID | Symbol | Replicates | Species | Organ | Tissue | Adj P-value | Log2FC | Malignancy |
| 7016 | TESK1 | HCC1_Meng | Human | Liver | HCC | 3.93e-22 | 2.88e-02 | 0.0246 |
| 7016 | TESK1 | HCC2 | Human | Liver | HCC | 8.26e-09 | 2.99e+00 | 0.5341 |
| 7016 | TESK1 | S027 | Human | Liver | HCC | 4.68e-10 | 6.02e-01 | 0.2446 |
| 7016 | TESK1 | S028 | Human | Liver | HCC | 7.48e-15 | 6.23e-01 | 0.2503 |
| 7016 | TESK1 | S029 | Human | Liver | HCC | 2.19e-13 | 6.34e-01 | 0.2581 |
| 7016 | TESK1 | C21 | Human | Oral cavity | OSCC | 5.46e-07 | 3.20e-01 | 0.2678 |
| 7016 | TESK1 | C30 | Human | Oral cavity | OSCC | 5.13e-21 | 9.75e-01 | 0.3055 |
| 7016 | TESK1 | C38 | Human | Oral cavity | OSCC | 1.78e-09 | 9.30e-01 | 0.172 |
| 7016 | TESK1 | C06 | Human | Oral cavity | OSCC | 1.09e-02 | 8.54e-01 | 0.2699 |
| 7016 | TESK1 | C08 | Human | Oral cavity | OSCC | 7.10e-03 | 1.50e-01 | 0.1919 |
| 7016 | TESK1 | SYSMH1 | Human | Oral cavity | OSCC | 5.33e-13 | 2.66e-01 | 0.1127 |
| 7016 | TESK1 | SYSMH2 | Human | Oral cavity | OSCC | 3.13e-04 | 2.30e-01 | 0.2326 |
| 7016 | TESK1 | SYSMH3 | Human | Oral cavity | OSCC | 1.48e-11 | 2.03e-01 | 0.2442 |
| Page: 1 |
| Tissue | Expression Dynamics | Abbreviation |
| Liver |  | HCC: Hepatocellular carcinoma |
| NAFLD: Non-alcoholic fatty liver disease | ||
| Oral Cavity | 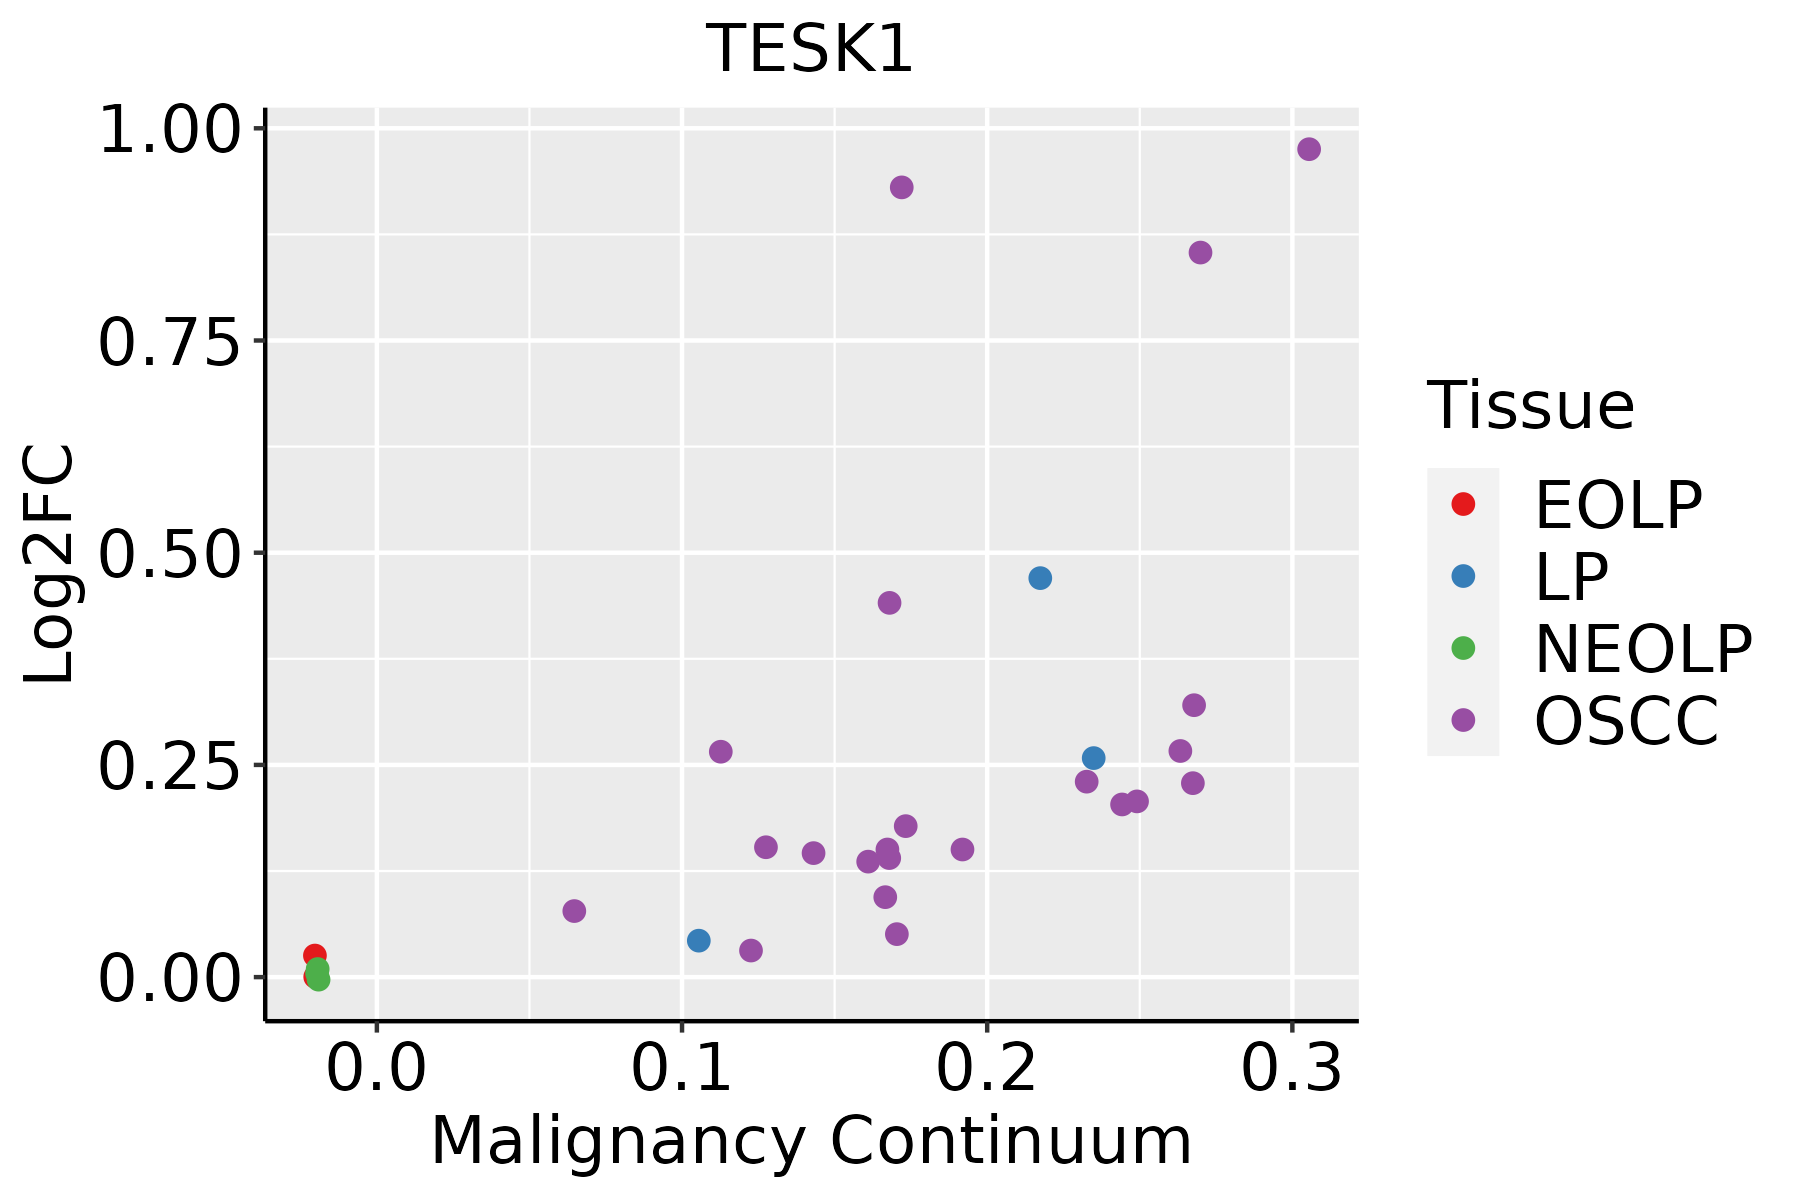 | EOLP: Erosive Oral lichen planus |
| LP: leukoplakia | ||
| NEOLP: Non-erosive oral lichen planus | ||
| OSCC: Oral squamous cell carcinoma |
| ∗log2FC in expression of this searched gene in stem-like cells from each diseased tissue sample relative to stem-like cells in normal samples in each tissue plotted against the malignancy continuum. Samples are colored based on if they are from different disease stage. |
Top |
Malignant transformation related pathway analysis |
| Find out the enriched GO biological processes and KEGG pathways involved in transition from healthy to precancer to cancer |
| Tissue | Disease Stage | Enriched GO biological Processes |
| Colorectum | AD |  |
| Colorectum | SER |  |
| Colorectum | MSS |  |
| Colorectum | MSI-H |  |
| Colorectum | FAP |  |
| ∗Top 15 enriched GO BP terms are showed in the bar plot of each disease state in each tissue. Each row represents a significant GO biological process which is colored according to the -log10(p.adjust). |
| Page: 1 2 3 4 5 6 7 8 9 |
| GO ID | Tissue | Disease Stage | Description | Gene Ratio | Bg Ratio | pvalue | p.adjust | Count |
| GO:190382922 | Liver | HCC | positive regulation of cellular protein localization | 199/7958 | 276/18723 | 1.15e-23 | 2.62e-21 | 199 |
| GO:003450421 | Liver | HCC | protein localization to nucleus | 194/7958 | 290/18723 | 2.84e-17 | 2.85e-15 | 194 |
| GO:001056322 | Liver | HCC | negative regulation of phosphorus metabolic process | 259/7958 | 442/18723 | 4.29e-12 | 1.92e-10 | 259 |
| GO:004593622 | Liver | HCC | negative regulation of phosphate metabolic process | 258/7958 | 441/18723 | 6.00e-12 | 2.60e-10 | 258 |
| GO:004232622 | Liver | HCC | negative regulation of phosphorylation | 227/7958 | 385/18723 | 3.98e-11 | 1.52e-09 | 227 |
| GO:002260422 | Liver | HCC | regulation of cell morphogenesis | 188/7958 | 309/18723 | 4.84e-11 | 1.82e-09 | 188 |
| GO:190018212 | Liver | HCC | positive regulation of protein localization to nucleus | 67/7958 | 87/18723 | 5.43e-11 | 2.00e-09 | 67 |
| GO:005134822 | Liver | HCC | negative regulation of transferase activity | 166/7958 | 268/18723 | 8.97e-11 | 3.18e-09 | 166 |
| GO:190018012 | Liver | HCC | regulation of protein localization to nucleus | 95/7958 | 136/18723 | 9.26e-11 | 3.26e-09 | 95 |
| GO:190290322 | Liver | HCC | regulation of supramolecular fiber organization | 224/7958 | 383/18723 | 1.54e-10 | 5.33e-09 | 224 |
| GO:000701522 | Liver | HCC | actin filament organization | 252/7958 | 442/18723 | 3.83e-10 | 1.25e-08 | 252 |
| GO:005165621 | Liver | HCC | establishment of organelle localization | 226/7958 | 390/18723 | 4.15e-10 | 1.34e-08 | 226 |
| GO:001063912 | Liver | HCC | negative regulation of organelle organization | 204/7958 | 348/18723 | 7.67e-10 | 2.37e-08 | 204 |
| GO:190290522 | Liver | HCC | positive regulation of supramolecular fiber organization | 131/7958 | 209/18723 | 2.85e-09 | 7.69e-08 | 131 |
| GO:003367322 | Liver | HCC | negative regulation of kinase activity | 144/7958 | 237/18723 | 9.76e-09 | 2.45e-07 | 144 |
| GO:005149522 | Liver | HCC | positive regulation of cytoskeleton organization | 138/7958 | 226/18723 | 1.26e-08 | 3.12e-07 | 138 |
| GO:000193322 | Liver | HCC | negative regulation of protein phosphorylation | 196/7958 | 342/18723 | 1.95e-08 | 4.63e-07 | 196 |
| GO:005165021 | Liver | HCC | establishment of vesicle localization | 103/7958 | 161/18723 | 2.94e-08 | 6.69e-07 | 103 |
| GO:003297022 | Liver | HCC | regulation of actin filament-based process | 222/7958 | 397/18723 | 3.81e-08 | 8.30e-07 | 222 |
| GO:003295622 | Liver | HCC | regulation of actin cytoskeleton organization | 202/7958 | 358/18723 | 6.18e-08 | 1.29e-06 | 202 |
| Page: 1 2 3 4 5 6 |
| Pathway ID | Tissue | Disease Stage | Description | Gene Ratio | Bg Ratio | pvalue | p.adjust | qvalue | Count |
| Page: 1 |
Top |
Cell-cell communication analysis |
| Identification of potential cell-cell interactions between two cell types and their ligand-receptor pairs for different disease states |
| Ligand | Receptor | LRpair | Pathway | Tissue | Disease Stage |
| Page: 1 |
Top |
Single-cell gene regulatory network inference analysis |
| Find out the significant the regulons (TFs) and the target genes of each regulon across cell types for different disease states |
| TF | Cell Type | Tissue | Disease Stage | Target Gene | RSS | Regulon Activity |
| ∗The dot plots of a searched regulon are shown for all cell subpopulations in each disease state of each tissue based on the regulon specific score inferred using pySCENIC and by calculating the average expression. |
| Page: 1 |
Top |
Somatic mutation of malignant transformation related genes |
| Annotation of somatic variants for genes involved in malignant transformation |
| Hugo Symbol | Variant Class | Variant Classification | dbSNP RS | HGVSc | HGVSp | HGVSp Short | SWISSPROT | BIOTYPE | SIFT | PolyPhen | Tumor Sample Barcode | Tissue | Histology | Sex | Age | Stage | Therapy Types | Drugs | Outcome |
| TESK1 | SNV | Missense_Mutation | rs760778879 | c.1121A>G | p.Asn374Ser | p.N374S | Q15569 | protein_coding | tolerated(0.74) | benign(0.001) | TCGA-EW-A1J2-01 | Breast | breast invasive carcinoma | Female | <65 | I/II | Chemotherapy | taxotere | SD |
| TESK1 | SNV | Missense_Mutation | c.787N>T | p.Arg263Cys | p.R263C | Q15569 | protein_coding | deleterious(0.01) | probably_damaging(0.999) | TCGA-C5-A1ME-01 | Cervix | cervical & endocervical cancer | Female | <65 | I/II | Unknown | Unknown | SD | |
| TESK1 | SNV | Missense_Mutation | novel | c.772N>A | p.Pro258Thr | p.P258T | Q15569 | protein_coding | deleterious(0.01) | probably_damaging(1) | TCGA-VS-A94X-01 | Cervix | cervical & endocervical cancer | Female | <65 | I/II | Chemotherapy | cisplatin | PD |
| TESK1 | SNV | Missense_Mutation | rs201230682 | c.1687N>A | p.Asp563Asn | p.D563N | Q15569 | protein_coding | deleterious(0) | benign(0.034) | TCGA-A6-6653-01 | Colorectum | colon adenocarcinoma | Male | >=65 | I/II | Unknown | Unknown | SD |
| TESK1 | SNV | Missense_Mutation | c.902N>A | p.Arg301His | p.R301H | Q15569 | protein_coding | deleterious(0) | probably_damaging(1) | TCGA-A6-A566-01 | Colorectum | colon adenocarcinoma | Female | <65 | III/IV | Chemotherapy | oxaliplatin | PD | |
| TESK1 | SNV | Missense_Mutation | c.523N>A | p.Asp175Asn | p.D175N | Q15569 | protein_coding | deleterious(0) | probably_damaging(1) | TCGA-AA-3672-01 | Colorectum | colon adenocarcinoma | Female | >=65 | III/IV | Unknown | Unknown | SD | |
| TESK1 | SNV | Missense_Mutation | novel | c.1559N>T | p.Ala520Val | p.A520V | Q15569 | protein_coding | tolerated(0.53) | benign(0.098) | TCGA-A5-A1OF-01 | Endometrium | uterine corpus endometrioid carcinoma | Female | <65 | I/II | Unknown | Unknown | SD |
| TESK1 | SNV | Missense_Mutation | novel | c.1159N>A | p.Leu387Ile | p.L387I | Q15569 | protein_coding | deleterious(0) | probably_damaging(0.996) | TCGA-AP-A059-01 | Endometrium | uterine corpus endometrioid carcinoma | Female | >=65 | I/II | Unknown | Unknown | SD |
| TESK1 | SNV | Missense_Mutation | rs774630088 | c.1448N>T | p.Ala483Val | p.A483V | Q15569 | protein_coding | tolerated(0.31) | benign(0) | TCGA-AX-A0J1-01 | Endometrium | uterine corpus endometrioid carcinoma | Female | >=65 | I/II | Unknown | Unknown | SD |
| TESK1 | SNV | Missense_Mutation | c.574N>A | p.Ala192Thr | p.A192T | Q15569 | protein_coding | deleterious(0) | probably_damaging(0.932) | TCGA-AX-A1CE-01 | Endometrium | uterine corpus endometrioid carcinoma | Female | <65 | I/II | Unspecific | Paclitaxel | SD |
| Page: 1 2 3 4 |
Top |
Related drugs of malignant transformation related genes |
| Identification of chemicals and drugs interact with genes involved in malignant transfromation |
| (DGIdb 4.0) |
| Entrez ID | Symbol | Category | Interaction Types | Drug Claim Name | Drug Name | PMIDs |
| 7016 | TESK1 | KINASE, DRUGGABLE GENOME, TYROSINE KINASE, SERINE THREONINE KINASE, ENZYME | inhibitor | 249565797 | ||
| 7016 | TESK1 | KINASE, DRUGGABLE GENOME, TYROSINE KINASE, SERINE THREONINE KINASE, ENZYME | inhibitor | 249565799 | ||
| 7016 | TESK1 | KINASE, DRUGGABLE GENOME, TYROSINE KINASE, SERINE THREONINE KINASE, ENZYME | inhibitor | 249565798 |
| Page: 1 |

Copyright 2023-Present -The University of Texas Health Science Center at Houston |