
|
|||||
|
 | |
| |
| |
| |
| |
| |
|
Gene: TESC |
Gene summary for TESC |
| Gene information | Species | Human | Gene symbol | TESC | Gene ID | 54997 |
| Gene name | tescalcin | |
| Gene Alias | CHP3 | |
| Cytomap | 12q24.22 | |
| Gene Type | protein-coding | GO ID | GO:0000003 | UniProtAcc | Q96BS2 |
Top |
Malignant transformation analysis |
| Identification of the aberrant gene expression in precancerous and cancerous lesions by comparing the gene expression of stem-like cells in diseased tissues with normal stem cells |
| Entrez ID | Symbol | Replicates | Species | Organ | Tissue | Adj P-value | Log2FC | Malignancy |
| 54997 | TESC | HTA11_2487_2000001011 | Human | Colorectum | SER | 4.32e-13 | 3.95e-01 | -0.1808 |
| 54997 | TESC | HTA11_3361_2000001011 | Human | Colorectum | AD | 1.34e-03 | 2.13e-01 | -0.1207 |
| 54997 | TESC | HTA11_696_2000001011 | Human | Colorectum | AD | 5.56e-16 | 4.80e-01 | -0.1464 |
| 54997 | TESC | HTA11_1391_2000001011 | Human | Colorectum | AD | 2.44e-13 | 3.93e-01 | -0.059 |
| 54997 | TESC | HTA11_866_3004761011 | Human | Colorectum | AD | 2.64e-23 | 5.89e-01 | 0.096 |
| 54997 | TESC | HTA11_4255_2000001011 | Human | Colorectum | SER | 1.84e-10 | 6.30e-01 | 0.0446 |
| 54997 | TESC | HTA11_8622_2000001021 | Human | Colorectum | SER | 1.04e-19 | 7.76e-01 | 0.0528 |
| 54997 | TESC | HTA11_10711_2000001011 | Human | Colorectum | AD | 2.15e-02 | 2.02e-01 | 0.0338 |
| 54997 | TESC | HTA11_6818_2000001021 | Human | Colorectum | AD | 9.99e-41 | 1.31e+00 | 0.0588 |
| 54997 | TESC | HTA11_99999970781_79442 | Human | Colorectum | MSS | 3.83e-12 | 3.62e-01 | 0.294 |
| 54997 | TESC | HTA11_99999965062_69753 | Human | Colorectum | MSI-H | 7.08e-20 | 2.34e+00 | 0.3487 |
| 54997 | TESC | HTA11_99999965104_69814 | Human | Colorectum | MSS | 2.57e-07 | 2.67e-01 | 0.281 |
| 54997 | TESC | HTA11_99999971662_82457 | Human | Colorectum | MSS | 1.66e-85 | 1.79e+00 | 0.3859 |
| 54997 | TESC | HTA11_99999973899_84307 | Human | Colorectum | MSS | 7.41e-24 | 8.53e-01 | 0.2585 |
| 54997 | TESC | HTA11_99999974143_84620 | Human | Colorectum | MSS | 1.13e-42 | 7.73e-01 | 0.3005 |
| 54997 | TESC | A001-C-104 | Human | Colorectum | FAP | 3.61e-02 | 1.74e-01 | 0.0184 |
| 54997 | TESC | A015-C-006 | Human | Colorectum | FAP | 2.79e-06 | 3.94e-01 | -0.0994 |
| 54997 | TESC | A001-C-007 | Human | Colorectum | CRC | 3.26e-04 | 3.22e-01 | 0.1899 |
| 54997 | TESC | CRC-1-8810 | Human | Colorectum | CRC | 9.63e-08 | 3.31e-01 | 0.6257 |
| 54997 | TESC | CRC-3-11773 | Human | Colorectum | CRC | 1.92e-04 | 2.20e-01 | 0.2564 |
| Page: 1 2 3 4 5 |
| Tissue | Expression Dynamics | Abbreviation |
| Colorectum (GSE201348) | 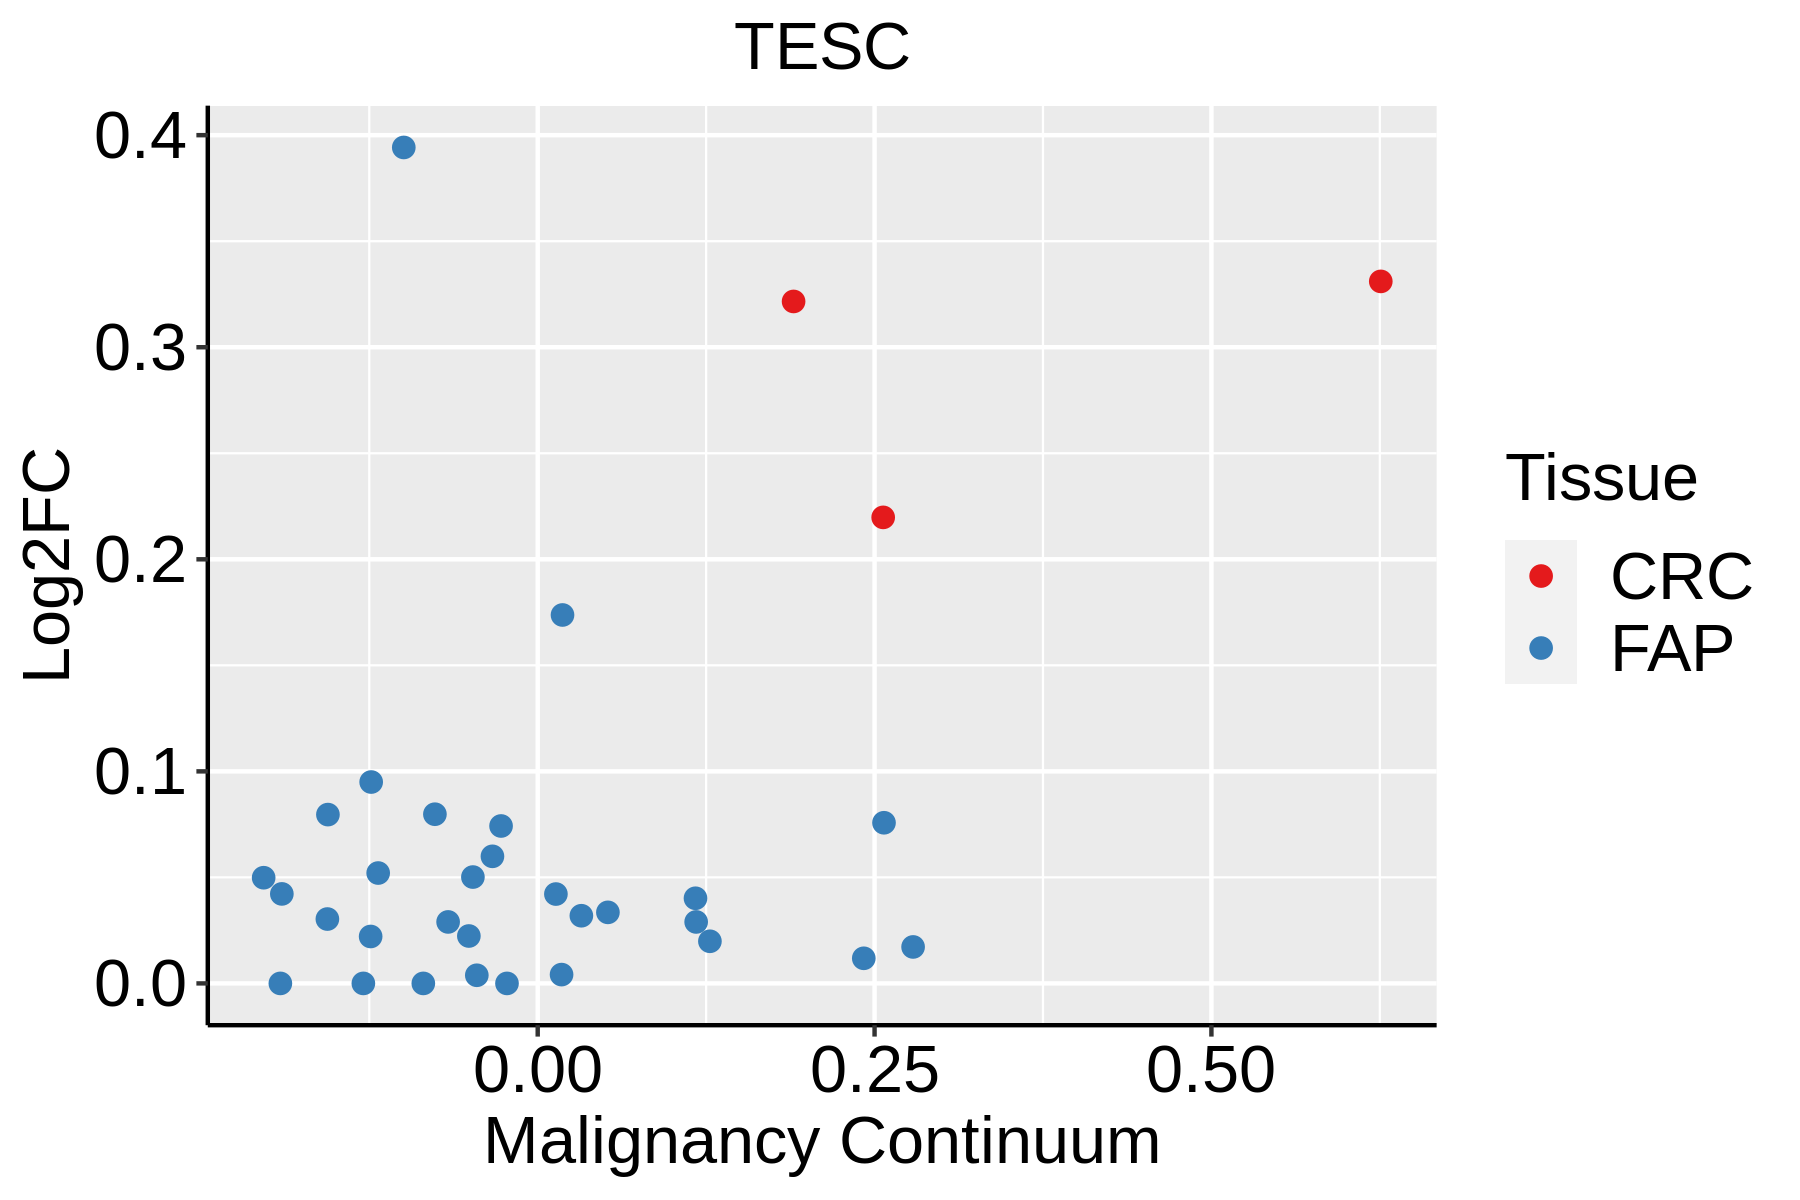 | FAP: Familial adenomatous polyposis |
| CRC: Colorectal cancer | ||
| Colorectum (HTA11) |  | AD: Adenomas |
| SER: Sessile serrated lesions | ||
| MSI-H: Microsatellite-high colorectal cancer | ||
| MSS: Microsatellite stable colorectal cancer | ||
| Esophagus |  | ESCC: Esophageal squamous cell carcinoma |
| HGIN: High-grade intraepithelial neoplasias | ||
| LGIN: Low-grade intraepithelial neoplasias | ||
| GC | 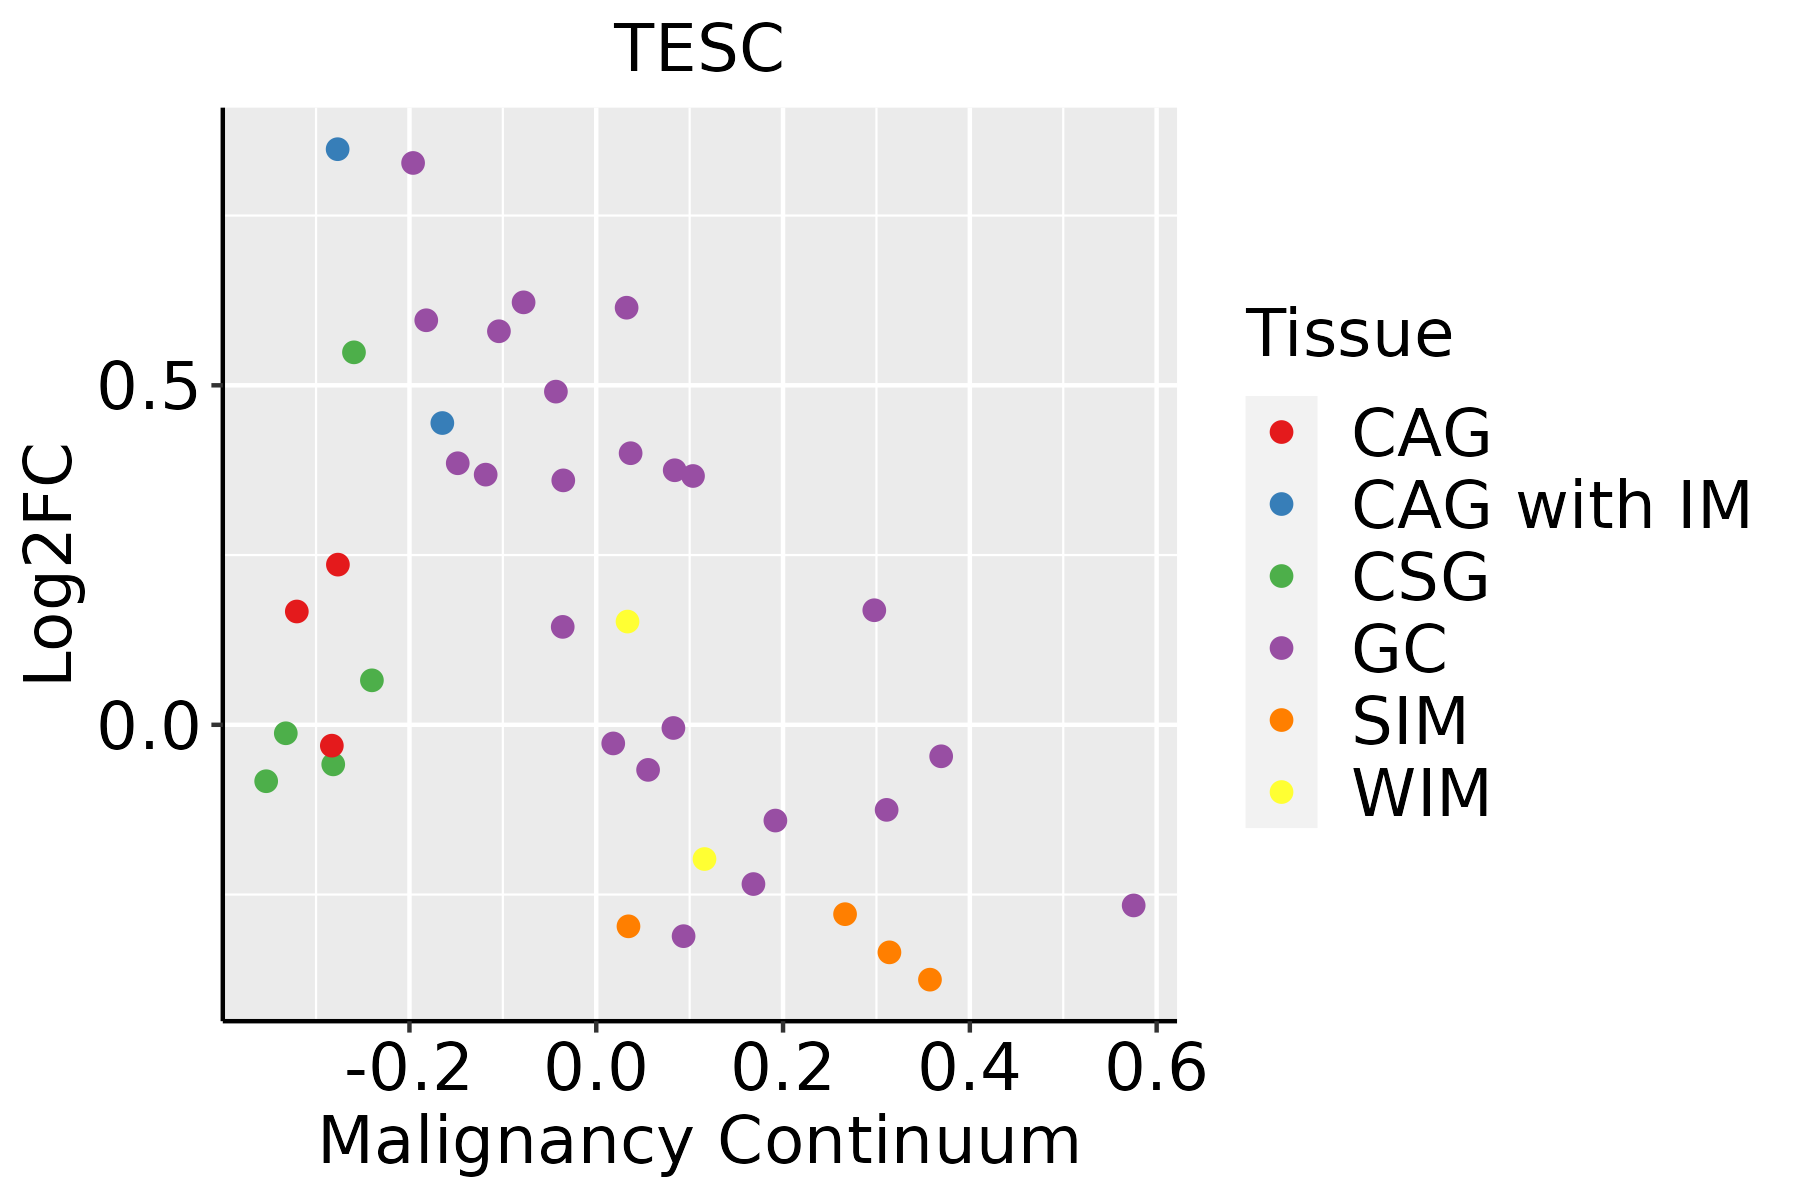 | CAG: Chronic atrophic gastritis |
| CAG with IM: Chronic atrophic gastritis with intestinal metaplasia | ||
| CSG: Chronic superficial gastritis | ||
| GC: Gastric cancer | ||
| SIM: Severe intestinal metaplasia | ||
| WIM: Wild intestinal metaplasia | ||
| Liver | 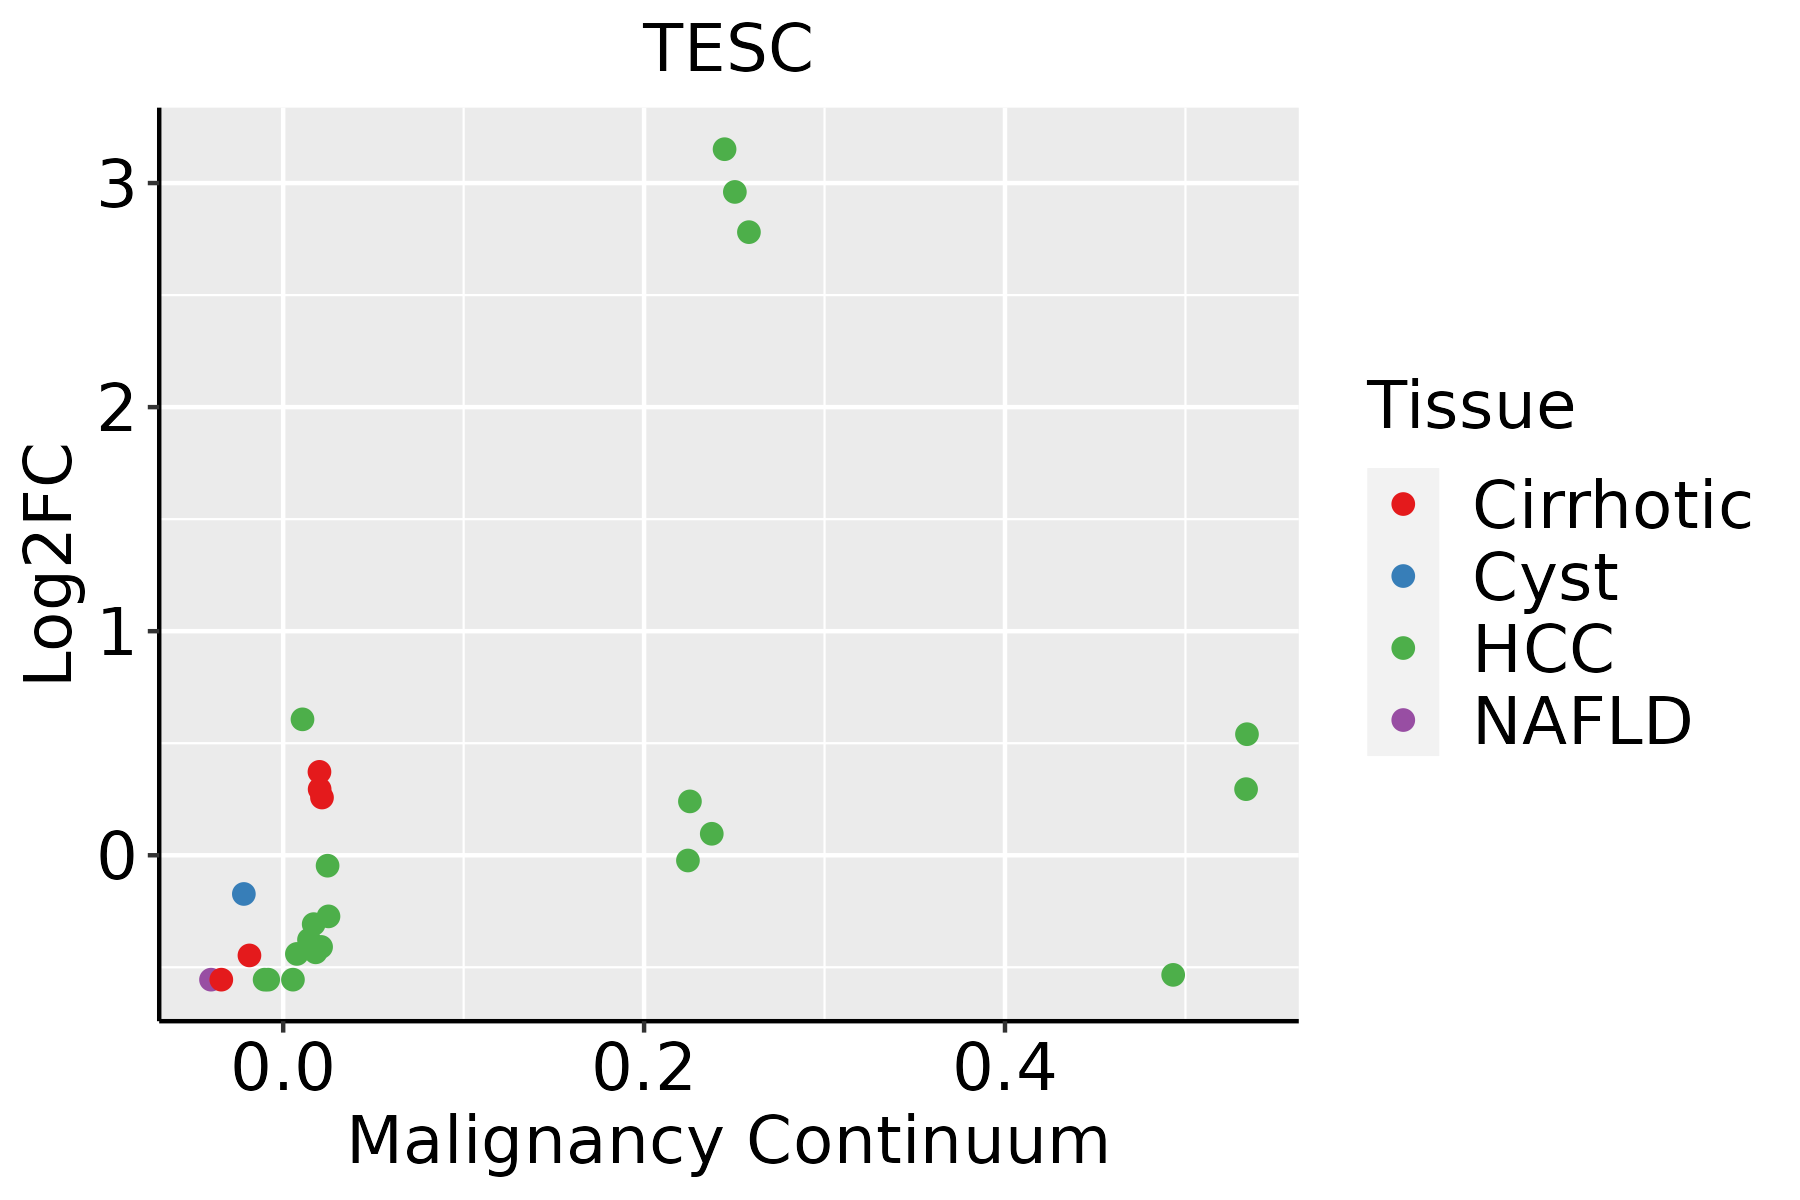 | HCC: Hepatocellular carcinoma |
| NAFLD: Non-alcoholic fatty liver disease | ||
| Lung |  | AAH: Atypical adenomatous hyperplasia |
| AIS: Adenocarcinoma in situ | ||
| IAC: Invasive lung adenocarcinoma | ||
| MIA: Minimally invasive adenocarcinoma | ||
| Thyroid |  | ATC: Anaplastic thyroid cancer |
| HT: Hashimoto's thyroiditis | ||
| PTC: Papillary thyroid cancer |
| ∗log2FC in expression of this searched gene in stem-like cells from each diseased tissue sample relative to stem-like cells in normal samples in each tissue plotted against the malignancy continuum. Samples are colored based on if they are from different disease stage. |
Top |
Malignant transformation related pathway analysis |
| Find out the enriched GO biological processes and KEGG pathways involved in transition from healthy to precancer to cancer |
| Tissue | Disease Stage | Enriched GO biological Processes |
| Colorectum | AD |  |
| Colorectum | SER |  |
| Colorectum | MSS |  |
| Colorectum | MSI-H |  |
| Colorectum | FAP |  |
| ∗Top 15 enriched GO BP terms are showed in the bar plot of each disease state in each tissue. Each row represents a significant GO biological process which is colored according to the -log10(p.adjust). |
| Page: 1 2 3 4 5 6 7 8 9 |
| GO ID | Tissue | Disease Stage | Description | Gene Ratio | Bg Ratio | pvalue | p.adjust | Count |
| GO:0072659 | Colorectum | AD | protein localization to plasma membrane | 122/3918 | 284/18723 | 2.86e-17 | 1.49e-14 | 122 |
| GO:1990778 | Colorectum | AD | protein localization to cell periphery | 129/3918 | 333/18723 | 5.51e-14 | 1.15e-11 | 129 |
| GO:0031647 | Colorectum | AD | regulation of protein stability | 108/3918 | 298/18723 | 6.33e-10 | 5.08e-08 | 108 |
| GO:1902600 | Colorectum | AD | proton transmembrane transport | 66/3918 | 157/18723 | 1.59e-09 | 1.17e-07 | 66 |
| GO:0050821 | Colorectum | AD | protein stabilization | 73/3918 | 191/18723 | 3.02e-08 | 1.64e-06 | 73 |
| GO:0030099 | Colorectum | AD | myeloid cell differentiation | 119/3918 | 381/18723 | 1.24e-06 | 4.01e-05 | 119 |
| GO:0002028 | Colorectum | AD | regulation of sodium ion transport | 36/3918 | 90/18723 | 2.89e-05 | 5.37e-04 | 36 |
| GO:0010765 | Colorectum | AD | positive regulation of sodium ion transport | 17/3918 | 35/18723 | 2.48e-04 | 3.13e-03 | 17 |
| GO:1902305 | Colorectum | AD | regulation of sodium ion transmembrane transport | 27/3918 | 68/18723 | 3.19e-04 | 3.80e-03 | 27 |
| GO:0051604 | Colorectum | AD | protein maturation | 85/3918 | 294/18723 | 6.73e-04 | 6.91e-03 | 85 |
| GO:2000649 | Colorectum | AD | regulation of sodium ion transmembrane transporter activity | 23/3918 | 58/18723 | 8.82e-04 | 8.53e-03 | 23 |
| GO:0061458 | Colorectum | AD | reproductive system development | 116/3918 | 427/18723 | 1.11e-03 | 1.01e-02 | 116 |
| GO:1902307 | Colorectum | AD | positive regulation of sodium ion transmembrane transport | 11/3918 | 21/18723 | 1.43e-03 | 1.22e-02 | 11 |
| GO:0048608 | Colorectum | AD | reproductive structure development | 114/3918 | 424/18723 | 1.78e-03 | 1.47e-02 | 114 |
| GO:2000651 | Colorectum | AD | positive regulation of sodium ion transmembrane transporter activity | 9/3918 | 16/18723 | 2.06e-03 | 1.64e-02 | 9 |
| GO:1903706 | Colorectum | AD | regulation of hemopoiesis | 99/3918 | 367/18723 | 3.08e-03 | 2.28e-02 | 99 |
| GO:0045637 | Colorectum | AD | regulation of myeloid cell differentiation | 61/3918 | 210/18723 | 3.17e-03 | 2.35e-02 | 61 |
| GO:0002573 | Colorectum | AD | myeloid leukocyte differentiation | 60/3918 | 208/18723 | 4.03e-03 | 2.81e-02 | 60 |
| GO:0032411 | Colorectum | AD | positive regulation of transporter activity | 37/3918 | 120/18723 | 6.82e-03 | 4.22e-02 | 37 |
| GO:00726591 | Colorectum | SER | protein localization to plasma membrane | 92/2897 | 284/18723 | 6.36e-13 | 1.86e-10 | 92 |
| Page: 1 2 3 4 5 6 7 8 9 10 11 12 13 14 15 16 |
| Pathway ID | Tissue | Disease Stage | Description | Gene Ratio | Bg Ratio | pvalue | p.adjust | qvalue | Count |
| Page: 1 |
Top |
Cell-cell communication analysis |
| Identification of potential cell-cell interactions between two cell types and their ligand-receptor pairs for different disease states |
| Ligand | Receptor | LRpair | Pathway | Tissue | Disease Stage |
| Page: 1 |
Top |
Single-cell gene regulatory network inference analysis |
| Find out the significant the regulons (TFs) and the target genes of each regulon across cell types for different disease states |
| TF | Cell Type | Tissue | Disease Stage | Target Gene | RSS | Regulon Activity |
| ∗The dot plots of a searched regulon are shown for all cell subpopulations in each disease state of each tissue based on the regulon specific score inferred using pySCENIC and by calculating the average expression. |
| Page: 1 |
Top |
Somatic mutation of malignant transformation related genes |
| Annotation of somatic variants for genes involved in malignant transformation |
| Hugo Symbol | Variant Class | Variant Classification | dbSNP RS | HGVSc | HGVSp | HGVSp Short | SWISSPROT | BIOTYPE | SIFT | PolyPhen | Tumor Sample Barcode | Tissue | Histology | Sex | Age | Stage | Therapy Types | Drugs | Outcome |
| TESC | SNV | Missense_Mutation | c.176N>A | p.Arg59Gln | p.R59Q | Q96BS2 | protein_coding | deleterious(0.03) | benign(0.406) | TCGA-A2-A1FW-01 | Breast | breast invasive carcinoma | Female | <65 | III/IV | Chemotherapy | cytoxan | SD | |
| TESC | SNV | Missense_Mutation | c.244G>C | p.Glu82Gln | p.E82Q | Q96BS2 | protein_coding | tolerated(0.06) | benign(0.248) | TCGA-GM-A2DH-01 | Breast | breast invasive carcinoma | Female | <65 | I/II | Chemotherapy | taxol | CR | |
| TESC | SNV | Missense_Mutation | rs762965516 | c.191G>A | p.Arg64His | p.R64H | Q96BS2 | protein_coding | tolerated(0.34) | benign(0.003) | TCGA-AY-A71X-01 | Colorectum | colon adenocarcinoma | Female | <65 | I/II | Unknown | Unknown | SD |
| TESC | SNV | Missense_Mutation | c.250N>G | p.Asn84Asp | p.N84D | Q96BS2 | protein_coding | tolerated(0.35) | benign(0.003) | TCGA-AZ-6601-01 | Colorectum | colon adenocarcinoma | Male | >=65 | I/II | Unknown | Unknown | PD | |
| TESC | SNV | Missense_Mutation | rs761040708 | c.218G>A | p.Arg73His | p.R73H | Q96BS2 | protein_coding | tolerated(0.35) | benign(0.003) | TCGA-A5-A0G2-01 | Endometrium | uterine corpus endometrioid carcinoma | Female | <65 | III/IV | Unknown | Unknown | SD |
| TESC | SNV | Missense_Mutation | novel | c.200T>C | p.Phe67Ser | p.F67S | Q96BS2 | protein_coding | deleterious(0) | benign(0.351) | TCGA-A5-A0G2-01 | Endometrium | uterine corpus endometrioid carcinoma | Female | <65 | III/IV | Unknown | Unknown | SD |
| TESC | SNV | Missense_Mutation | novel | c.450N>T | p.Glu150Asp | p.E150D | Q96BS2 | protein_coding | tolerated(0.28) | benign(0.001) | TCGA-A5-A2K5-01 | Endometrium | uterine corpus endometrioid carcinoma | Female | >=65 | I/II | Unknown | Unknown | SD |
| TESC | SNV | Missense_Mutation | novel | c.352N>A | p.Leu118Met | p.L118M | Q96BS2 | protein_coding | deleterious(0.01) | possibly_damaging(0.703) | TCGA-A5-A2K5-01 | Endometrium | uterine corpus endometrioid carcinoma | Female | >=65 | I/II | Unknown | Unknown | SD |
| TESC | SNV | Missense_Mutation | rs138273556 | c.295G>A | p.Asp99Asn | p.D99N | Q96BS2 | protein_coding | tolerated(0.29) | benign(0.001) | TCGA-AP-A1DV-01 | Endometrium | uterine corpus endometrioid carcinoma | Female | <65 | I/II | Unknown | Unknown | SD |
| TESC | SNV | Missense_Mutation | rs138273556 | c.295G>A | p.Asp99Asn | p.D99N | Q96BS2 | protein_coding | tolerated(0.29) | benign(0.001) | TCGA-AX-A06F-01 | Endometrium | uterine corpus endometrioid carcinoma | Female | <65 | III/IV | Chemotherapy | carboplatin | SD |
| Page: 1 2 3 |
Top |
Related drugs of malignant transformation related genes |
| Identification of chemicals and drugs interact with genes involved in malignant transfromation |
| (DGIdb 4.0) |
| Entrez ID | Symbol | Category | Interaction Types | Drug Claim Name | Drug Name | PMIDs |
| Page: 1 |

Copyright 2023-Present -The University of Texas Health Science Center at Houston |