
|
|||||
|
 | |
| |
| |
| |
| |
| |
|
Gene: TES |
Gene summary for TES |
| Gene information | Species | Human | Gene symbol | TES | Gene ID | 26136 |
| Gene name | testin LIM domain protein | |
| Gene Alias | TESS | |
| Cytomap | 7q31.2 | |
| Gene Type | protein-coding | GO ID | GO:0008150 | UniProtAcc | A4D0U5 |
Top |
Malignant transformation analysis |
| Identification of the aberrant gene expression in precancerous and cancerous lesions by comparing the gene expression of stem-like cells in diseased tissues with normal stem cells |
| Entrez ID | Symbol | Replicates | Species | Organ | Tissue | Adj P-value | Log2FC | Malignancy |
| 26136 | TES | LZE4T | Human | Esophagus | ESCC | 1.74e-07 | 5.40e-01 | 0.0811 |
| 26136 | TES | LZE8T | Human | Esophagus | ESCC | 1.34e-06 | 2.98e-01 | 0.067 |
| 26136 | TES | LZE22T | Human | Esophagus | ESCC | 9.64e-06 | 9.97e-01 | 0.068 |
| 26136 | TES | LZE24T | Human | Esophagus | ESCC | 1.89e-22 | 1.06e+00 | 0.0596 |
| 26136 | TES | LZE6T | Human | Esophagus | ESCC | 2.29e-06 | 1.48e-01 | 0.0845 |
| 26136 | TES | P1T-E | Human | Esophagus | ESCC | 1.84e-06 | 8.10e-01 | 0.0875 |
| 26136 | TES | P2T-E | Human | Esophagus | ESCC | 3.23e-14 | 2.63e-01 | 0.1177 |
| 26136 | TES | P4T-E | Human | Esophagus | ESCC | 4.69e-19 | 5.91e-01 | 0.1323 |
| 26136 | TES | P5T-E | Human | Esophagus | ESCC | 1.54e-25 | 6.61e-01 | 0.1327 |
| 26136 | TES | P8T-E | Human | Esophagus | ESCC | 2.37e-26 | 8.06e-01 | 0.0889 |
| 26136 | TES | P9T-E | Human | Esophagus | ESCC | 2.49e-10 | 5.23e-01 | 0.1131 |
| 26136 | TES | P10T-E | Human | Esophagus | ESCC | 7.98e-28 | 8.05e-01 | 0.116 |
| 26136 | TES | P11T-E | Human | Esophagus | ESCC | 9.01e-09 | 9.51e-01 | 0.1426 |
| 26136 | TES | P12T-E | Human | Esophagus | ESCC | 5.05e-23 | 7.09e-01 | 0.1122 |
| 26136 | TES | P15T-E | Human | Esophagus | ESCC | 2.33e-40 | 1.40e+00 | 0.1149 |
| 26136 | TES | P16T-E | Human | Esophagus | ESCC | 1.99e-17 | 5.03e-01 | 0.1153 |
| 26136 | TES | P17T-E | Human | Esophagus | ESCC | 1.03e-04 | 4.83e-01 | 0.1278 |
| 26136 | TES | P20T-E | Human | Esophagus | ESCC | 5.15e-43 | 1.50e+00 | 0.1124 |
| 26136 | TES | P21T-E | Human | Esophagus | ESCC | 1.72e-37 | 1.09e+00 | 0.1617 |
| 26136 | TES | P22T-E | Human | Esophagus | ESCC | 8.12e-03 | 1.34e-01 | 0.1236 |
| Page: 1 2 3 4 5 6 7 |
| Tissue | Expression Dynamics | Abbreviation |
| Esophagus | 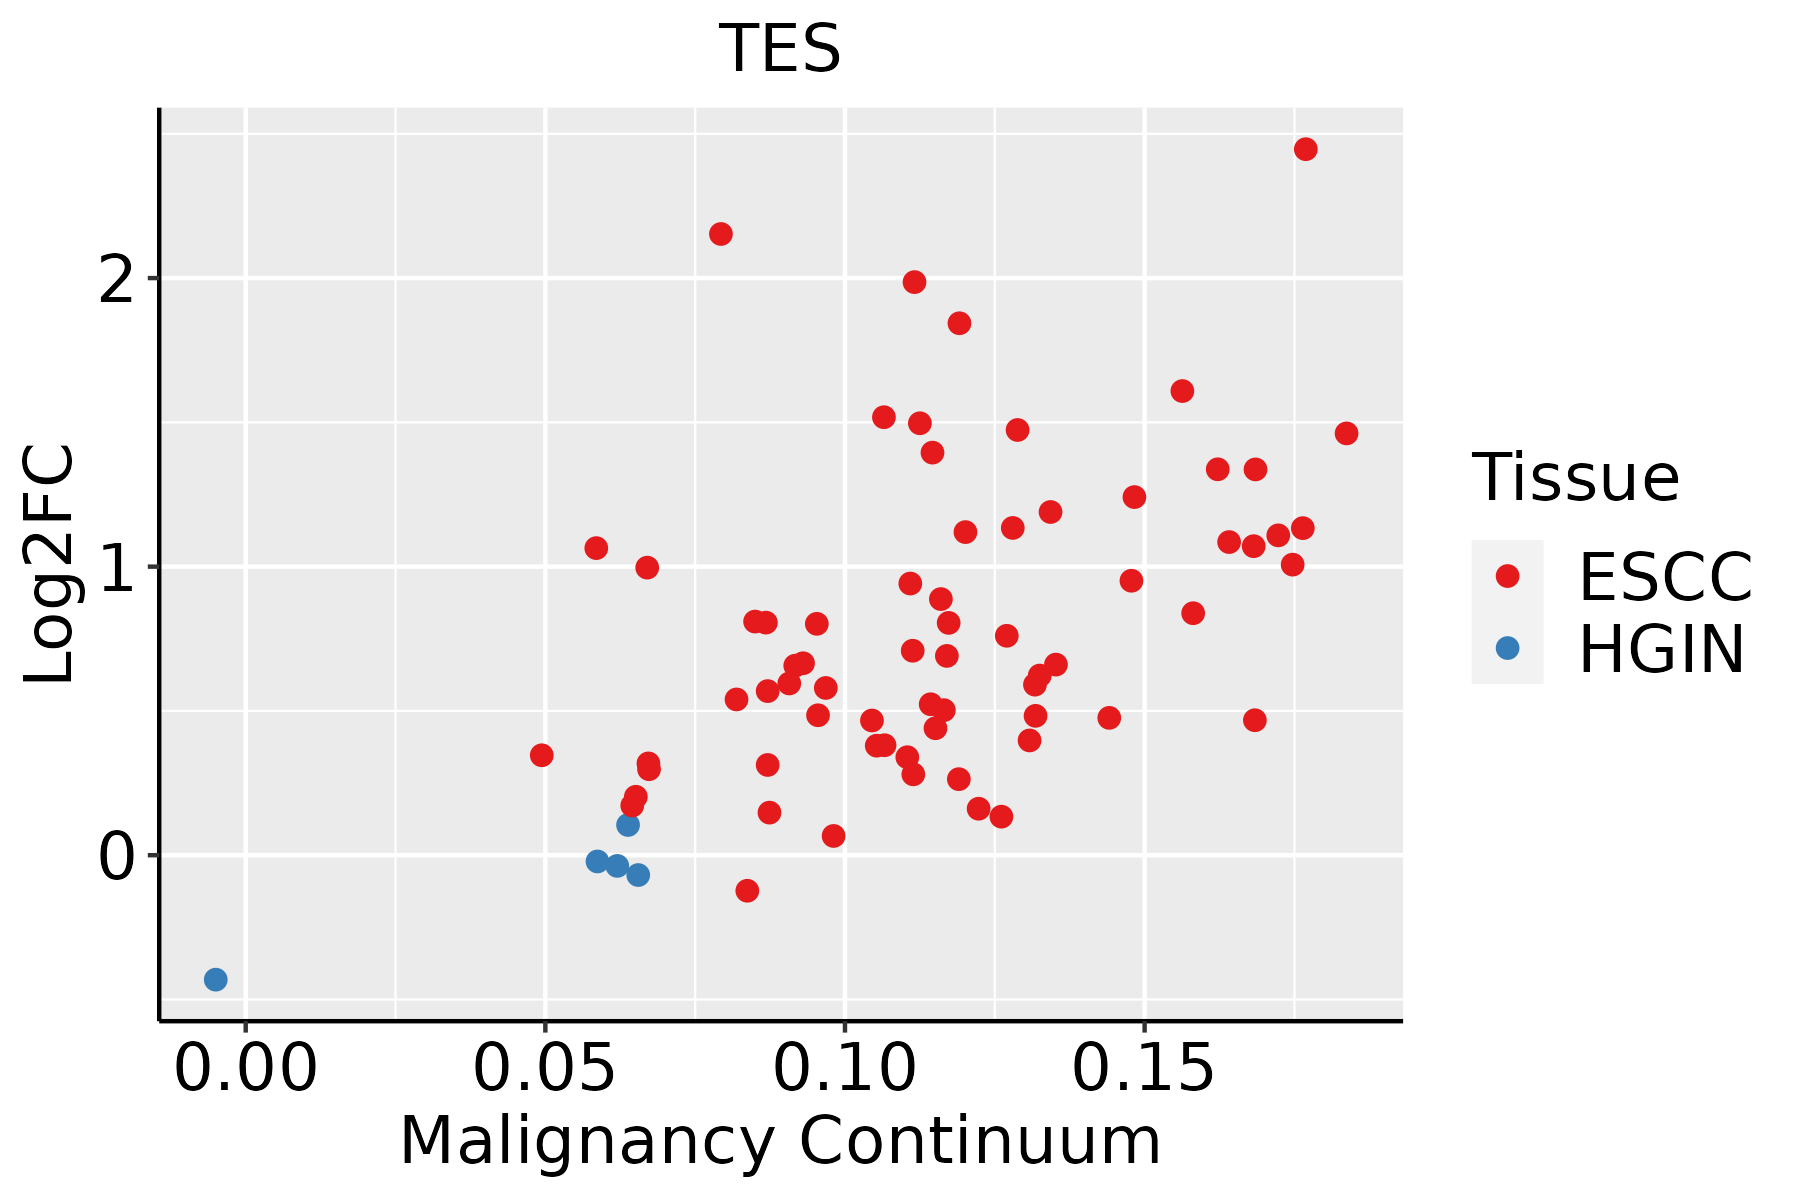 | ESCC: Esophageal squamous cell carcinoma |
| HGIN: High-grade intraepithelial neoplasias | ||
| LGIN: Low-grade intraepithelial neoplasias | ||
| Liver |  | HCC: Hepatocellular carcinoma |
| NAFLD: Non-alcoholic fatty liver disease | ||
| Oral Cavity |  | EOLP: Erosive Oral lichen planus |
| LP: leukoplakia | ||
| NEOLP: Non-erosive oral lichen planus | ||
| OSCC: Oral squamous cell carcinoma | ||
| Skin |  | AK: Actinic keratosis |
| cSCC: Cutaneous squamous cell carcinoma | ||
| SCCIS:squamous cell carcinoma in situ | ||
| Thyroid | 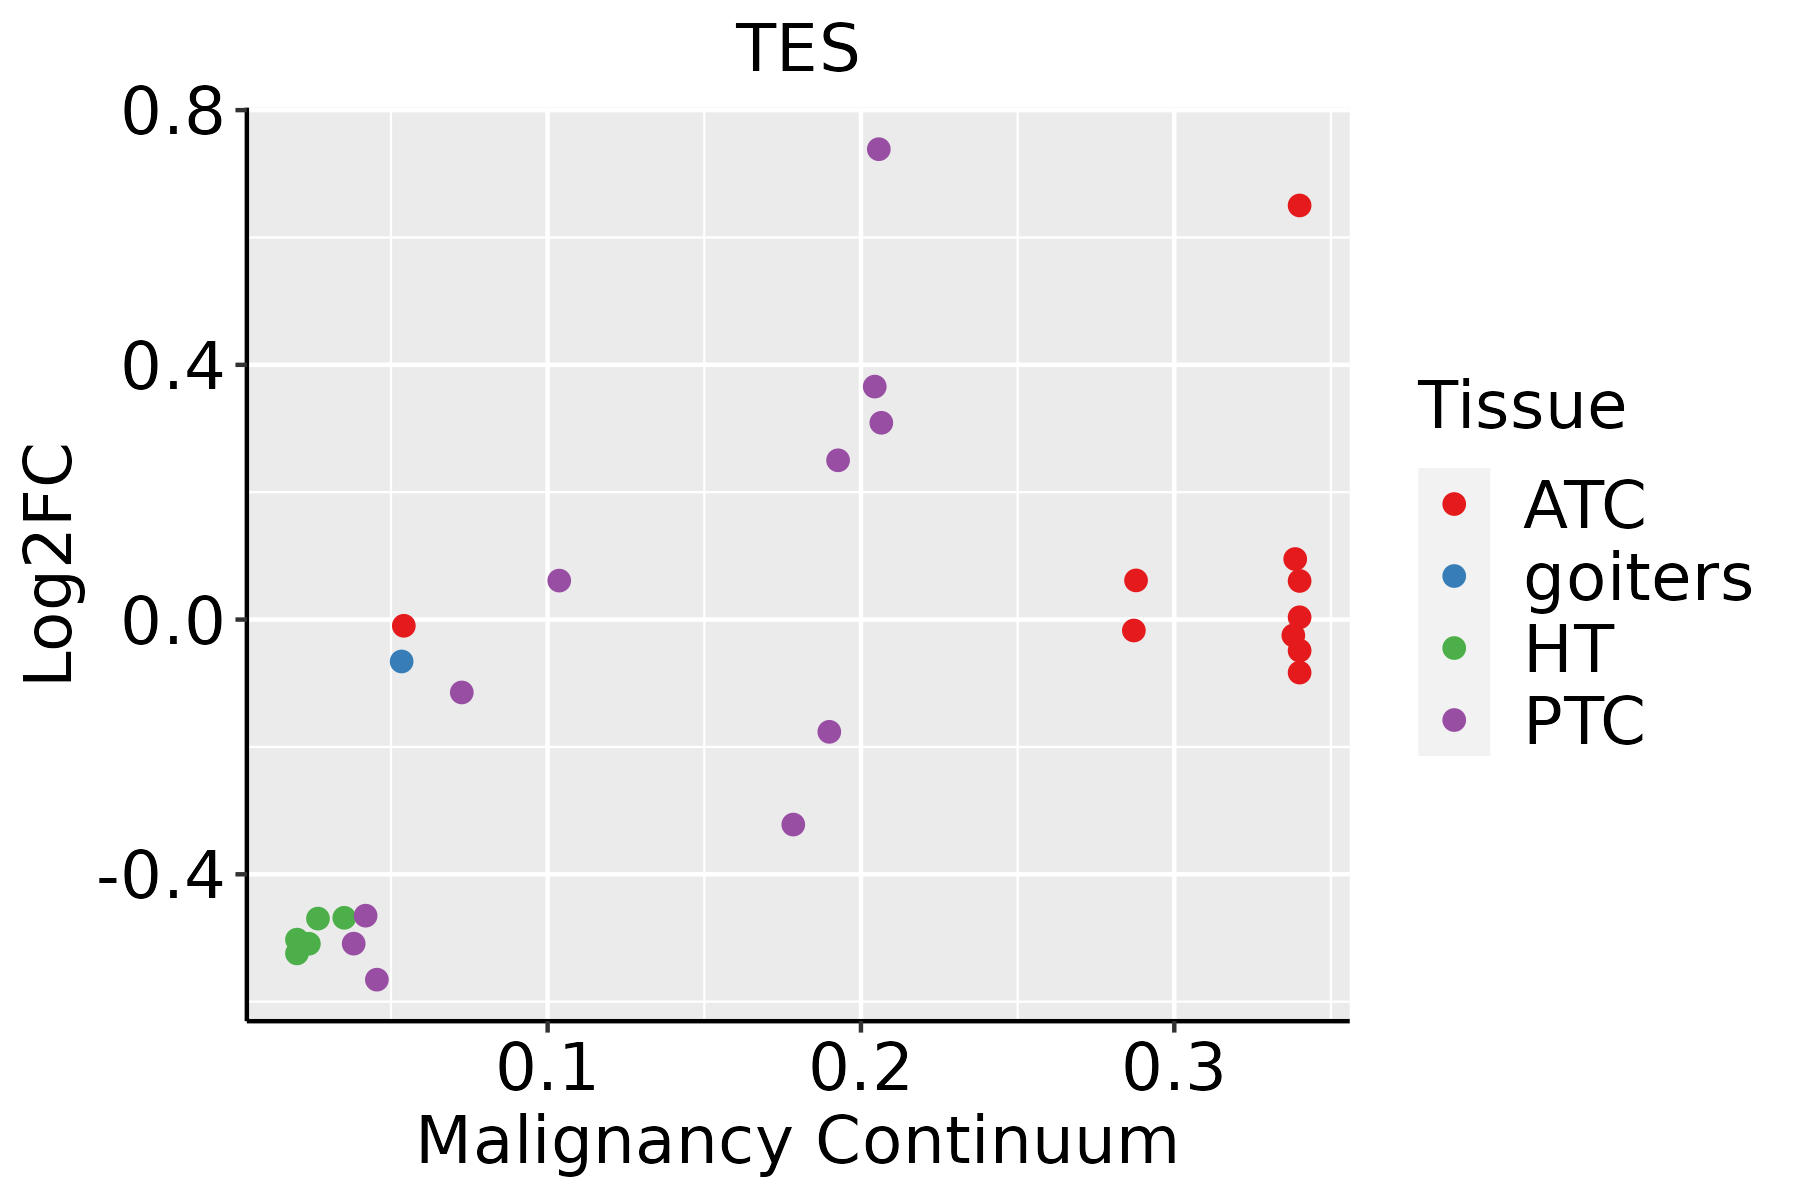 | ATC: Anaplastic thyroid cancer |
| HT: Hashimoto's thyroiditis | ||
| PTC: Papillary thyroid cancer |
| ∗log2FC in expression of this searched gene in stem-like cells from each diseased tissue sample relative to stem-like cells in normal samples in each tissue plotted against the malignancy continuum. Samples are colored based on if they are from different disease stage. |
Top |
Malignant transformation related pathway analysis |
| Find out the enriched GO biological processes and KEGG pathways involved in transition from healthy to precancer to cancer |
| Tissue | Disease Stage | Enriched GO biological Processes |
| Colorectum | AD |  |
| Colorectum | SER |  |
| Colorectum | MSS |  |
| Colorectum | MSI-H |  |
| Colorectum | FAP |  |
| ∗Top 15 enriched GO BP terms are showed in the bar plot of each disease state in each tissue. Each row represents a significant GO biological process which is colored according to the -log10(p.adjust). |
| Page: 1 2 3 4 5 6 7 8 9 |
| GO ID | Tissue | Disease Stage | Description | Gene Ratio | Bg Ratio | pvalue | p.adjust | Count |
| GO:0072659 | Colorectum | AD | protein localization to plasma membrane | 122/3918 | 284/18723 | 2.86e-17 | 1.49e-14 | 122 |
| GO:1990778 | Colorectum | AD | protein localization to cell periphery | 129/3918 | 333/18723 | 5.51e-14 | 1.15e-11 | 129 |
| GO:0031647 | Colorectum | AD | regulation of protein stability | 108/3918 | 298/18723 | 6.33e-10 | 5.08e-08 | 108 |
| GO:1902600 | Colorectum | AD | proton transmembrane transport | 66/3918 | 157/18723 | 1.59e-09 | 1.17e-07 | 66 |
| GO:0034329 | Colorectum | AD | cell junction assembly | 136/3918 | 420/18723 | 2.02e-08 | 1.15e-06 | 136 |
| GO:0050821 | Colorectum | AD | protein stabilization | 73/3918 | 191/18723 | 3.02e-08 | 1.64e-06 | 73 |
| GO:0150115 | Colorectum | AD | cell-substrate junction organization | 44/3918 | 101/18723 | 2.38e-07 | 9.81e-06 | 44 |
| GO:0031589 | Colorectum | AD | cell-substrate adhesion | 116/3918 | 363/18723 | 4.68e-07 | 1.76e-05 | 116 |
| GO:0007044 | Colorectum | AD | cell-substrate junction assembly | 41/3918 | 95/18723 | 8.20e-07 | 2.85e-05 | 41 |
| GO:0030099 | Colorectum | AD | myeloid cell differentiation | 119/3918 | 381/18723 | 1.24e-06 | 4.01e-05 | 119 |
| GO:0002028 | Colorectum | AD | regulation of sodium ion transport | 36/3918 | 90/18723 | 2.89e-05 | 5.37e-04 | 36 |
| GO:0007160 | Colorectum | AD | cell-matrix adhesion | 75/3918 | 233/18723 | 3.56e-05 | 6.45e-04 | 75 |
| GO:0048041 | Colorectum | AD | focal adhesion assembly | 34/3918 | 87/18723 | 8.30e-05 | 1.30e-03 | 34 |
| GO:0010765 | Colorectum | AD | positive regulation of sodium ion transport | 17/3918 | 35/18723 | 2.48e-04 | 3.13e-03 | 17 |
| GO:1902305 | Colorectum | AD | regulation of sodium ion transmembrane transport | 27/3918 | 68/18723 | 3.19e-04 | 3.80e-03 | 27 |
| GO:0051604 | Colorectum | AD | protein maturation | 85/3918 | 294/18723 | 6.73e-04 | 6.91e-03 | 85 |
| GO:2000649 | Colorectum | AD | regulation of sodium ion transmembrane transporter activity | 23/3918 | 58/18723 | 8.82e-04 | 8.53e-03 | 23 |
| GO:0061458 | Colorectum | AD | reproductive system development | 116/3918 | 427/18723 | 1.11e-03 | 1.01e-02 | 116 |
| GO:1902307 | Colorectum | AD | positive regulation of sodium ion transmembrane transport | 11/3918 | 21/18723 | 1.43e-03 | 1.22e-02 | 11 |
| GO:0048608 | Colorectum | AD | reproductive structure development | 114/3918 | 424/18723 | 1.78e-03 | 1.47e-02 | 114 |
| Page: 1 2 3 4 5 6 7 8 9 10 11 12 13 14 15 16 17 18 19 20 21 22 23 |
| Pathway ID | Tissue | Disease Stage | Description | Gene Ratio | Bg Ratio | pvalue | p.adjust | qvalue | Count |
| Page: 1 |
Top |
Cell-cell communication analysis |
| Identification of potential cell-cell interactions between two cell types and their ligand-receptor pairs for different disease states |
| Ligand | Receptor | LRpair | Pathway | Tissue | Disease Stage |
| Page: 1 |
Top |
Single-cell gene regulatory network inference analysis |
| Find out the significant the regulons (TFs) and the target genes of each regulon across cell types for different disease states |
| TF | Cell Type | Tissue | Disease Stage | Target Gene | RSS | Regulon Activity |
| ∗The dot plots of a searched regulon are shown for all cell subpopulations in each disease state of each tissue based on the regulon specific score inferred using pySCENIC and by calculating the average expression. |
| Page: 1 |
Top |
Somatic mutation of malignant transformation related genes |
| Annotation of somatic variants for genes involved in malignant transformation |
| Hugo Symbol | Variant Class | Variant Classification | dbSNP RS | HGVSc | HGVSp | HGVSp Short | SWISSPROT | BIOTYPE | SIFT | PolyPhen | Tumor Sample Barcode | Tissue | Histology | Sex | Age | Stage | Therapy Types | Drugs | Outcome |
| TES | SNV | Missense_Mutation | c.334N>A | p.Glu112Lys | p.E112K | Q9UGI8 | protein_coding | deleterious(0.01) | probably_damaging(0.93) | TCGA-AR-A24H-01 | Breast | breast invasive carcinoma | Female | >=65 | I/II | Hormone Therapy | tamoxiphen | SD | |
| TES | SNV | Missense_Mutation | c.682N>A | p.Glu228Lys | p.E228K | Q9UGI8 | protein_coding | tolerated(0.79) | benign(0.022) | TCGA-BH-A0H5-01 | Breast | breast invasive carcinoma | Female | <65 | I/II | Chemotherapy | cytoxan | CR | |
| TES | SNV | Missense_Mutation | novel | c.437G>A | p.Arg146Gln | p.R146Q | Q9UGI8 | protein_coding | deleterious(0.02) | probably_damaging(0.996) | TCGA-GM-A5PX-01 | Breast | breast invasive carcinoma | Female | >=65 | I/II | Hormone Therapy | arimidex | CR |
| TES | SNV | Missense_Mutation | c.916N>A | p.Glu306Lys | p.E306K | Q9UGI8 | protein_coding | deleterious(0) | probably_damaging(0.991) | TCGA-IR-A3LK-01 | Cervix | cervical & endocervical cancer | Female | >=65 | I/II | Chemotherapy | cisplatin | PD | |
| TES | insertion | Frame_Shift_Ins | novel | c.698_699insTGGC | p.Gln233HisfsTer16 | p.Q233Hfs*16 | Q9UGI8 | protein_coding | TCGA-DS-A1OA-01 | Cervix | cervical & endocervical cancer | Female | >=65 | I/II | Chemotherapy | carboplatin | PD | ||
| TES | SNV | Missense_Mutation | rs199726977 | c.97N>A | p.Glu33Lys | p.E33K | Q9UGI8 | protein_coding | deleterious(0.01) | possibly_damaging(0.79) | TCGA-A6-6141-01 | Colorectum | colon adenocarcinoma | Male | <65 | I/II | Chemotherapy | 5-fu | SD |
| TES | SNV | Missense_Mutation | c.863A>G | p.Tyr288Cys | p.Y288C | Q9UGI8 | protein_coding | deleterious(0.02) | benign(0.075) | TCGA-A6-6653-01 | Colorectum | colon adenocarcinoma | Male | >=65 | I/II | Unknown | Unknown | SD | |
| TES | SNV | Missense_Mutation | c.829N>A | p.Asp277Asn | p.D277N | Q9UGI8 | protein_coding | deleterious(0.03) | possibly_damaging(0.856) | TCGA-AA-3864-01 | Colorectum | colon adenocarcinoma | Male | >=65 | I/II | Unknown | Unknown | SD | |
| TES | SNV | Missense_Mutation | rs199726977 | c.97G>A | p.Glu33Lys | p.E33K | Q9UGI8 | protein_coding | deleterious(0.01) | possibly_damaging(0.79) | TCGA-AA-3984-01 | Colorectum | colon adenocarcinoma | Female | <65 | I/II | Unknown | Unknown | SD |
| TES | SNV | Missense_Mutation | c.692G>T | p.Arg231Ile | p.R231I | Q9UGI8 | protein_coding | tolerated(0.1) | benign(0.01) | TCGA-AA-3984-01 | Colorectum | colon adenocarcinoma | Female | <65 | I/II | Unknown | Unknown | SD |
| Page: 1 2 3 4 5 |
Top |
Related drugs of malignant transformation related genes |
| Identification of chemicals and drugs interact with genes involved in malignant transfromation |
| (DGIdb 4.0) |
| Entrez ID | Symbol | Category | Interaction Types | Drug Claim Name | Drug Name | PMIDs |
| Page: 1 |

Copyright 2023-Present -The University of Texas Health Science Center at Houston |