Schematic overview of the cellular and molecular mechanisms involved in the cancer progression, including the proposed cellular and molecular mechanisms in cancer cells trajectory. AT1: alveolar type 1 cells; AT2: alveolar type 2 cells; AAH: atypical adenomatous hyperplasia; AIS: adenocarcinoma in situ; MIA: minimally invasive adenocarcinoma; IA: invasive adenocarcinoma; EMT: epithelial-mesenchymal transition

Home

Download

Statistics

Help

Contact

Center for Computational Systems Medicine
leaf

Gene summary

leaf

Malignant transformation analysis

leaf

Malignant transformation related pathway analysis

leaf

Cell-cell communication analysis

leaf

Single-cell gene regulatory network inference analysis

leaf

Somatic mutation of malignant transformation related genes

leaf

Related drugs of malignant transformation related genes

Gene: TERF2IP

Gene summary for TERF2IP

check button Gene summary.

Gene informationSpeciesHuman
Gene symbol

TERF2IP

Gene ID

54386

Gene nameTERF2 interacting protein
Gene AliasDRIP5
Cytomap16q23.1
Gene Typeprotein-coding
GO ID

GO:0000018

UniProtAcc

Q9NYB0


Top

Malignant transformation analysis

check button Identification of the aberrant gene expression in precancerous and cancerous lesions by comparing the gene expression of stem-like cells in diseased tissues with normal stem cells
check button Malignant transformation involving gene list.
Entrez IDSymbolReplicatesSpeciesOrganTissueAdj P-valueLog2FCMalignancy
54386TERF2IPLZE4THumanEsophagusESCC1.98e-155.19e-010.0811
54386TERF2IPLZE7THumanEsophagusESCC9.20e-102.83e-010.0667
54386TERF2IPLZE8THumanEsophagusESCC7.07e-04-2.15e-010.067
54386TERF2IPLZE20THumanEsophagusESCC2.61e-103.45e-010.0662
54386TERF2IPLZE22D1HumanEsophagusHGIN9.62e-04-2.74e-020.0595
54386TERF2IPLZE22THumanEsophagusESCC3.18e-044.21e-010.068
54386TERF2IPLZE24THumanEsophagusESCC2.51e-287.66e-010.0596
54386TERF2IPLZE21THumanEsophagusESCC5.27e-075.02e-010.0655
54386TERF2IPLZE6THumanEsophagusESCC6.18e-05-1.48e-010.0845
54386TERF2IPP1T-EHumanEsophagusESCC3.23e-281.22e+000.0875
54386TERF2IPP2T-EHumanEsophagusESCC3.72e-285.70e-010.1177
54386TERF2IPP4T-EHumanEsophagusESCC4.12e-448.92e-010.1323
54386TERF2IPP5T-EHumanEsophagusESCC6.80e-298.42e-010.1327
54386TERF2IPP8T-EHumanEsophagusESCC9.45e-408.77e-010.0889
54386TERF2IPP9T-EHumanEsophagusESCC3.46e-164.15e-010.1131
54386TERF2IPP10T-EHumanEsophagusESCC8.29e-345.77e-010.116
54386TERF2IPP11T-EHumanEsophagusESCC1.61e-249.58e-010.1426
54386TERF2IPP12T-EHumanEsophagusESCC3.63e-358.44e-010.1122
54386TERF2IPP15T-EHumanEsophagusESCC6.87e-398.27e-010.1149
54386TERF2IPP16T-EHumanEsophagusESCC2.05e-368.50e-010.1153
Page: 1 2 3 4 5 6 7 

check button Transcriptomic changes along malignancy continuum.
TissueExpression DynamicsAbbreviation
EsophagusThe image shows the transcriptomic changes along malignancy continuum.log2FC in expression of this searched gene in stem-like cells from each diseased tissue sample relative to stem-like cells in normal samples in each tissue plotted against the malignancy continuum. Samples are colored based on if they are from different disease stage.
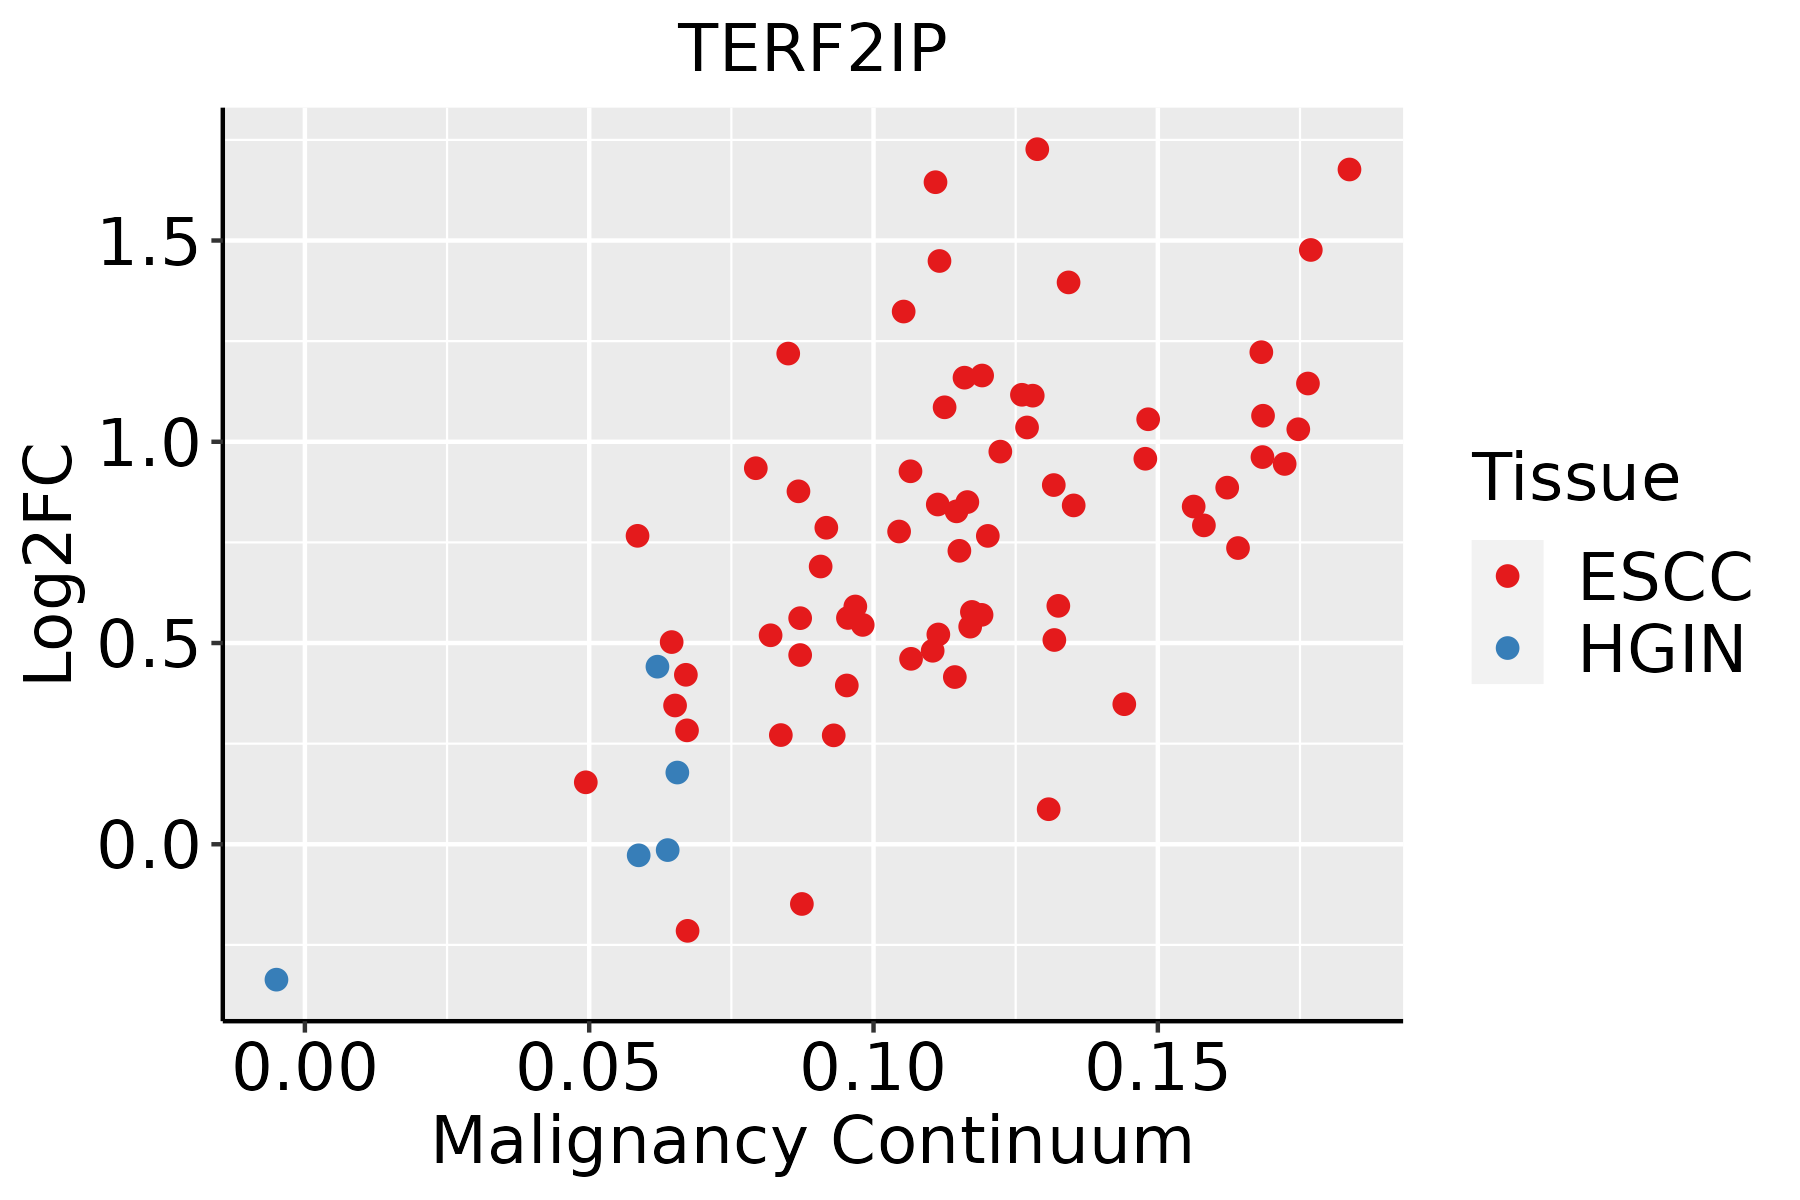
ESCC: Esophageal squamous cell carcinoma
HGIN: High-grade intraepithelial neoplasias
LGIN: Low-grade intraepithelial neoplasias
LiverThe image shows the transcriptomic changes along malignancy continuum.log2FC in expression of this searched gene in stem-like cells from each diseased tissue sample relative to stem-like cells in normal samples in each tissue plotted against the malignancy continuum. Samples are colored based on if they are from different disease stage.HCC: Hepatocellular carcinoma
NAFLD: Non-alcoholic fatty liver disease
Oral CavityThe image shows the transcriptomic changes along malignancy continuum.log2FC in expression of this searched gene in stem-like cells from each diseased tissue sample relative to stem-like cells in normal samples in each tissue plotted against the malignancy continuum. Samples are colored based on if they are from different disease stage.
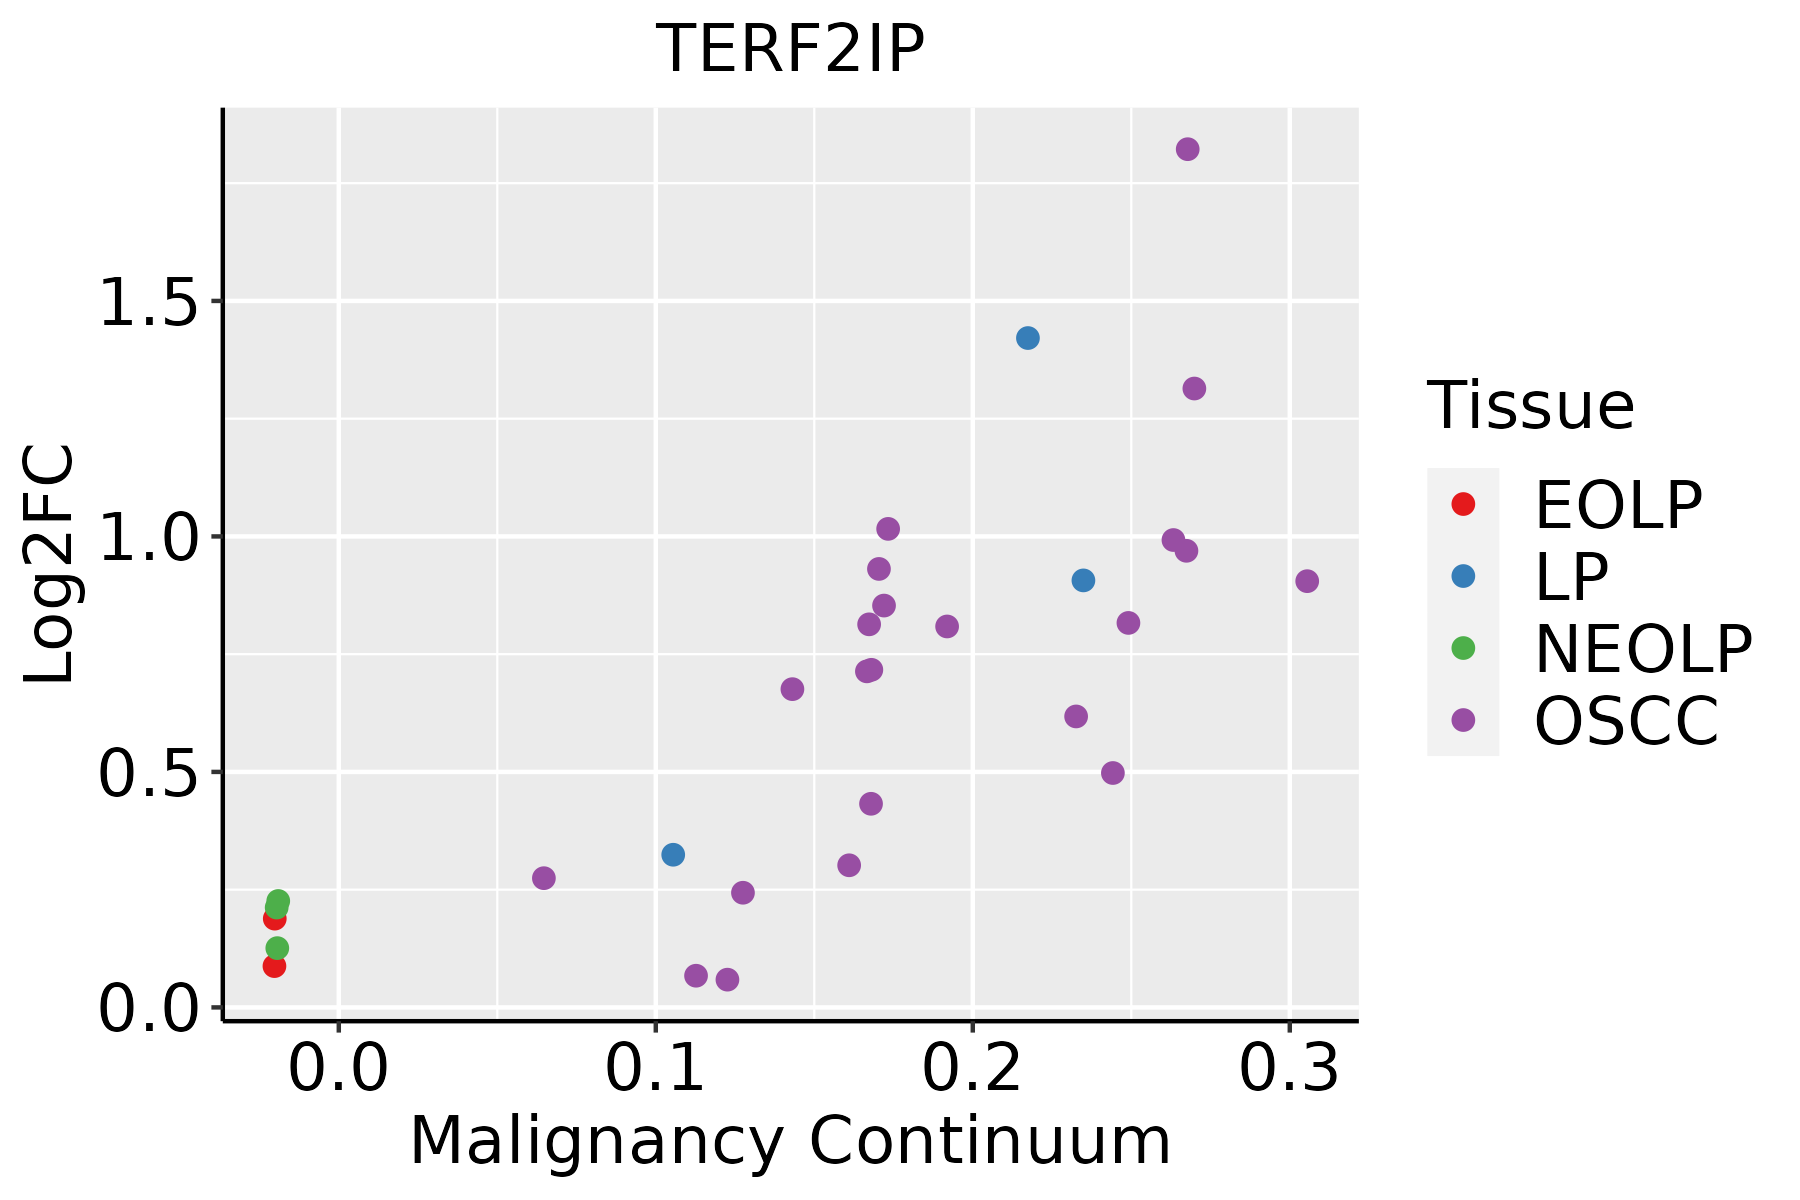
EOLP: Erosive Oral lichen planus
LP: leukoplakia
NEOLP: Non-erosive oral lichen planus
OSCC: Oral squamous cell carcinoma
ProstateThe image shows the transcriptomic changes along malignancy continuum.log2FC in expression of this searched gene in stem-like cells from each diseased tissue sample relative to stem-like cells in normal samples in each tissue plotted against the malignancy continuum. Samples are colored based on if they are from different disease stage.BPH: Benign Prostatic Hyperplasia
SkinThe image shows the transcriptomic changes along malignancy continuum.log2FC in expression of this searched gene in stem-like cells from each diseased tissue sample relative to stem-like cells in normal samples in each tissue plotted against the malignancy continuum. Samples are colored based on if they are from different disease stage.
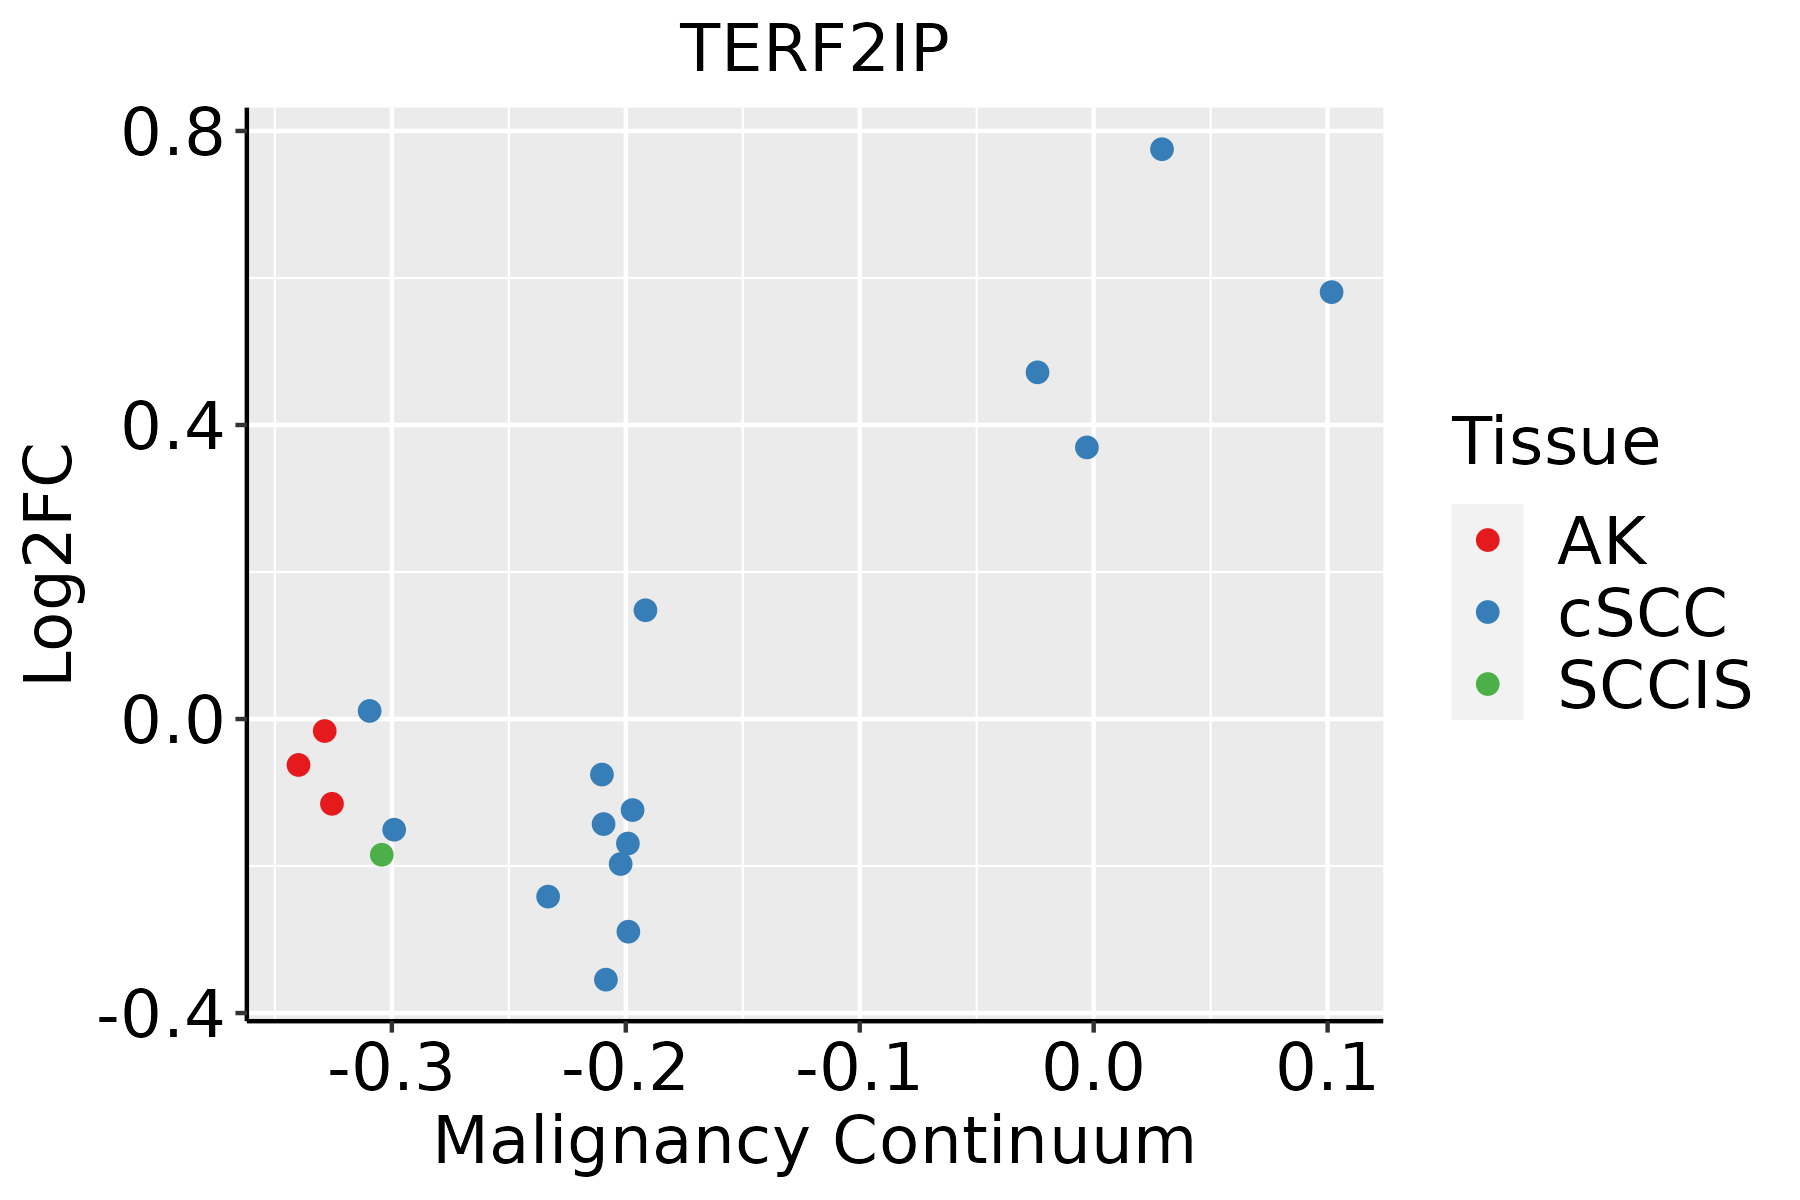
AK: Actinic keratosis
cSCC: Cutaneous squamous cell carcinoma
SCCIS:squamous cell carcinoma in situ
ThyroidThe image shows the transcriptomic changes along malignancy continuum.log2FC in expression of this searched gene in stem-like cells from each diseased tissue sample relative to stem-like cells in normal samples in each tissue plotted against the malignancy continuum. Samples are colored based on if they are from different disease stage.
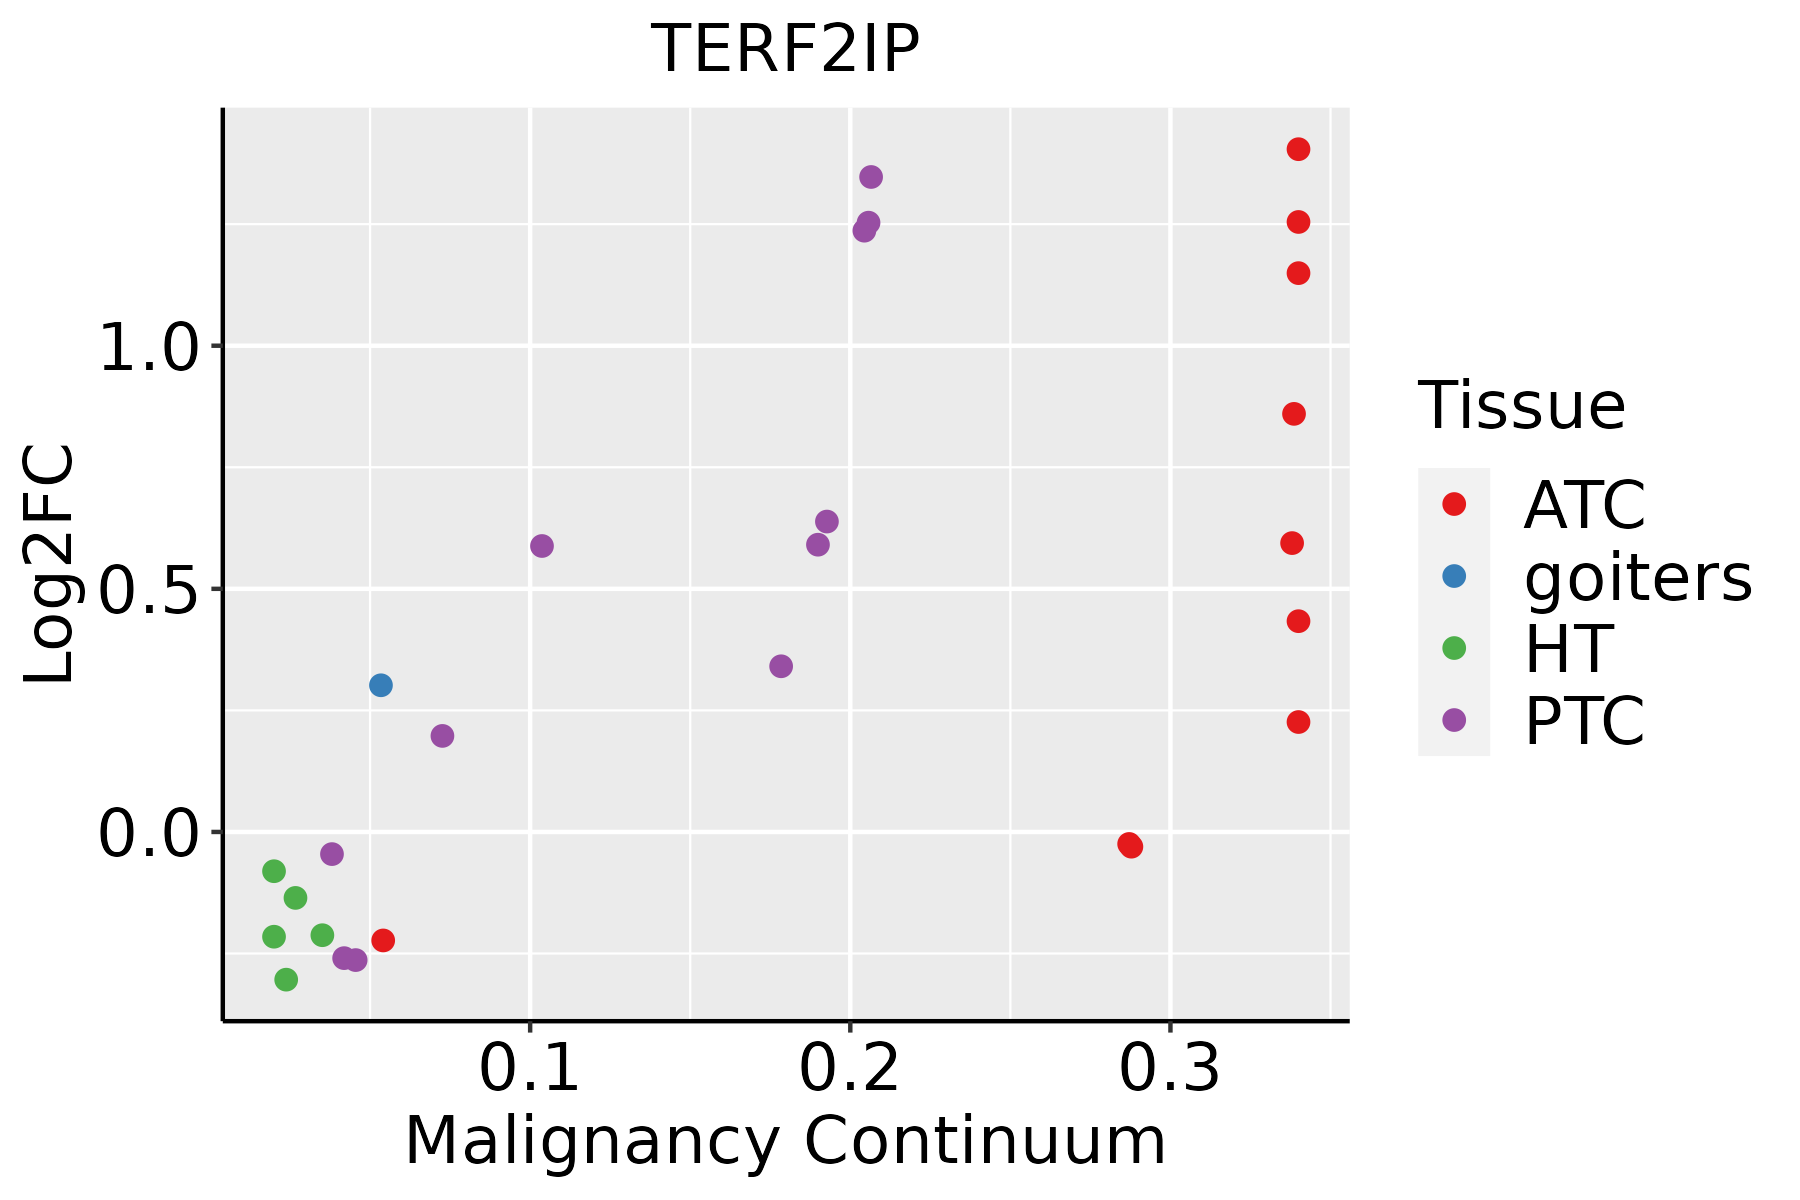
ATC: Anaplastic thyroid cancer
HT: Hashimoto's thyroiditis
PTC: Papillary thyroid cancer
∗log2FC in expression of this searched gene in stem-like cells from each diseased tissue sample relative to stem-like cells in normal samples in each tissue plotted against the malignancy continuum. Samples are colored based on if they are from different disease stage.

Top

Malignant transformation related pathway analysis

check buttonFind out the enriched GO biological processes and KEGG pathways involved in transition from healthy to precancer to cancer
check button Figure of enriched GO biological processes.
TissueDisease StageEnriched GO biological Processes
ColorectumADGO analysis - Figure of enriched GO biological processes: Top 15 enriched GO BP terms are showed in the bar plot of each disease state in each tissue. Each row represents a significant GO biological process which is colored according to the -log10(p.adjust).
ColorectumSERGO analysis - Figure of enriched GO biological processes: Top 15 enriched GO BP terms are showed in the bar plot of each disease state in each tissue. Each row represents a significant GO biological process which is colored according to the -log10(p.adjust).
ColorectumMSSGO analysis - Figure of enriched GO biological processes: Top 15 enriched GO BP terms are showed in the bar plot of each disease state in each tissue. Each row represents a significant GO biological process which is colored according to the -log10(p.adjust).
ColorectumMSI-HGO analysis - Figure of enriched GO biological processes: Top 15 enriched GO BP terms are showed in the bar plot of each disease state in each tissue. Each row represents a significant GO biological process which is colored according to the -log10(p.adjust).
ColorectumFAPGO analysis - Figure of enriched GO biological processes: Top 15 enriched GO BP terms are showed in the bar plot of each disease state in each tissue. Each row represents a significant GO biological process which is colored according to the -log10(p.adjust).
∗Top 15 enriched GO BP terms are showed in the bar plot of each disease state in each tissue. Each row represents a significant GO biological process which is colored according to the -log10(p.adjust).
Page: 1 2 3 4 5 6 7 8 9 

check button Enriched GO biological processes.
GO IDTissueDisease StageDescriptionGene RatioBg Ratiopvaluep.adjustCount
GO:00330449EsophagusHGINregulation of chromosome organization51/2587187/187238.91e-073.61e-0551
GO:004312220EsophagusHGINregulation of I-kappaB kinase/NF-kappaB signaling63/2587249/187238.91e-073.61e-0563
GO:000724918EsophagusHGINI-kappaB kinase/NF-kappaB signaling67/2587281/187233.84e-061.29e-0467
GO:001063920EsophagusHGINnegative regulation of organelle organization79/2587348/187234.12e-061.37e-0479
GO:004312317EsophagusHGINpositive regulation of I-kappaB kinase/NF-kappaB signaling49/2587186/187234.22e-061.40e-0449
GO:000072318EsophagusHGINtelomere maintenance38/2587131/187234.38e-061.42e-0438
GO:003220416EsophagusHGINregulation of telomere maintenance27/258780/187234.83e-061.56e-0427
GO:005105214EsophagusHGINregulation of DNA metabolic process79/2587359/187231.38e-053.85e-0479
GO:200102019EsophagusHGINregulation of response to DNA damage stimulus52/2587219/187235.00e-051.19e-0352
GO:007189710EsophagusHGINDNA biosynthetic process44/2587180/187238.97e-051.96e-0344
GO:004593626EsophagusHGINnegative regulation of phosphate metabolic process89/2587441/187231.24e-042.54e-0389
GO:001056326EsophagusHGINnegative regulation of phosphorus metabolic process89/2587442/187231.34e-042.71e-0389
GO:00701987EsophagusHGINprotein localization to chromosome, telomeric region12/258729/187232.48e-044.38e-0312
GO:004232620EsophagusHGINnegative regulation of phosphorylation78/2587385/187232.77e-044.77e-0378
GO:000700417EsophagusHGINtelomere maintenance via telomerase21/258769/187232.80e-044.80e-0321
GO:00322007EsophagusHGINtelomere organization38/2587159/187234.23e-046.39e-0338
GO:001083318EsophagusHGINtelomere maintenance via telomere lengthening23/258781/187234.52e-046.62e-0323
GO:00064735EsophagusHGINprotein acetylation45/2587201/187236.17e-048.58e-0345
GO:000193320EsophagusHGINnegative regulation of protein phosphorylation69/2587342/187236.81e-049.26e-0369
GO:000627810EsophagusHGINRNA-dependent DNA biosynthetic process21/258775/187239.58e-041.21e-0221
Page: 1 2 3 4 5 6 7 8 9 10 11 12 13 14 15 16 17 18 19 20 21 22 

check button Enriched KEGG pathways.
Pathway IDTissueDisease StageDescriptionGene RatioBg Ratiopvaluep.adjustqvalueCount
Page: 1 

Top

Cell-cell communication analysis

check buttonIdentification of potential cell-cell interactions between two cell types and their ligand-receptor pairs for different disease states
LigandReceptorLRpairPathwayTissueDisease Stage
Page: 1 

Top

Single-cell gene regulatory network inference analysis

check buttonFind out the significant the regulons (TFs) and the target genes of each regulon across cell types for different disease states
TFCell TypeTissueDisease StageTarget GeneRSSRegulon Activity
∗The dot plots of a searched regulon are shown for all cell subpopulations in each disease state of each tissue based on the regulon specific score inferred using pySCENIC and by calculating the average expression.
Page: 1 

Top

Somatic mutation of malignant transformation related genes

check buttonAnnotation of somatic variants for genes involved in malignant transformation
Hugo SymbolVariant ClassVariant ClassificationdbSNP RSHGVScHGVSpHGVSp ShortSWISSPROTBIOTYPESIFTPolyPhenTumor Sample BarcodeTissueHistologySexAgeStageTherapy TypesDrugsOutcome
TERF2IPSNVMissense_Mutationc.922N>Gp.Gln308Glup.Q308EQ9NYB0protein_codingtolerated(0.28)benign(0.001)TCGA-A8-A08L-01Breastbreast invasive carcinomaFemale>=65III/IVUnknownUnknownSD
TERF2IPSNVMissense_Mutationrs527404806c.839G>Ap.Cys280Tyrp.C280YQ9NYB0protein_codingtolerated(0.14)possibly_damaging(0.854)TCGA-B6-A0WY-01Breastbreast invasive carcinomaFemale<65III/IVUnknownUnknownPD
TERF2IPinsertionFrame_Shift_Insnovelc.900_901insATTGTTGCCTTTTGTAGTCTGTTTTATTATTTGATATTTGp.Glu301IlefsTer29p.E301Ifs*29Q9NYB0protein_codingTCGA-AN-A0FS-01Breastbreast invasive carcinomaFemale<65I/IIUnknownUnknownSD
TERF2IPSNVMissense_Mutationnovelc.506N>Cp.Lys169Thrp.K169TQ9NYB0protein_codingdeleterious(0.01)probably_damaging(0.963)TCGA-EA-A3QD-01Cervixcervical & endocervical cancerFemale<65III/IVChemotherapycisplatinCR
TERF2IPSNVMissense_Mutationc.1194G>Tp.Lys398Asnp.K398NQ9NYB0protein_codingdeleterious_low_confidence(0)benign(0.006)TCGA-CA-6718-01Colorectumcolon adenocarcinomaMale<65I/IIUnknownUnknownPD
TERF2IPSNVMissense_Mutationrs367821647c.1052C>Tp.Ala351Valp.A351VQ9NYB0protein_codingdeleterious(0.04)benign(0.007)TCGA-AG-A00H-01Colorectumrectum adenocarcinomaMale>=65I/IIChemotherapy5-fluorouracilPD
TERF2IPSNVMissense_Mutationrs367571165c.1190N>Ap.Arg397Glnp.R397QQ9NYB0protein_codingtolerated(0.12)probably_damaging(0.988)TCGA-EI-6917-01Colorectumrectum adenocarcinomaMale<65III/IVChemotherapy5fluorouracil+oxaciplatina+l-folinianSD
TERF2IPSNVMissense_Mutationrs148810861c.1105N>Tp.Asp369Tyrp.D369YQ9NYB0protein_codingdeleterious(0)probably_damaging(0.96)TCGA-A5-A0G2-01Endometriumuterine corpus endometrioid carcinomaFemale<65III/IVUnknownUnknownSD
TERF2IPSNVMissense_Mutationnovelc.745N>Ap.Ala249Thrp.A249TQ9NYB0protein_codingtolerated(0.53)benign(0)TCGA-AJ-A3BH-01Endometriumuterine corpus endometrioid carcinomaFemaleUnknownI/IIUnknownUnknownSD
TERF2IPSNVMissense_Mutationc.832A>Gp.Thr278Alap.T278AQ9NYB0protein_codingtolerated(0.11)benign(0.225)TCGA-AP-A051-01Endometriumuterine corpus endometrioid carcinomaFemale>=65I/IIUnknownUnknownSD
Page: 1 2 3 

Top

Related drugs of malignant transformation related genes

check buttonIdentification of chemicals and drugs interact with genes involved in malignant transfromation
(DGIdb 4.0)
Entrez IDSymbolCategoryInteraction TypesDrug Claim NameDrug NamePMIDs
Page: 1