Schematic overview of the cellular and molecular mechanisms involved in the cancer progression, including the proposed cellular and molecular mechanisms in cancer cells trajectory. AT1: alveolar type 1 cells; AT2: alveolar type 2 cells; AAH: atypical adenomatous hyperplasia; AIS: adenocarcinoma in situ; MIA: minimally invasive adenocarcinoma; IA: invasive adenocarcinoma; EMT: epithelial-mesenchymal transition

Home

Download

Statistics

Help

Contact

Center for Computational Systems Medicine
leaf

Gene summary

leaf

Malignant transformation analysis

leaf

Malignant transformation related pathway analysis

leaf

Cell-cell communication analysis

leaf

Single-cell gene regulatory network inference analysis

leaf

Somatic mutation of malignant transformation related genes

leaf

Related drugs of malignant transformation related genes

Gene: TERF1

Gene summary for TERF1

check button Gene summary.

Gene informationSpeciesHuman
Gene symbol

TERF1

Gene ID

7013

Gene nametelomeric repeat binding factor 1
Gene AliasPIN2
Cytomap8q21.11
Gene Typeprotein-coding
GO ID

GO:0000003

UniProtAcc

P54274


Top

Malignant transformation analysis

check button Identification of the aberrant gene expression in precancerous and cancerous lesions by comparing the gene expression of stem-like cells in diseased tissues with normal stem cells
check button Malignant transformation involving gene list.
Entrez IDSymbolReplicatesSpeciesOrganTissueAdj P-valueLog2FCMalignancy
7013TERF1LZE2THumanEsophagusESCC3.27e-055.82e-010.082
7013TERF1LZE4THumanEsophagusESCC9.73e-166.10e-010.0811
7013TERF1LZE7THumanEsophagusESCC6.15e-074.79e-010.0667
7013TERF1LZE8THumanEsophagusESCC1.19e-031.63e-010.067
7013TERF1LZE20THumanEsophagusESCC5.70e-073.15e-010.0662
7013TERF1LZE24THumanEsophagusESCC1.26e-156.15e-010.0596
7013TERF1LZE6THumanEsophagusESCC3.97e-041.68e-010.0845
7013TERF1P1T-EHumanEsophagusESCC2.01e-095.57e-010.0875
7013TERF1P2T-EHumanEsophagusESCC9.55e-601.06e+000.1177
7013TERF1P4T-EHumanEsophagusESCC4.28e-401.05e+000.1323
7013TERF1P5T-EHumanEsophagusESCC5.02e-326.78e-010.1327
7013TERF1P8T-EHumanEsophagusESCC2.06e-285.17e-010.0889
7013TERF1P9T-EHumanEsophagusESCC1.03e-205.04e-010.1131
7013TERF1P10T-EHumanEsophagusESCC2.41e-571.04e+000.116
7013TERF1P11T-EHumanEsophagusESCC4.68e-176.95e-010.1426
7013TERF1P12T-EHumanEsophagusESCC6.02e-621.20e+000.1122
7013TERF1P15T-EHumanEsophagusESCC3.06e-277.35e-010.1149
7013TERF1P16T-EHumanEsophagusESCC1.14e-711.43e+000.1153
7013TERF1P17T-EHumanEsophagusESCC1.78e-063.70e-010.1278
7013TERF1P19T-EHumanEsophagusESCC8.34e-054.85e-010.1662
Page: 1 2 3 4 5 6 

check button Transcriptomic changes along malignancy continuum.
TissueExpression DynamicsAbbreviation
EsophagusThe image shows the transcriptomic changes along malignancy continuum.log2FC in expression of this searched gene in stem-like cells from each diseased tissue sample relative to stem-like cells in normal samples in each tissue plotted against the malignancy continuum. Samples are colored based on if they are from different disease stage.
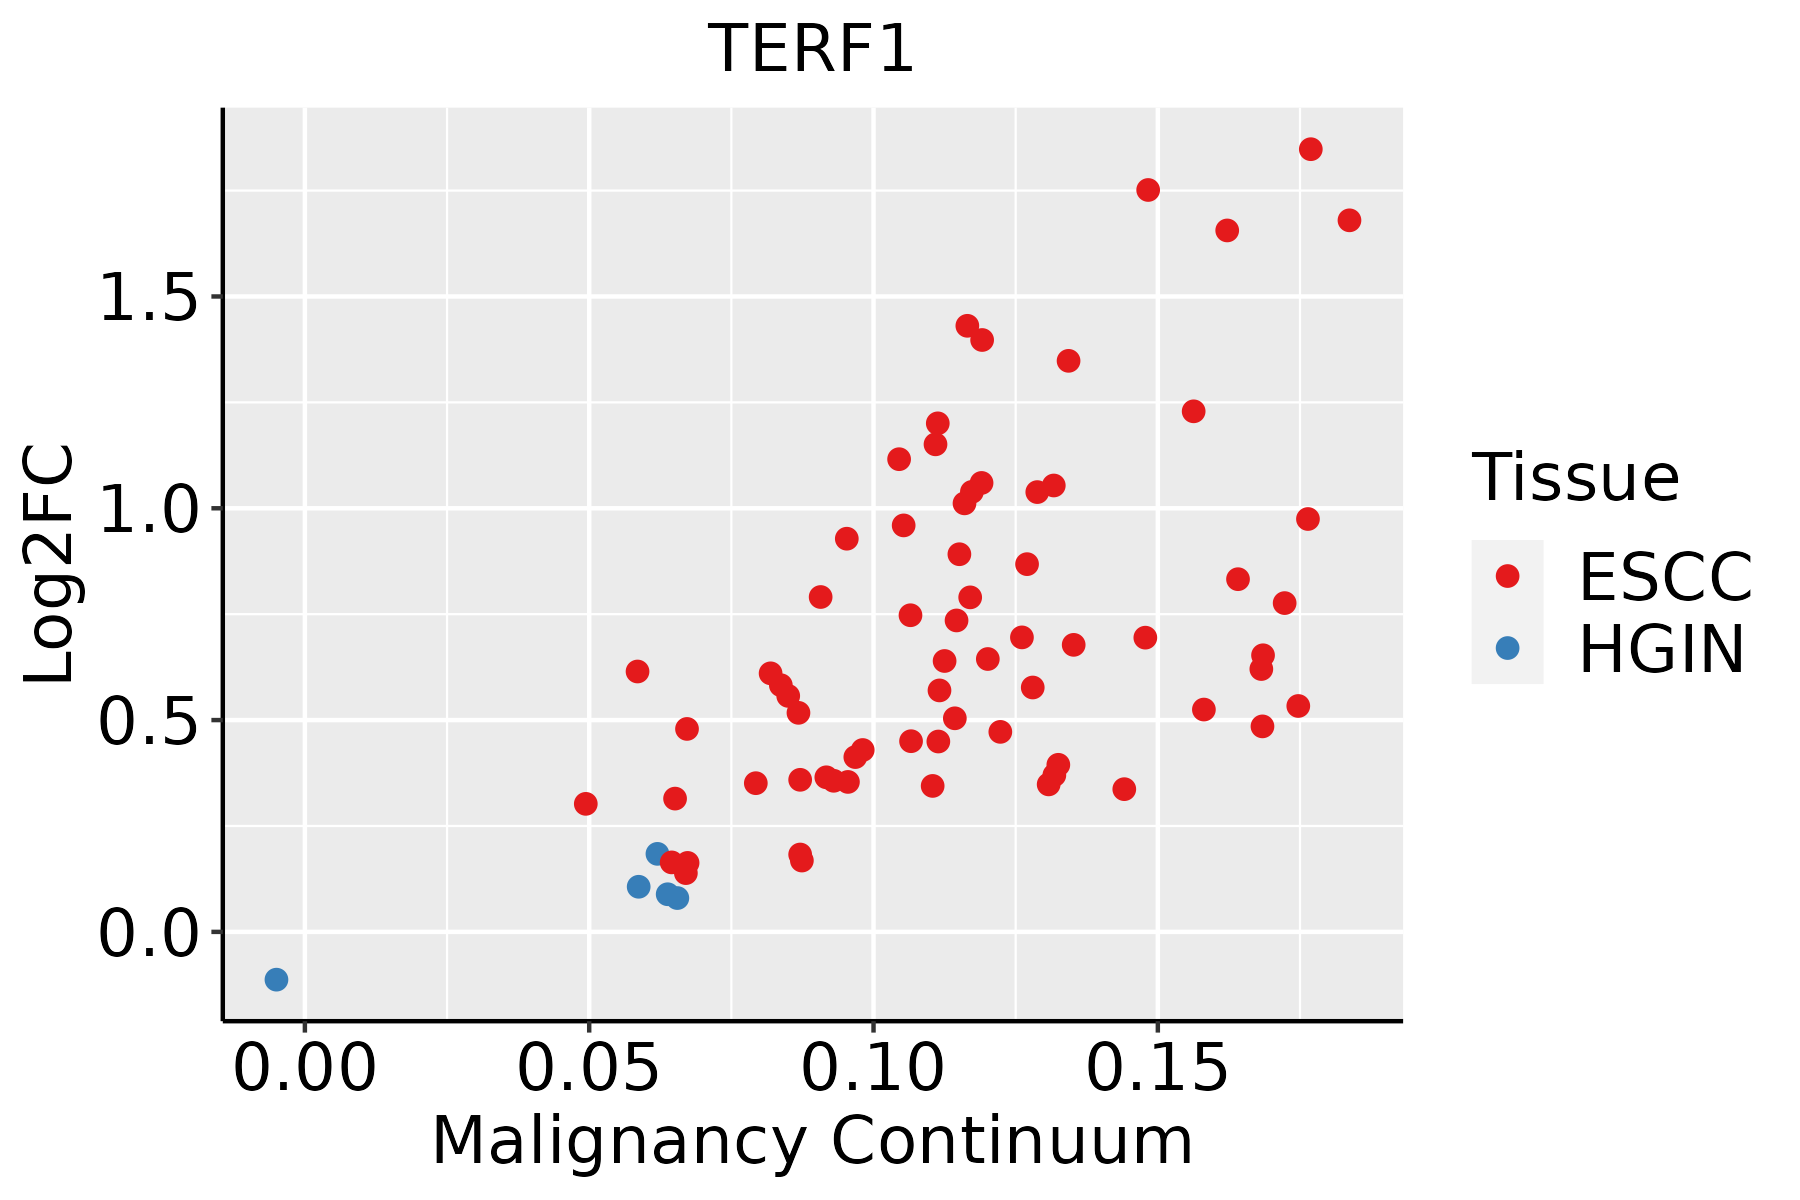
ESCC: Esophageal squamous cell carcinoma
HGIN: High-grade intraepithelial neoplasias
LGIN: Low-grade intraepithelial neoplasias
LiverThe image shows the transcriptomic changes along malignancy continuum.log2FC in expression of this searched gene in stem-like cells from each diseased tissue sample relative to stem-like cells in normal samples in each tissue plotted against the malignancy continuum. Samples are colored based on if they are from different disease stage.
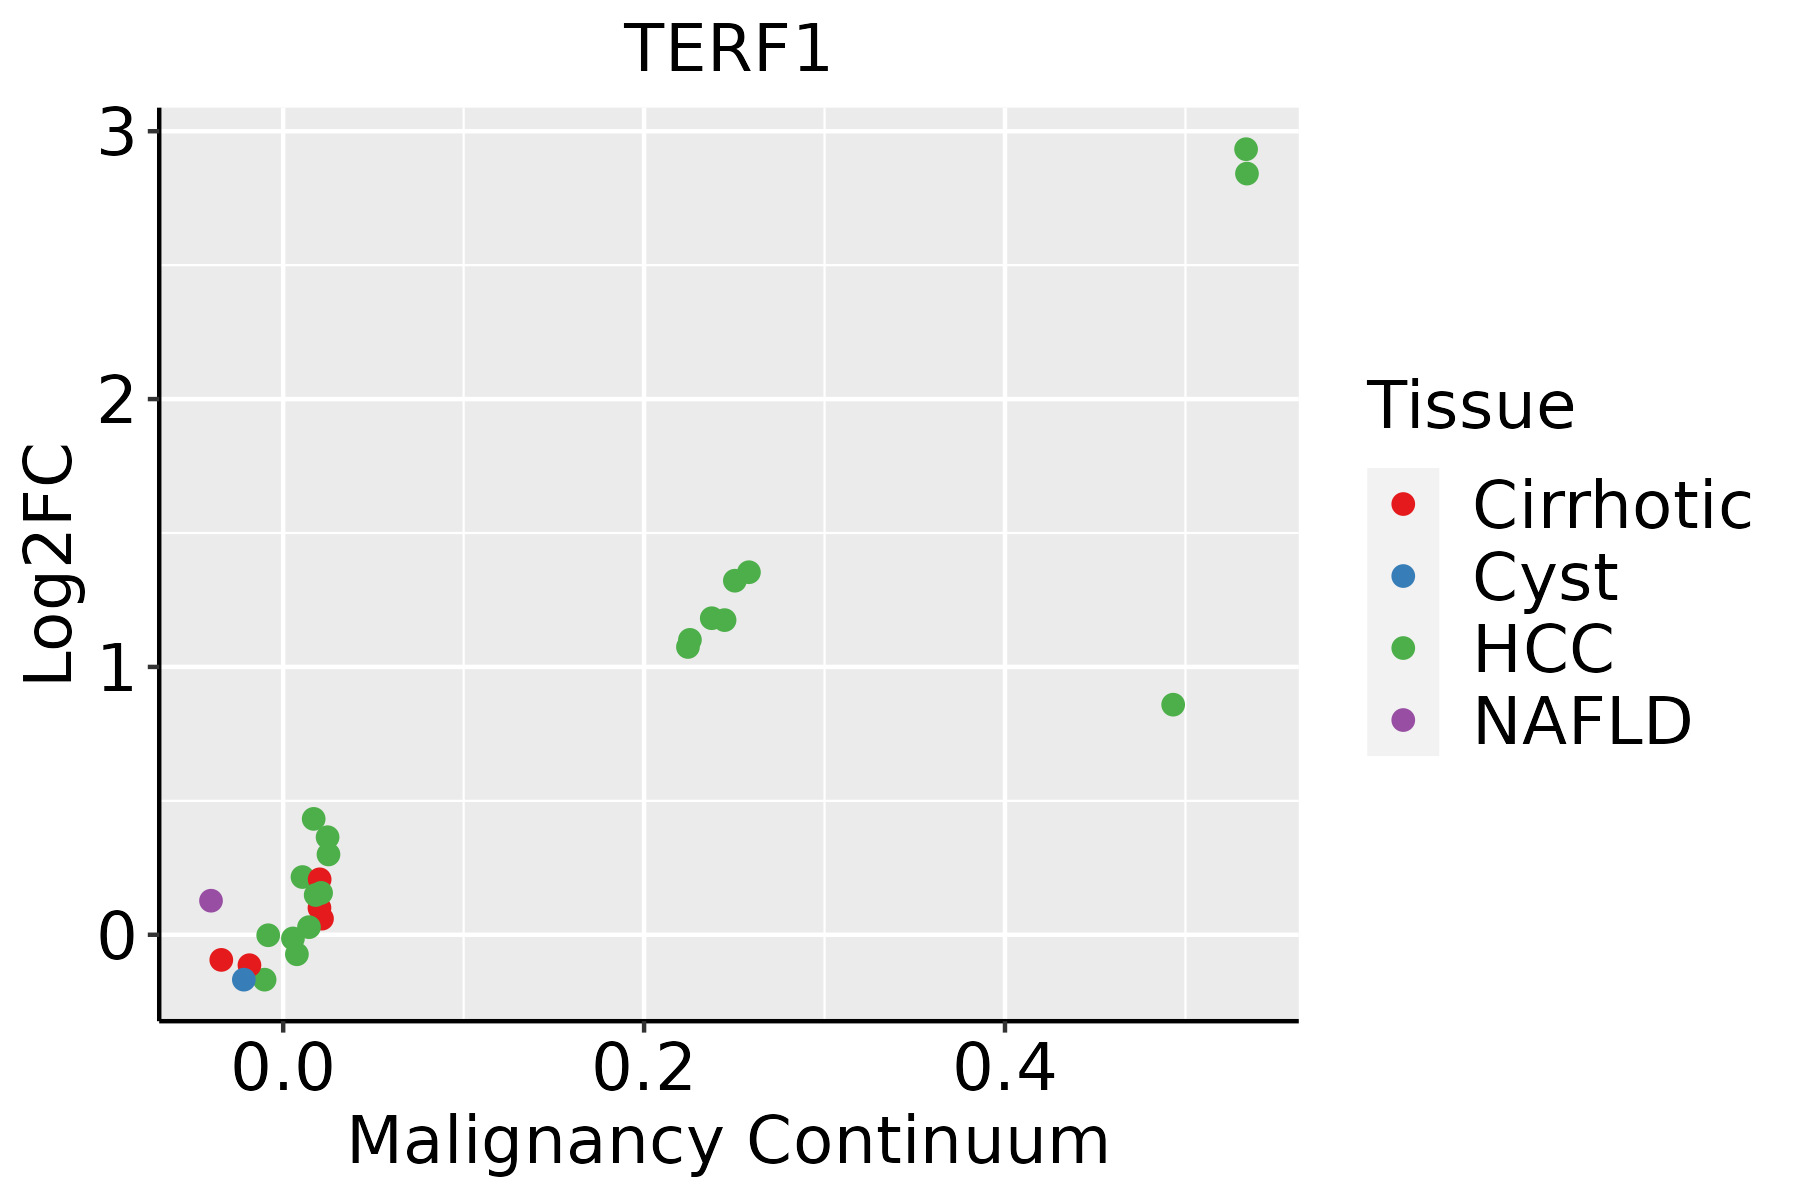
HCC: Hepatocellular carcinoma
NAFLD: Non-alcoholic fatty liver disease
Oral CavityThe image shows the transcriptomic changes along malignancy continuum.log2FC in expression of this searched gene in stem-like cells from each diseased tissue sample relative to stem-like cells in normal samples in each tissue plotted against the malignancy continuum. Samples are colored based on if they are from different disease stage.EOLP: Erosive Oral lichen planus
LP: leukoplakia
NEOLP: Non-erosive oral lichen planus
OSCC: Oral squamous cell carcinoma
SkinThe image shows the transcriptomic changes along malignancy continuum.log2FC in expression of this searched gene in stem-like cells from each diseased tissue sample relative to stem-like cells in normal samples in each tissue plotted against the malignancy continuum. Samples are colored based on if they are from different disease stage.
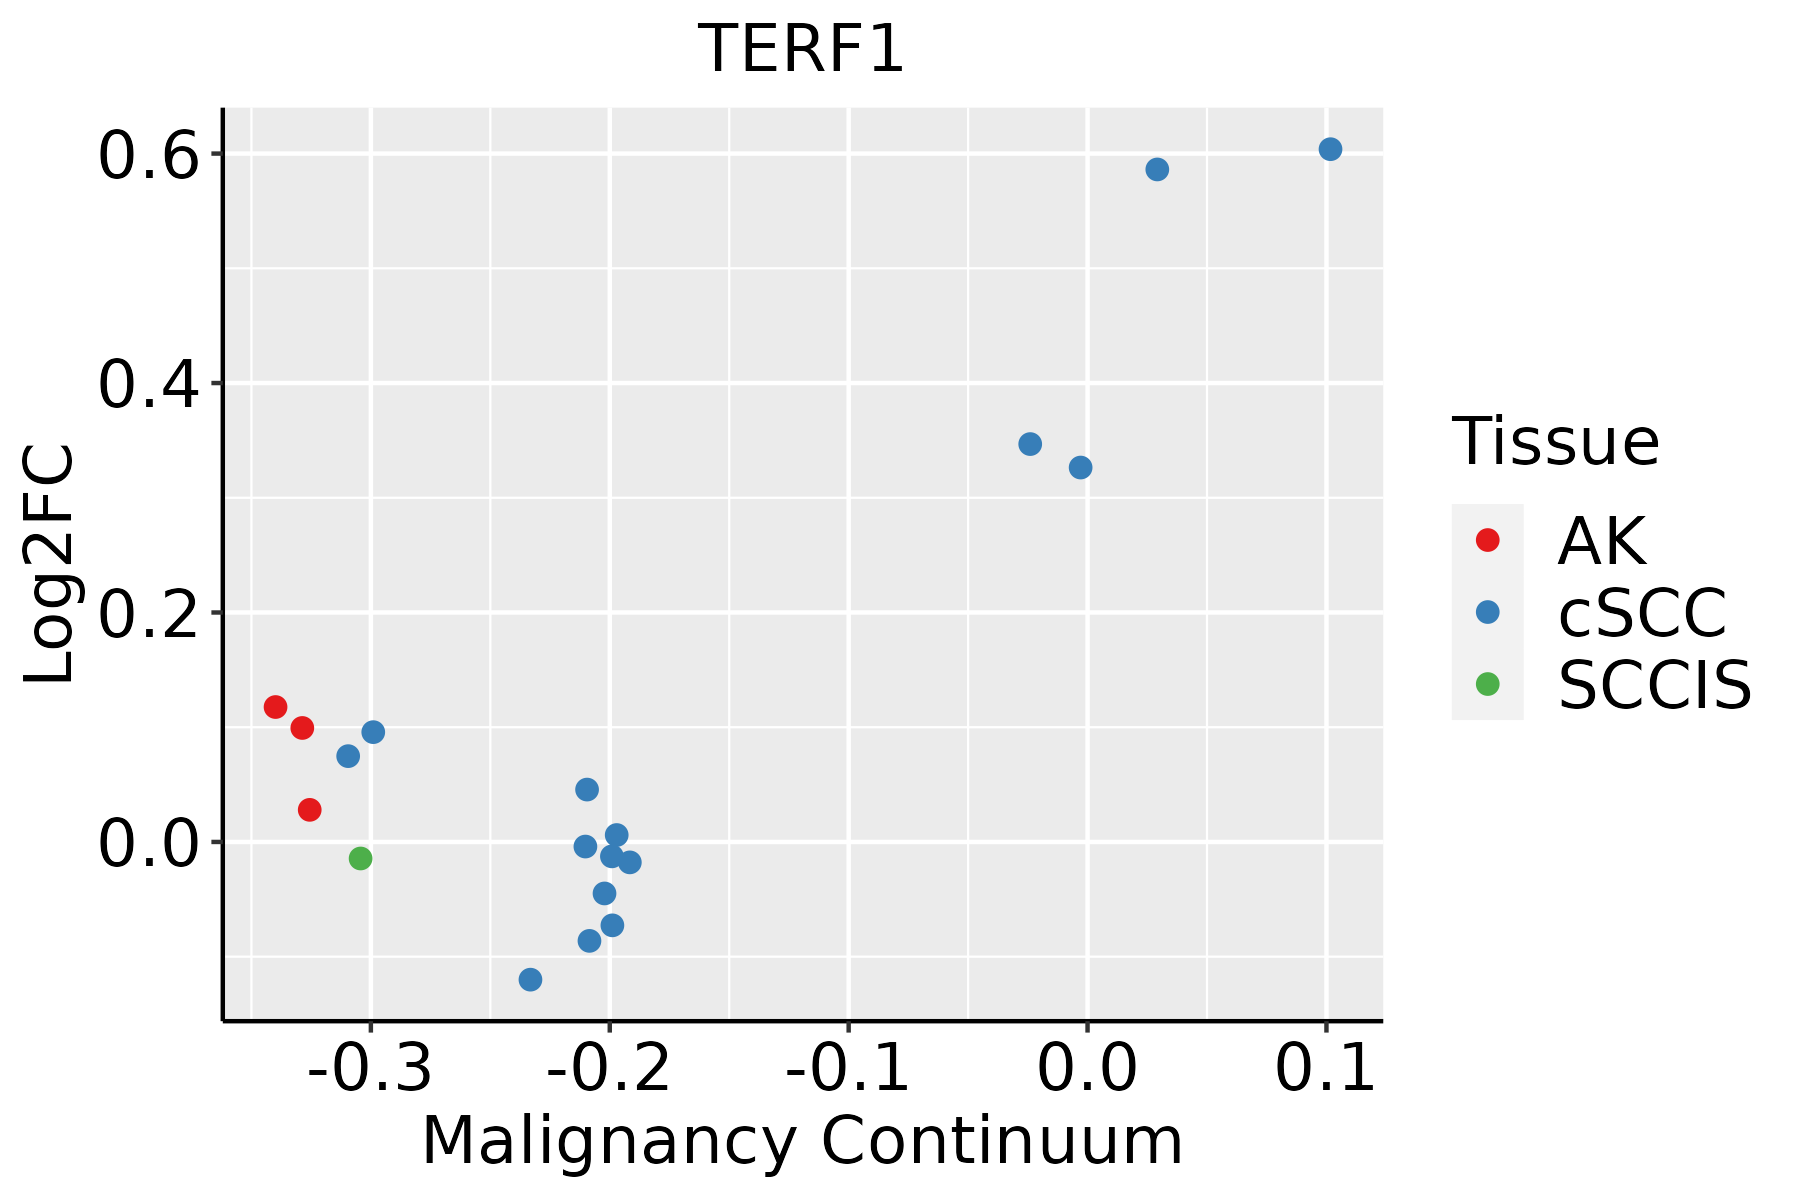
AK: Actinic keratosis
cSCC: Cutaneous squamous cell carcinoma
SCCIS:squamous cell carcinoma in situ
ThyroidThe image shows the transcriptomic changes along malignancy continuum.log2FC in expression of this searched gene in stem-like cells from each diseased tissue sample relative to stem-like cells in normal samples in each tissue plotted against the malignancy continuum. Samples are colored based on if they are from different disease stage.
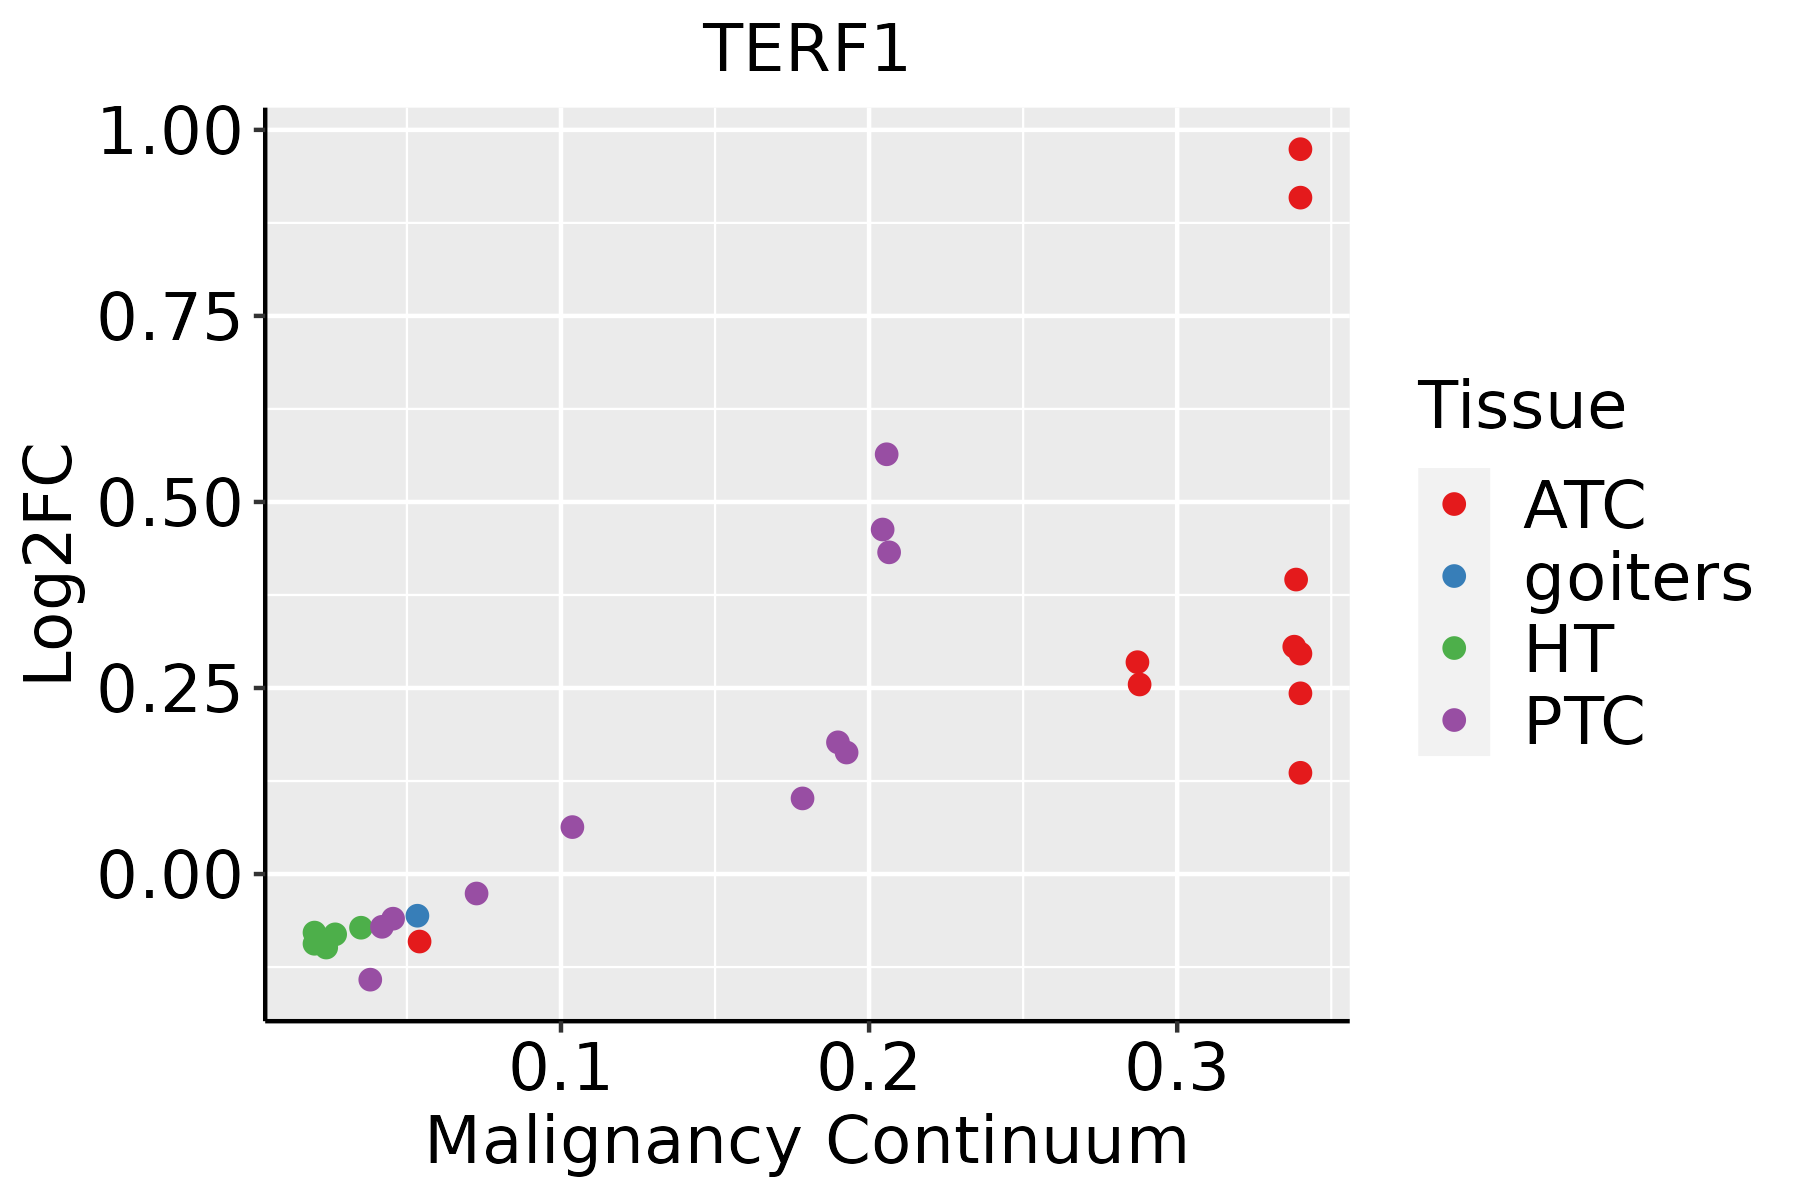
ATC: Anaplastic thyroid cancer
HT: Hashimoto's thyroiditis
PTC: Papillary thyroid cancer
∗log2FC in expression of this searched gene in stem-like cells from each diseased tissue sample relative to stem-like cells in normal samples in each tissue plotted against the malignancy continuum. Samples are colored based on if they are from different disease stage.

Top

Malignant transformation related pathway analysis

check buttonFind out the enriched GO biological processes and KEGG pathways involved in transition from healthy to precancer to cancer
check button Figure of enriched GO biological processes.
TissueDisease StageEnriched GO biological Processes
ColorectumADGO analysis - Figure of enriched GO biological processes: Top 15 enriched GO BP terms are showed in the bar plot of each disease state in each tissue. Each row represents a significant GO biological process which is colored according to the -log10(p.adjust).
ColorectumSERGO analysis - Figure of enriched GO biological processes: Top 15 enriched GO BP terms are showed in the bar plot of each disease state in each tissue. Each row represents a significant GO biological process which is colored according to the -log10(p.adjust).
ColorectumMSSGO analysis - Figure of enriched GO biological processes: Top 15 enriched GO BP terms are showed in the bar plot of each disease state in each tissue. Each row represents a significant GO biological process which is colored according to the -log10(p.adjust).
ColorectumMSI-HGO analysis - Figure of enriched GO biological processes: Top 15 enriched GO BP terms are showed in the bar plot of each disease state in each tissue. Each row represents a significant GO biological process which is colored according to the -log10(p.adjust).
ColorectumFAPGO analysis - Figure of enriched GO biological processes: Top 15 enriched GO BP terms are showed in the bar plot of each disease state in each tissue. Each row represents a significant GO biological process which is colored according to the -log10(p.adjust).
∗Top 15 enriched GO BP terms are showed in the bar plot of each disease state in each tissue. Each row represents a significant GO biological process which is colored according to the -log10(p.adjust).
Page: 1 2 3 4 5 6 7 8 9 

check button Enriched GO biological processes.
GO IDTissueDisease StageDescriptionGene RatioBg Ratiopvaluep.adjustCount
GO:0072594110EsophagusESCCestablishment of protein localization to organelle311/8552422/187233.02e-322.13e-29311
GO:0006403110EsophagusESCCRNA localization166/8552201/187231.95e-276.18e-25166
GO:005165617EsophagusESCCestablishment of organelle localization273/8552390/187239.13e-231.81e-20273
GO:005123617EsophagusESCCestablishment of RNA localization134/8552166/187231.23e-201.81e-18134
GO:003304416EsophagusESCCregulation of chromosome organization145/8552187/187233.80e-194.31e-17145
GO:000705911EsophagusESCCchromosome segregation238/8552346/187231.72e-181.82e-16238
GO:0043254111EsophagusESCCregulation of protein-containing complex assembly278/8552428/187233.81e-162.77e-14278
GO:00062604EsophagusESCCDNA replication181/8552260/187233.55e-152.05e-13181
GO:0031334111EsophagusESCCpositive regulation of protein-containing complex assembly166/8552237/187232.06e-141.07e-12166
GO:005105215EsophagusESCCregulation of DNA metabolic process232/8552359/187232.40e-131.13e-11232
GO:00482853EsophagusESCCorganelle fission301/8552488/187234.64e-132.12e-11301
GO:00988133EsophagusESCCnuclear chromosome segregation187/8552281/187231.00e-124.36e-11187
GO:005130311EsophagusESCCestablishment of chromosome localization67/855280/187231.92e-128.09e-1167
GO:000072319EsophagusESCCtelomere maintenance99/8552131/187232.68e-121.08e-1099
GO:005000011EsophagusESCCchromosome localization68/855282/187233.37e-121.32e-1068
GO:007189716EsophagusESCCDNA biosynthetic process127/8552180/187231.04e-113.85e-10127
GO:0051348111EsophagusESCCnegative regulation of transferase activity177/8552268/187231.08e-114.00e-10177
GO:00002802EsophagusESCCnuclear division270/8552439/187231.17e-114.24e-10270
GO:003220417EsophagusESCCregulation of telomere maintenance65/855280/187236.02e-111.90e-0965
GO:2000278110EsophagusESCCregulation of DNA biosynthetic process81/8552106/187239.81e-112.96e-0981
Page: 1 2 3 4 5 6 7 8 9 10 11 12 13 14 15 16 17 18 

check button Enriched KEGG pathways.
Pathway IDTissueDisease StageDescriptionGene RatioBg Ratiopvaluep.adjustqvalueCount
Page: 1 

Top

Cell-cell communication analysis

check buttonIdentification of potential cell-cell interactions between two cell types and their ligand-receptor pairs for different disease states
LigandReceptorLRpairPathwayTissueDisease Stage
Page: 1 

Top

Single-cell gene regulatory network inference analysis

check buttonFind out the significant the regulons (TFs) and the target genes of each regulon across cell types for different disease states
TFCell TypeTissueDisease StageTarget GeneRSSRegulon Activity
TERF1INMONBreastDCISCYBRD1,ARID3A,NUP98, etc.3.70e-02The dot plots of a searched regulon are shown for all cell subpopulations in each disease state of each tissue based on the regulon specific score inferred using pySCENIC and by calculating the average expression.
TERF1DCBreastPrecancerCYBRD1,ARID3A,NUP98, etc.4.96e-02The dot plots of a searched regulon are shown for all cell subpopulations in each disease state of each tissue based on the regulon specific score inferred using pySCENIC and by calculating the average expression.
TERF1PLALungMIACZNF540,FADS1,ZNF571, etc.6.39e-02The dot plots of a searched regulon are shown for all cell subpopulations in each disease state of each tissue based on the regulon specific score inferred using pySCENIC and by calculating the average expression.
TERF1PARIStomachHealthyKLK12,KCND3,ARFGEF3, etc.2.45e-02The dot plots of a searched regulon are shown for all cell subpopulations in each disease state of each tissue based on the regulon specific score inferred using pySCENIC and by calculating the average expression.
TERF1A.XStomachHealthyKLK12,KCND3,ARFGEF3, etc.2.27e-02The dot plots of a searched regulon are shown for all cell subpopulations in each disease state of each tissue based on the regulon specific score inferred using pySCENIC and by calculating the average expression.
∗The dot plots of a searched regulon are shown for all cell subpopulations in each disease state of each tissue based on the regulon specific score inferred using pySCENIC and by calculating the average expression.
Page: 1 

Top

Somatic mutation of malignant transformation related genes

check buttonAnnotation of somatic variants for genes involved in malignant transformation
Hugo SymbolVariant ClassVariant ClassificationdbSNP RSHGVScHGVSpHGVSp ShortSWISSPROTBIOTYPESIFTPolyPhenTumor Sample BarcodeTissueHistologySexAgeStageTherapy TypesDrugsOutcome
TERF1SNVMissense_Mutationnovelc.1175G>Ap.Arg392Lysp.R392KP54274protein_codingtolerated(1)benign(0.017)TCGA-AC-A5XS-01Breastbreast invasive carcinomaFemale>=65I/IIHormone TherapyfemaraSD
TERF1SNVMissense_Mutationc.1173G>Cp.Leu391Phep.L391FP54274protein_codingdeleterious(0)probably_damaging(0.999)TCGA-E2-A1B5-01Breastbreast invasive carcinomaFemale<65I/IIHormone TherapytamoxiphenSD
TERF1insertionIn_Frame_Insnovelc.680_681insAATGTTGGCCACATGCCTGCAAGTCCCAGCTACp.Phe227delinsLeuMetLeuAlaThrCysLeuGlnValProAlaThrp.F227delinsLMLATCLQVPATP54274protein_codingTCGA-A2-A04Y-01Breastbreast invasive carcinomaFemale<65I/IIChemotherapycytoxanSD
TERF1insertionNonsense_Mutationnovelc.441_442insGGATGTGCTATTTAAAATTCTCTTTp.Ile148GlyfsTer5p.I148Gfs*5P54274protein_codingTCGA-A8-A09X-01Breastbreast invasive carcinomaFemale<65III/IVUnknownUnknownSD
TERF1SNVMissense_Mutationc.490N>Cp.Glu164Glnp.E164QP54274protein_codingtolerated(0.14)benign(0.143)TCGA-IR-A3LH-01Cervixcervical & endocervical cancerFemale<65I/IIChemotherapycisplatinCR
TERF1SNVMissense_Mutationc.1167N>Cp.Lys389Asnp.K389NP54274protein_codingtolerated(0.17)benign(0.438)TCGA-IR-A3LH-01Cervixcervical & endocervical cancerFemale<65I/IIChemotherapycisplatinCR
TERF1SNVMissense_Mutationc.809G>Ap.Arg270Lysp.R270KP54274protein_codingtolerated(0.39)possibly_damaging(0.891)TCGA-JX-A3Q0-01Cervixcervical & endocervical cancerFemale<65III/IVUnknownUnknownSD
TERF1SNVMissense_Mutationc.810A>Tp.Arg270Serp.R270SP54274protein_codingdeleterious(0.05)probably_damaging(0.927)TCGA-JX-A3Q0-01Cervixcervical & endocervical cancerFemale<65III/IVUnknownUnknownSD
TERF1SNVMissense_Mutationrs533827129c.908C>Tp.Ala303Valp.A303VP54274protein_codingtolerated(0.43)benign(0.003)TCGA-A6-5661-01Colorectumcolon adenocarcinomaFemale>=65I/IIUnknownUnknownSD
TERF1SNVMissense_Mutationrs749879752c.1244G>Ap.Arg415Glnp.R415QP54274protein_codingdeleterious(0)probably_damaging(0.998)TCGA-AM-5821-01Colorectumcolon adenocarcinomaFemale>=65I/IIUnknownUnknownSD
Page: 1 2 3 4 5 

Top

Related drugs of malignant transformation related genes

check buttonIdentification of chemicals and drugs interact with genes involved in malignant transfromation
(DGIdb 4.0)
Entrez IDSymbolCategoryInteraction TypesDrug Claim NameDrug NamePMIDs
Page: 1