
|
|||||
|
 | |
| |
| |
| |
| |
| |
|
Gene: TENT5C |
Gene summary for TENT5C |
| Gene information | Species | Human | Gene symbol | TENT5C | Gene ID | 54855 |
| Gene name | terminal nucleotidyltransferase 5C | |
| Gene Alias | FAM46C | |
| Cytomap | 1p12 | |
| Gene Type | protein-coding | GO ID | GO:0001701 | UniProtAcc | Q5VWP2 |
Top |
Malignant transformation analysis |
| Identification of the aberrant gene expression in precancerous and cancerous lesions by comparing the gene expression of stem-like cells in diseased tissues with normal stem cells |
| Entrez ID | Symbol | Replicates | Species | Organ | Tissue | Adj P-value | Log2FC | Malignancy |
| 54855 | TENT5C | S014 | Human | Liver | HCC | 2.58e-37 | 1.23e+00 | 0.2254 |
| 54855 | TENT5C | S015 | Human | Liver | HCC | 2.11e-29 | 1.40e+00 | 0.2375 |
| 54855 | TENT5C | S016 | Human | Liver | HCC | 7.67e-38 | 1.07e+00 | 0.2243 |
| 54855 | TENT5C | TD9 | Human | Lung | IAC | 1.26e-09 | 1.09e+00 | 0.088 |
| 54855 | TENT5C | RNA-P10T2-P10T2-2 | Human | Lung | AAH | 7.31e-03 | 5.74e-01 | -0.1406 |
| 54855 | TENT5C | RNA-P10T2-P10T2-4 | Human | Lung | AAH | 5.54e-03 | 5.04e-01 | -0.138 |
| 54855 | TENT5C | RNA-P6T2-P6T2-2 | Human | Lung | IAC | 3.12e-03 | 1.95e-01 | -0.0132 |
| 54855 | TENT5C | RNA-P6T2-P6T2-3 | Human | Lung | IAC | 3.91e-04 | 2.21e-01 | -0.013 |
| 54855 | TENT5C | RNA-P6T2-P6T2-4 | Human | Lung | IAC | 6.25e-03 | 2.00e-01 | -0.0121 |
| Page: 1 |
| Tissue | Expression Dynamics | Abbreviation |
| Liver | 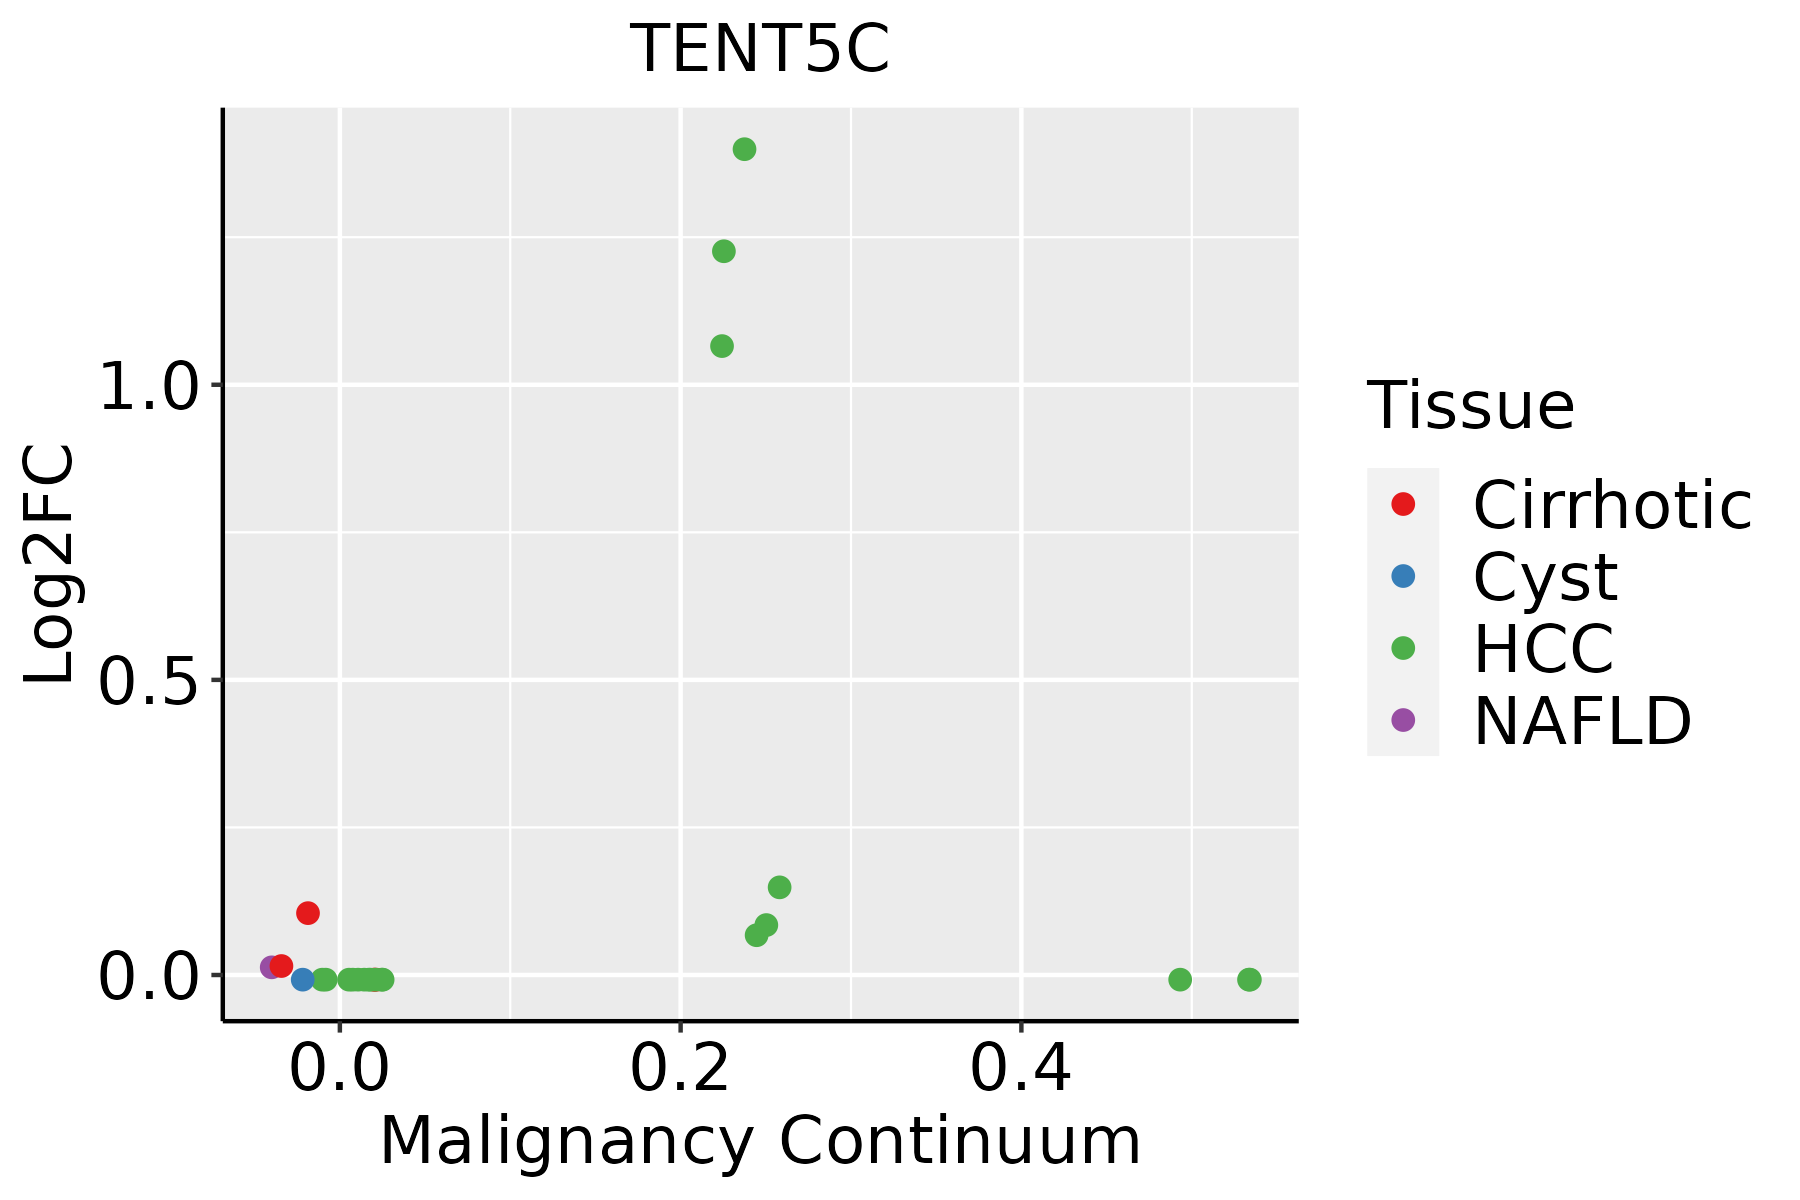 | HCC: Hepatocellular carcinoma |
| NAFLD: Non-alcoholic fatty liver disease | ||
| Lung |  | AAH: Atypical adenomatous hyperplasia |
| AIS: Adenocarcinoma in situ | ||
| IAC: Invasive lung adenocarcinoma | ||
| MIA: Minimally invasive adenocarcinoma |
| ∗log2FC in expression of this searched gene in stem-like cells from each diseased tissue sample relative to stem-like cells in normal samples in each tissue plotted against the malignancy continuum. Samples are colored based on if they are from different disease stage. |
Top |
Malignant transformation related pathway analysis |
| Find out the enriched GO biological processes and KEGG pathways involved in transition from healthy to precancer to cancer |
| Tissue | Disease Stage | Enriched GO biological Processes |
| Colorectum | AD |  |
| Colorectum | SER |  |
| Colorectum | MSS |  |
| Colorectum | MSI-H |  |
| Colorectum | FAP |  |
| ∗Top 15 enriched GO BP terms are showed in the bar plot of each disease state in each tissue. Each row represents a significant GO biological process which is colored according to the -log10(p.adjust). |
| Page: 1 2 3 4 5 6 7 8 9 |
| GO ID | Tissue | Disease Stage | Description | Gene Ratio | Bg Ratio | pvalue | p.adjust | Count |
| GO:004427021 | Liver | HCC | cellular nitrogen compound catabolic process | 303/7958 | 451/18723 | 9.76e-27 | 3.64e-24 | 303 |
| GO:004670021 | Liver | HCC | heterocycle catabolic process | 299/7958 | 445/18723 | 2.07e-26 | 7.29e-24 | 299 |
| GO:190136121 | Liver | HCC | organic cyclic compound catabolic process | 325/7958 | 495/18723 | 6.52e-26 | 2.18e-23 | 325 |
| GO:001943921 | Liver | HCC | aromatic compound catabolic process | 309/7958 | 467/18723 | 1.56e-25 | 4.94e-23 | 309 |
| GO:000640121 | Liver | HCC | RNA catabolic process | 201/7958 | 278/18723 | 3.88e-24 | 1.02e-21 | 201 |
| GO:003465521 | Liver | HCC | nucleobase-containing compound catabolic process | 273/7958 | 407/18723 | 4.84e-24 | 1.23e-21 | 273 |
| GO:190331121 | Liver | HCC | regulation of mRNA metabolic process | 205/7958 | 288/18723 | 3.38e-23 | 6.90e-21 | 205 |
| GO:000640221 | Liver | HCC | mRNA catabolic process | 169/7958 | 232/18723 | 4.50e-21 | 6.96e-19 | 169 |
| GO:004348721 | Liver | HCC | regulation of RNA stability | 119/7958 | 170/18723 | 3.20e-13 | 1.71e-11 | 119 |
| GO:004348821 | Liver | HCC | regulation of mRNA stability | 110/7958 | 158/18723 | 4.36e-12 | 1.93e-10 | 110 |
| GO:006101321 | Liver | HCC | regulation of mRNA catabolic process | 114/7958 | 166/18723 | 7.38e-12 | 3.12e-10 | 114 |
| GO:000989522 | Liver | HCC | negative regulation of catabolic process | 196/7958 | 320/18723 | 7.98e-12 | 3.35e-10 | 196 |
| GO:003133022 | Liver | HCC | negative regulation of cellular catabolic process | 164/7958 | 262/18723 | 3.52e-11 | 1.35e-09 | 164 |
| GO:000170111 | Liver | HCC | in utero embryonic development | 204/7958 | 367/18723 | 2.44e-07 | 4.30e-06 | 204 |
| GO:190331222 | Liver | HCC | negative regulation of mRNA metabolic process | 63/7958 | 92/18723 | 4.14e-07 | 6.97e-06 | 63 |
| GO:190236921 | Liver | HCC | negative regulation of RNA catabolic process | 45/7958 | 75/18723 | 1.67e-03 | 8.73e-03 | 45 |
| GO:004348921 | Liver | HCC | RNA stabilization | 39/7958 | 65/18723 | 3.31e-03 | 1.51e-02 | 39 |
| GO:190237311 | Liver | HCC | negative regulation of mRNA catabolic process | 37/7958 | 63/18723 | 6.82e-03 | 2.73e-02 | 37 |
| GO:004825511 | Liver | HCC | mRNA stabilization | 33/7958 | 56/18723 | 9.64e-03 | 3.63e-02 | 33 |
| GO:19033117 | Lung | IAC | regulation of mRNA metabolic process | 71/2061 | 288/18723 | 3.76e-11 | 1.24e-08 | 71 |
| Page: 1 2 3 |
| Pathway ID | Tissue | Disease Stage | Description | Gene Ratio | Bg Ratio | pvalue | p.adjust | qvalue | Count |
| Page: 1 |
Top |
Cell-cell communication analysis |
| Identification of potential cell-cell interactions between two cell types and their ligand-receptor pairs for different disease states |
| Ligand | Receptor | LRpair | Pathway | Tissue | Disease Stage |
| Page: 1 |
Top |
Single-cell gene regulatory network inference analysis |
| Find out the significant the regulons (TFs) and the target genes of each regulon across cell types for different disease states |
| TF | Cell Type | Tissue | Disease Stage | Target Gene | RSS | Regulon Activity |
| ∗The dot plots of a searched regulon are shown for all cell subpopulations in each disease state of each tissue based on the regulon specific score inferred using pySCENIC and by calculating the average expression. |
| Page: 1 |
Top |
Somatic mutation of malignant transformation related genes |
| Annotation of somatic variants for genes involved in malignant transformation |
| Hugo Symbol | Variant Class | Variant Classification | dbSNP RS | HGVSc | HGVSp | HGVSp Short | SWISSPROT | BIOTYPE | SIFT | PolyPhen | Tumor Sample Barcode | Tissue | Histology | Sex | Age | Stage | Therapy Types | Drugs | Outcome |
| Page: 1 |
Top |
Related drugs of malignant transformation related genes |
| Identification of chemicals and drugs interact with genes involved in malignant transfromation |
| (DGIdb 4.0) |
| Entrez ID | Symbol | Category | Interaction Types | Drug Claim Name | Drug Name | PMIDs |
| Page: 1 |

Copyright 2023-Present -The University of Texas Health Science Center at Houston |