
|
|||||
|
 | |
| |
| |
| |
| |
| |
|
Gene: TENT4A |
Gene summary for TENT4A |
| Gene information | Species | Human | Gene symbol | TENT4A | Gene ID | 11044 |
| Gene name | terminal nucleotidyltransferase 4A | |
| Gene Alias | LAK-1 | |
| Cytomap | 5p15.31 | |
| Gene Type | protein-coding | GO ID | GO:0000070 | UniProtAcc | B7ZLL4 |
Top |
Malignant transformation analysis |
| Identification of the aberrant gene expression in precancerous and cancerous lesions by comparing the gene expression of stem-like cells in diseased tissues with normal stem cells |
| Entrez ID | Symbol | Replicates | Species | Organ | Tissue | Adj P-value | Log2FC | Malignancy |
| 11044 | TENT4A | CCI_2 | Human | Cervix | CC | 1.39e-09 | 7.10e-01 | 0.5249 |
| 11044 | TENT4A | CCI_3 | Human | Cervix | CC | 7.65e-12 | 7.66e-01 | 0.516 |
| 11044 | TENT4A | male-WTA | Human | Thyroid | PTC | 1.28e-06 | 1.28e-01 | 0.1037 |
| 11044 | TENT4A | PTC04 | Human | Thyroid | PTC | 2.12e-13 | 2.88e-01 | 0.1927 |
| 11044 | TENT4A | PTC05 | Human | Thyroid | PTC | 1.26e-11 | 3.54e-01 | 0.2065 |
| 11044 | TENT4A | PTC06 | Human | Thyroid | PTC | 1.25e-13 | 3.24e-01 | 0.2057 |
| 11044 | TENT4A | PTC07 | Human | Thyroid | PTC | 2.48e-11 | 2.08e-01 | 0.2044 |
| 11044 | TENT4A | ATC09 | Human | Thyroid | ATC | 4.52e-12 | 3.80e-01 | 0.2871 |
| 11044 | TENT4A | ATC12 | Human | Thyroid | ATC | 1.90e-14 | 3.04e-01 | 0.34 |
| 11044 | TENT4A | ATC13 | Human | Thyroid | ATC | 1.14e-29 | 5.20e-01 | 0.34 |
| 11044 | TENT4A | ATC1 | Human | Thyroid | ATC | 2.05e-14 | 4.64e-01 | 0.2878 |
| 11044 | TENT4A | ATC2 | Human | Thyroid | ATC | 4.44e-15 | 9.53e-01 | 0.34 |
| 11044 | TENT4A | ATC3 | Human | Thyroid | ATC | 6.48e-06 | 3.22e-01 | 0.338 |
| 11044 | TENT4A | ATC4 | Human | Thyroid | ATC | 1.37e-20 | 3.93e-01 | 0.34 |
| 11044 | TENT4A | ATC5 | Human | Thyroid | ATC | 4.37e-34 | 5.69e-01 | 0.34 |
| Page: 1 |
| Tissue | Expression Dynamics | Abbreviation |
| Cervix |  | CC: Cervix cancer |
| HSIL_HPV: HPV-infected high-grade squamous intraepithelial lesions | ||
| N_HPV: HPV-infected normal cervix | ||
| Thyroid | 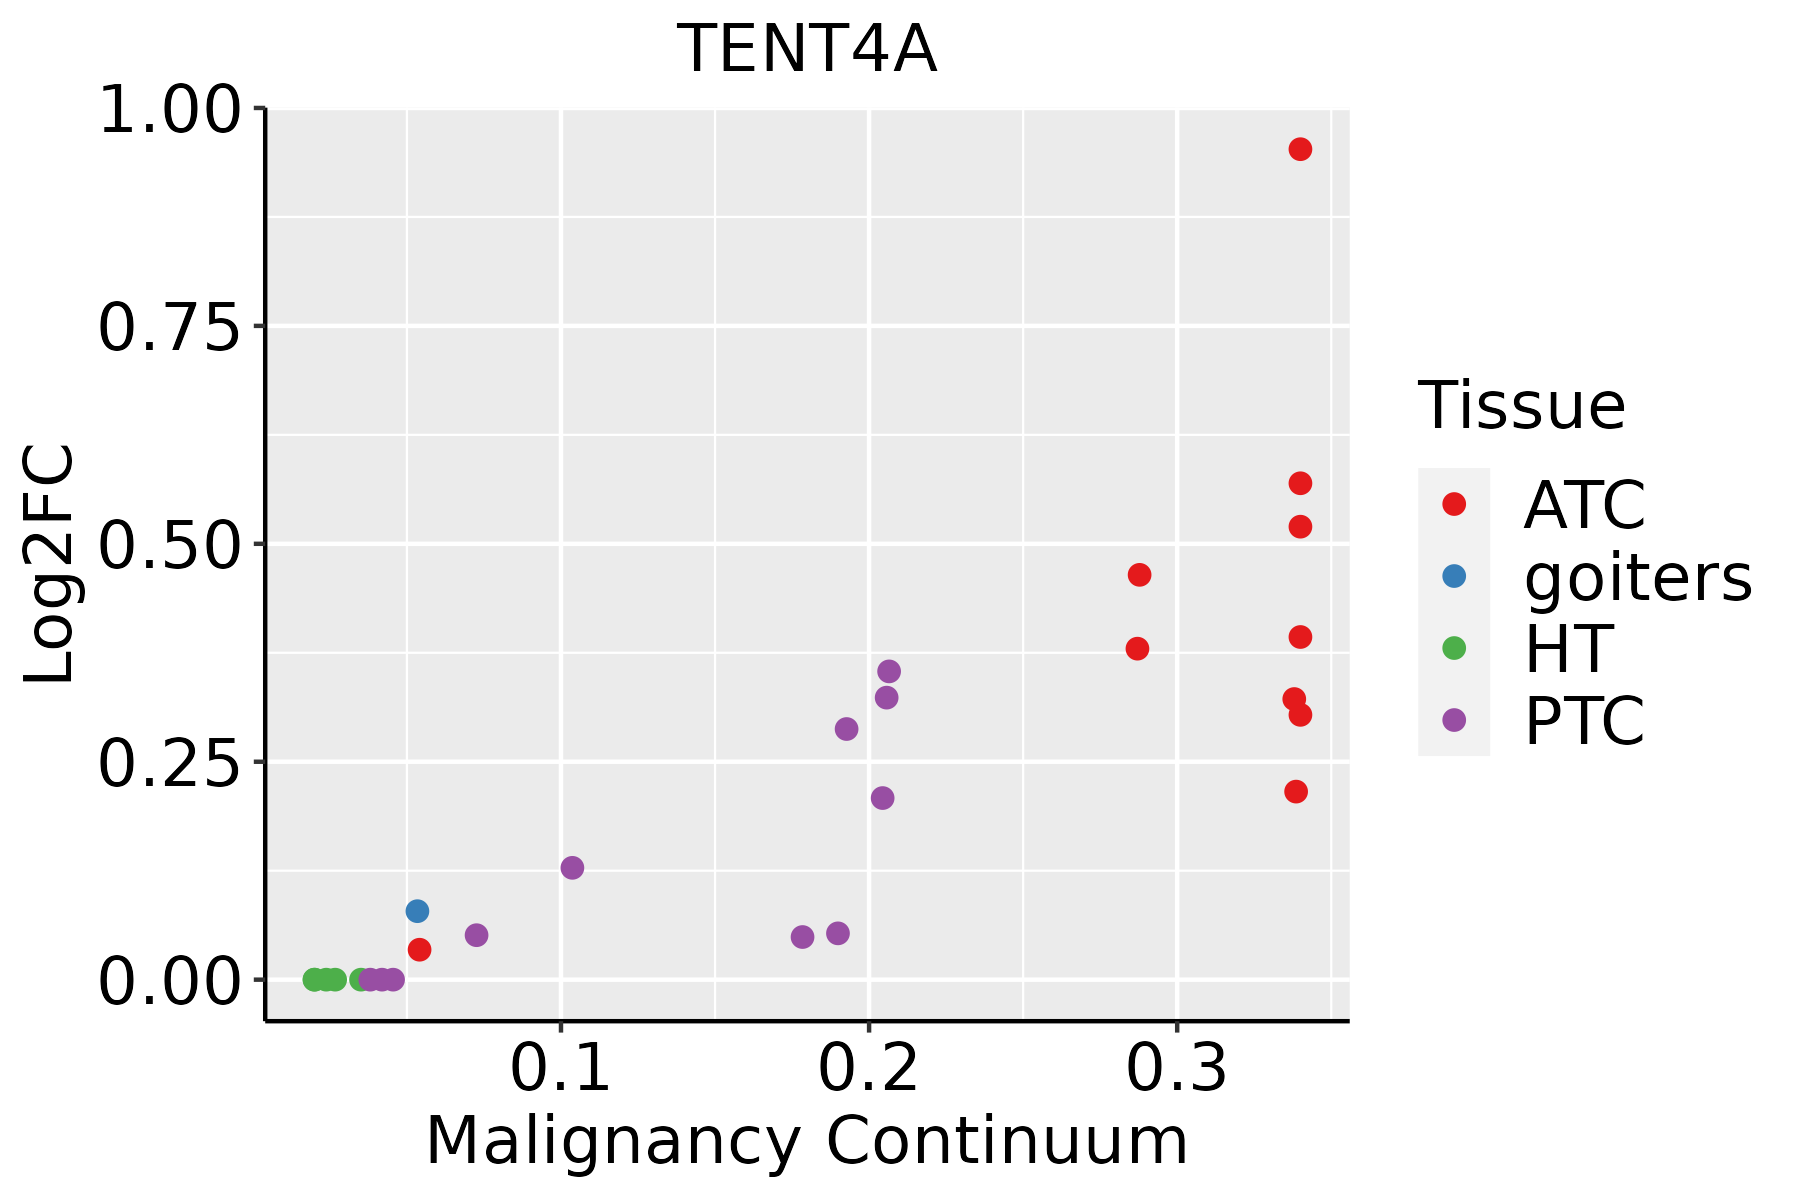 | ATC: Anaplastic thyroid cancer |
| HT: Hashimoto's thyroiditis | ||
| PTC: Papillary thyroid cancer |
| ∗log2FC in expression of this searched gene in stem-like cells from each diseased tissue sample relative to stem-like cells in normal samples in each tissue plotted against the malignancy continuum. Samples are colored based on if they are from different disease stage. |
Top |
Malignant transformation related pathway analysis |
| Find out the enriched GO biological processes and KEGG pathways involved in transition from healthy to precancer to cancer |
| Tissue | Disease Stage | Enriched GO biological Processes |
| Colorectum | AD |  |
| Colorectum | SER |  |
| Colorectum | MSS |  |
| Colorectum | MSI-H |  |
| Colorectum | FAP |  |
| ∗Top 15 enriched GO BP terms are showed in the bar plot of each disease state in each tissue. Each row represents a significant GO biological process which is colored according to the -log10(p.adjust). |
| Page: 1 2 3 4 5 6 7 8 9 |
| GO ID | Tissue | Disease Stage | Description | Gene Ratio | Bg Ratio | pvalue | p.adjust | Count |
| GO:000989610 | Cervix | CC | positive regulation of catabolic process | 109/2311 | 492/18723 | 5.26e-10 | 6.99e-08 | 109 |
| GO:003133110 | Cervix | CC | positive regulation of cellular catabolic process | 91/2311 | 427/18723 | 9.64e-08 | 5.25e-06 | 91 |
| GO:003133010 | Cervix | CC | negative regulation of cellular catabolic process | 63/2311 | 262/18723 | 1.10e-07 | 5.68e-06 | 63 |
| GO:00064029 | Cervix | CC | mRNA catabolic process | 56/2311 | 232/18723 | 4.81e-07 | 1.83e-05 | 56 |
| GO:19001517 | Cervix | CC | regulation of nuclear-transcribed mRNA catabolic process, deadenylation-dependent decay | 11/2311 | 18/18723 | 1.37e-06 | 4.55e-05 | 11 |
| GO:19033119 | Cervix | CC | regulation of mRNA metabolic process | 64/2311 | 288/18723 | 1.71e-06 | 5.64e-05 | 64 |
| GO:000989510 | Cervix | CC | negative regulation of catabolic process | 69/2311 | 320/18723 | 2.15e-06 | 6.55e-05 | 69 |
| GO:00064019 | Cervix | CC | RNA catabolic process | 62/2311 | 278/18723 | 2.18e-06 | 6.56e-05 | 62 |
| GO:003425010 | Cervix | CC | positive regulation of cellular amide metabolic process | 40/2311 | 162/18723 | 1.11e-05 | 2.41e-04 | 40 |
| GO:00002896 | Cervix | CC | nuclear-transcribed mRNA poly(A) tail shortening | 13/2311 | 29/18723 | 1.48e-05 | 2.93e-04 | 13 |
| GO:00602119 | Cervix | CC | regulation of nuclear-transcribed mRNA poly(A) tail shortening | 9/2311 | 15/18723 | 1.63e-05 | 3.17e-04 | 9 |
| GO:000641710 | Cervix | CC | regulation of translation | 89/2311 | 468/18723 | 1.86e-05 | 3.46e-04 | 89 |
| GO:00009567 | Cervix | CC | nuclear-transcribed mRNA catabolic process | 30/2311 | 112/18723 | 2.60e-05 | 4.37e-04 | 30 |
| GO:00002886 | Cervix | CC | nuclear-transcribed mRNA catabolic process, deadenylation-dependent decay | 18/2311 | 56/18723 | 8.42e-05 | 1.13e-03 | 18 |
| GO:004572710 | Cervix | CC | positive regulation of translation | 33/2311 | 136/18723 | 9.09e-05 | 1.20e-03 | 33 |
| GO:00610139 | Cervix | CC | regulation of mRNA catabolic process | 38/2311 | 166/18723 | 1.07e-04 | 1.36e-03 | 38 |
| GO:19033136 | Cervix | CC | positive regulation of mRNA metabolic process | 29/2311 | 118/18723 | 1.86e-04 | 2.18e-03 | 29 |
| GO:190331210 | Cervix | CC | negative regulation of mRNA metabolic process | 24/2311 | 92/18723 | 2.49e-04 | 2.77e-03 | 24 |
| GO:00467008 | Cervix | CC | heterocycle catabolic process | 80/2311 | 445/18723 | 3.23e-04 | 3.42e-03 | 80 |
| GO:00346559 | Cervix | CC | nucleobase-containing compound catabolic process | 74/2311 | 407/18723 | 3.77e-04 | 3.88e-03 | 74 |
| Page: 1 2 3 4 5 6 7 |
| Pathway ID | Tissue | Disease Stage | Description | Gene Ratio | Bg Ratio | pvalue | p.adjust | qvalue | Count |
| Page: 1 |
Top |
Cell-cell communication analysis |
| Identification of potential cell-cell interactions between two cell types and their ligand-receptor pairs for different disease states |
| Ligand | Receptor | LRpair | Pathway | Tissue | Disease Stage |
| Page: 1 |
Top |
Single-cell gene regulatory network inference analysis |
| Find out the significant the regulons (TFs) and the target genes of each regulon across cell types for different disease states |
| TF | Cell Type | Tissue | Disease Stage | Target Gene | RSS | Regulon Activity |
| ∗The dot plots of a searched regulon are shown for all cell subpopulations in each disease state of each tissue based on the regulon specific score inferred using pySCENIC and by calculating the average expression. |
| Page: 1 |
Top |
Somatic mutation of malignant transformation related genes |
| Annotation of somatic variants for genes involved in malignant transformation |
| Hugo Symbol | Variant Class | Variant Classification | dbSNP RS | HGVSc | HGVSp | HGVSp Short | SWISSPROT | BIOTYPE | SIFT | PolyPhen | Tumor Sample Barcode | Tissue | Histology | Sex | Age | Stage | Therapy Types | Drugs | Outcome |
| Page: 1 |
Top |
Related drugs of malignant transformation related genes |
| Identification of chemicals and drugs interact with genes involved in malignant transfromation |
| (DGIdb 4.0) |
| Entrez ID | Symbol | Category | Interaction Types | Drug Claim Name | Drug Name | PMIDs |
| 11044 | TENT4A | NA | gemcitabine | GEMCITABINE | 22838950 |
| Page: 1 |

Copyright 2023-Present -The University of Texas Health Science Center at Houston |