
|
|||||
|
 | |
| |
| |
| |
| |
| |
|
Gene: TENT2 |
Gene summary for TENT2 |
| Gene information | Species | Human | Gene symbol | TENT2 | Gene ID | 167153 |
| Gene name | terminal nucleotidyltransferase 2 | |
| Gene Alias | APD4 | |
| Cytomap | 5q14.1 | |
| Gene Type | protein-coding | GO ID | GO:0000956 | UniProtAcc | Q6PIY7 |
Top |
Malignant transformation analysis |
| Identification of the aberrant gene expression in precancerous and cancerous lesions by comparing the gene expression of stem-like cells in diseased tissues with normal stem cells |
| Entrez ID | Symbol | Replicates | Species | Organ | Tissue | Adj P-value | Log2FC | Malignancy |
| 167153 | TENT2 | CCI_2 | Human | Cervix | CC | 2.09e-12 | 1.41e+00 | 0.5249 |
| 167153 | TENT2 | CCI_3 | Human | Cervix | CC | 6.54e-10 | 7.69e-01 | 0.516 |
| 167153 | TENT2 | Tumor | Human | Cervix | CC | 4.20e-08 | -2.07e-01 | 0.1241 |
| 167153 | TENT2 | HTA11_3410_2000001011 | Human | Colorectum | AD | 5.93e-16 | -5.94e-01 | 0.0155 |
| 167153 | TENT2 | HTA11_2487_2000001011 | Human | Colorectum | SER | 3.55e-04 | -5.18e-01 | -0.1808 |
| 167153 | TENT2 | HTA11_3361_2000001011 | Human | Colorectum | AD | 6.98e-05 | -5.62e-01 | -0.1207 |
| 167153 | TENT2 | HTA11_83_2000001011 | Human | Colorectum | SER | 3.57e-04 | -5.23e-01 | -0.1526 |
| 167153 | TENT2 | HTA11_696_2000001011 | Human | Colorectum | AD | 1.00e-14 | -5.00e-01 | -0.1464 |
| 167153 | TENT2 | HTA11_866_3004761011 | Human | Colorectum | AD | 2.08e-17 | -5.52e-01 | 0.096 |
| 167153 | TENT2 | HTA11_4255_2000001011 | Human | Colorectum | SER | 4.50e-02 | -7.51e-01 | 0.0446 |
| 167153 | TENT2 | HTA11_7696_3000711011 | Human | Colorectum | AD | 7.65e-10 | -5.08e-01 | 0.0674 |
| 167153 | TENT2 | HTA11_6818_2000001021 | Human | Colorectum | AD | 4.13e-06 | -4.84e-01 | 0.0588 |
| 167153 | TENT2 | HTA11_99999970781_79442 | Human | Colorectum | MSS | 1.13e-53 | -8.82e-01 | 0.294 |
| 167153 | TENT2 | HTA11_99999965104_69814 | Human | Colorectum | MSS | 1.20e-19 | -8.82e-01 | 0.281 |
| 167153 | TENT2 | HTA11_99999971662_82457 | Human | Colorectum | MSS | 9.08e-52 | -8.82e-01 | 0.3859 |
| 167153 | TENT2 | HTA11_99999973899_84307 | Human | Colorectum | MSS | 2.59e-15 | -8.82e-01 | 0.2585 |
| 167153 | TENT2 | HTA11_99999974143_84620 | Human | Colorectum | MSS | 1.23e-54 | -8.82e-01 | 0.3005 |
| 167153 | TENT2 | A001-C-207 | Human | Colorectum | FAP | 1.63e-04 | -3.30e-01 | 0.1278 |
| 167153 | TENT2 | A015-C-203 | Human | Colorectum | FAP | 2.61e-33 | -4.95e-01 | -0.1294 |
| 167153 | TENT2 | A015-C-204 | Human | Colorectum | FAP | 1.00e-08 | -4.10e-01 | -0.0228 |
| Page: 1 2 3 4 5 6 |
| Tissue | Expression Dynamics | Abbreviation |
| Cervix |  | CC: Cervix cancer |
| HSIL_HPV: HPV-infected high-grade squamous intraepithelial lesions | ||
| N_HPV: HPV-infected normal cervix | ||
| Colorectum (GSE201348) |  | FAP: Familial adenomatous polyposis |
| CRC: Colorectal cancer | ||
| Colorectum (HTA11) |  | AD: Adenomas |
| SER: Sessile serrated lesions | ||
| MSI-H: Microsatellite-high colorectal cancer | ||
| MSS: Microsatellite stable colorectal cancer | ||
| Endometrium | 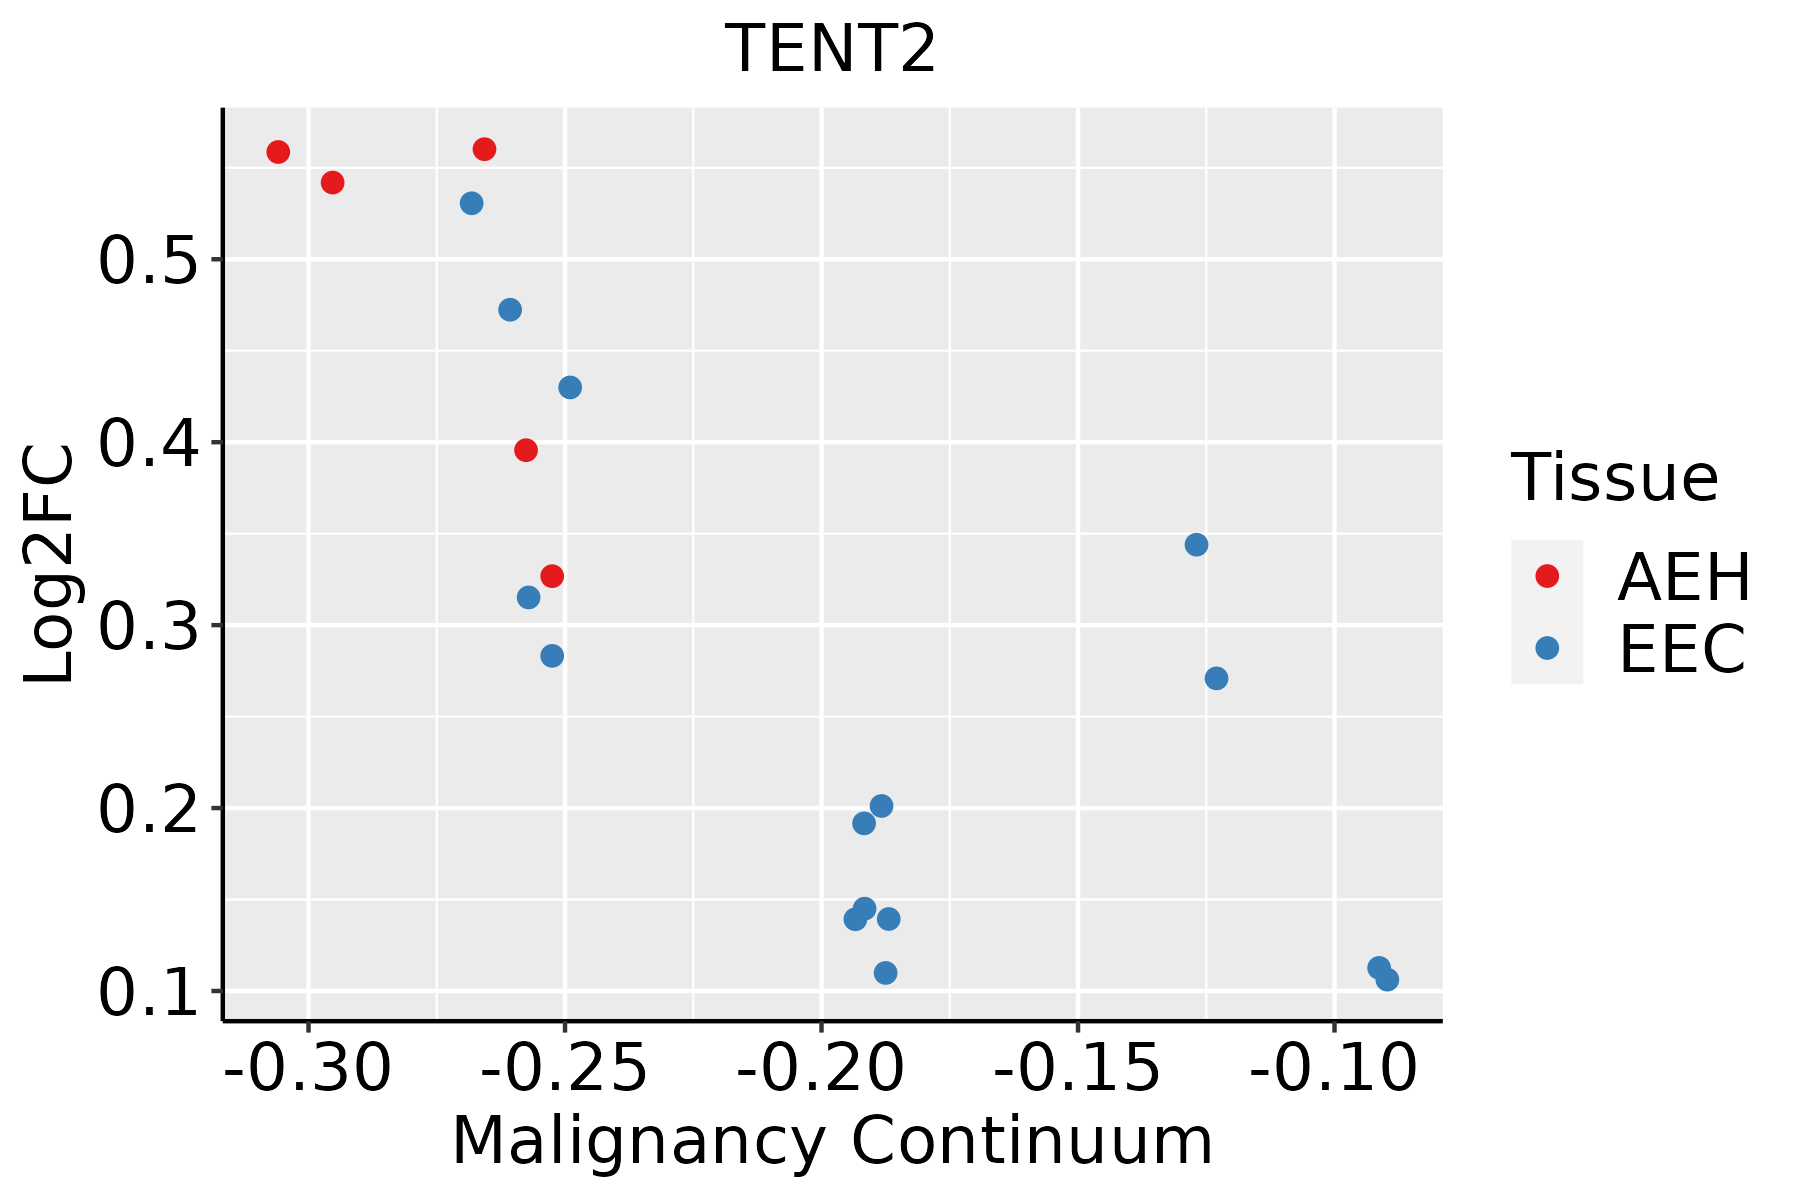 | AEH: Atypical endometrial hyperplasia |
| EEC: Endometrioid Cancer | ||
| Lung | 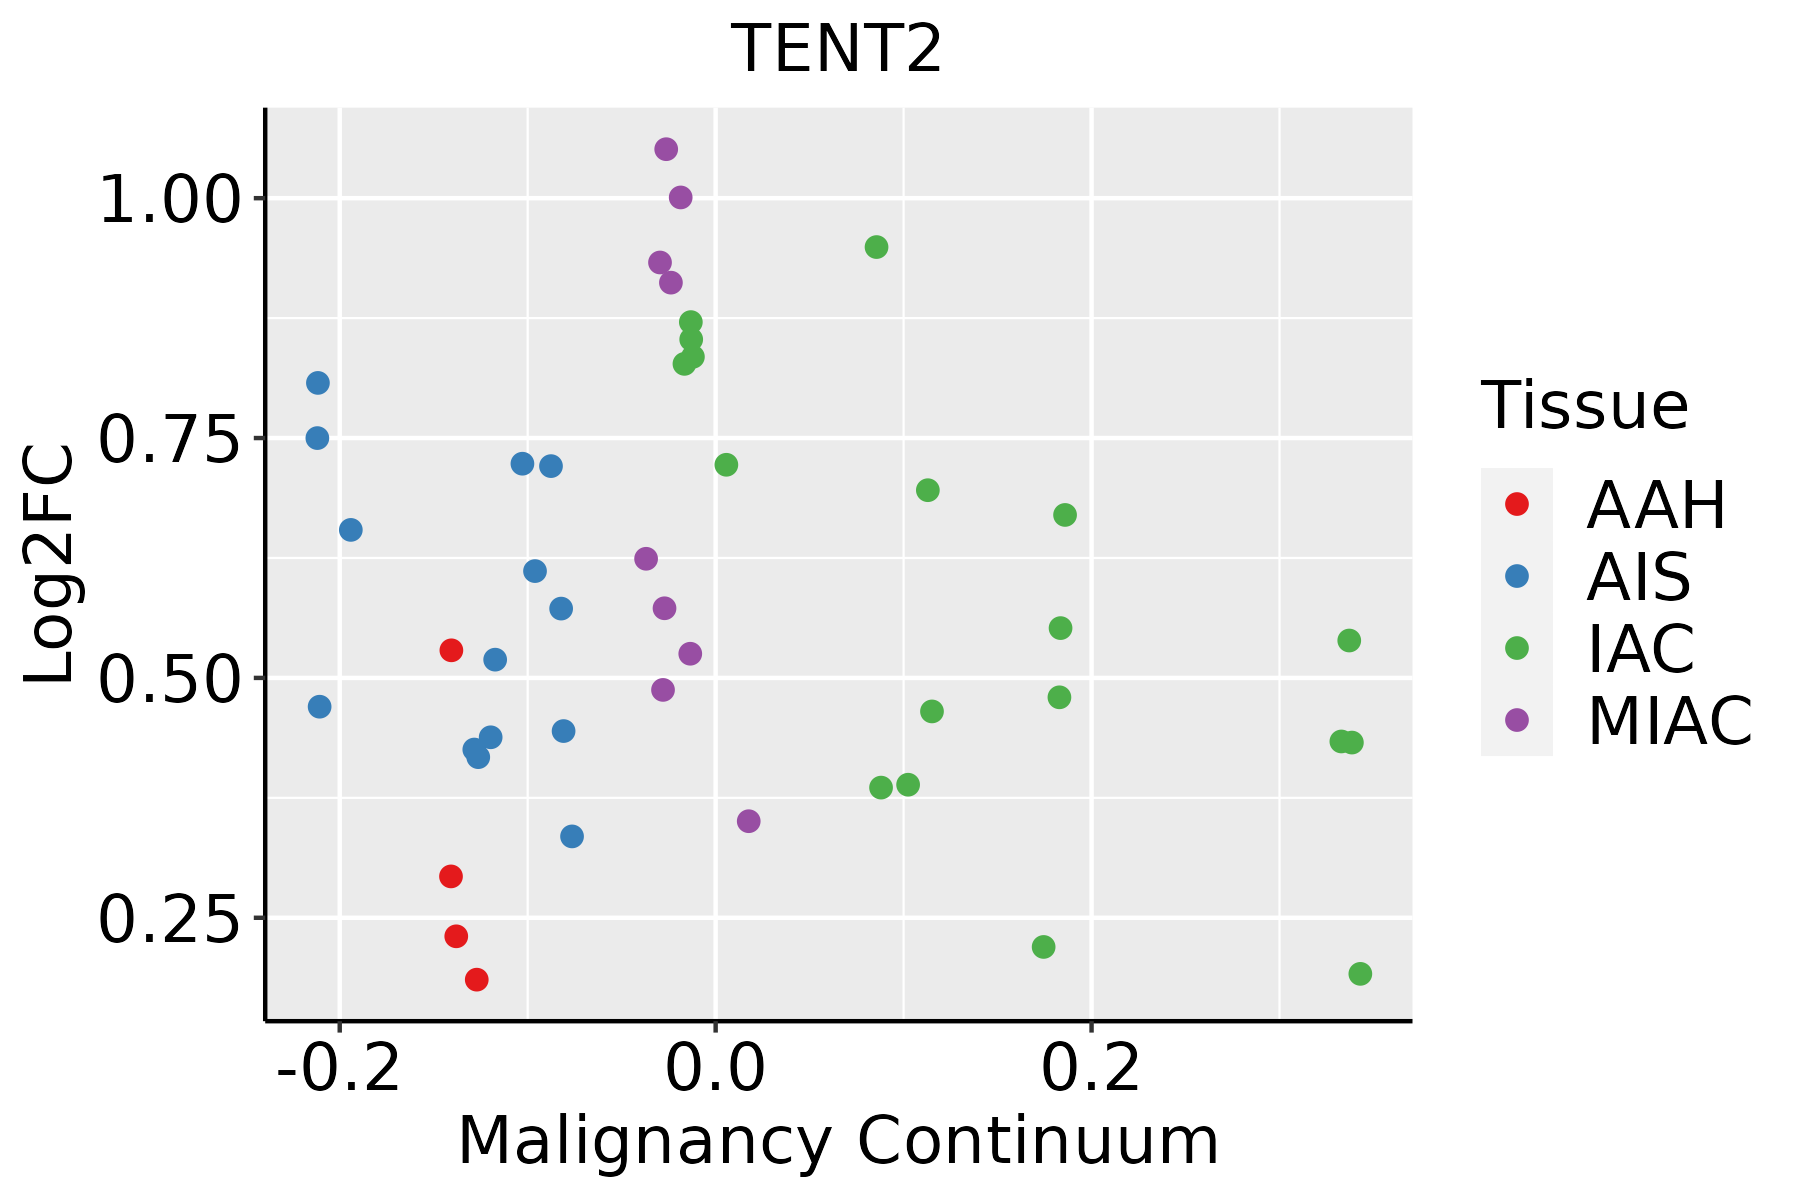 | AAH: Atypical adenomatous hyperplasia |
| AIS: Adenocarcinoma in situ | ||
| IAC: Invasive lung adenocarcinoma | ||
| MIA: Minimally invasive adenocarcinoma | ||
| Thyroid | 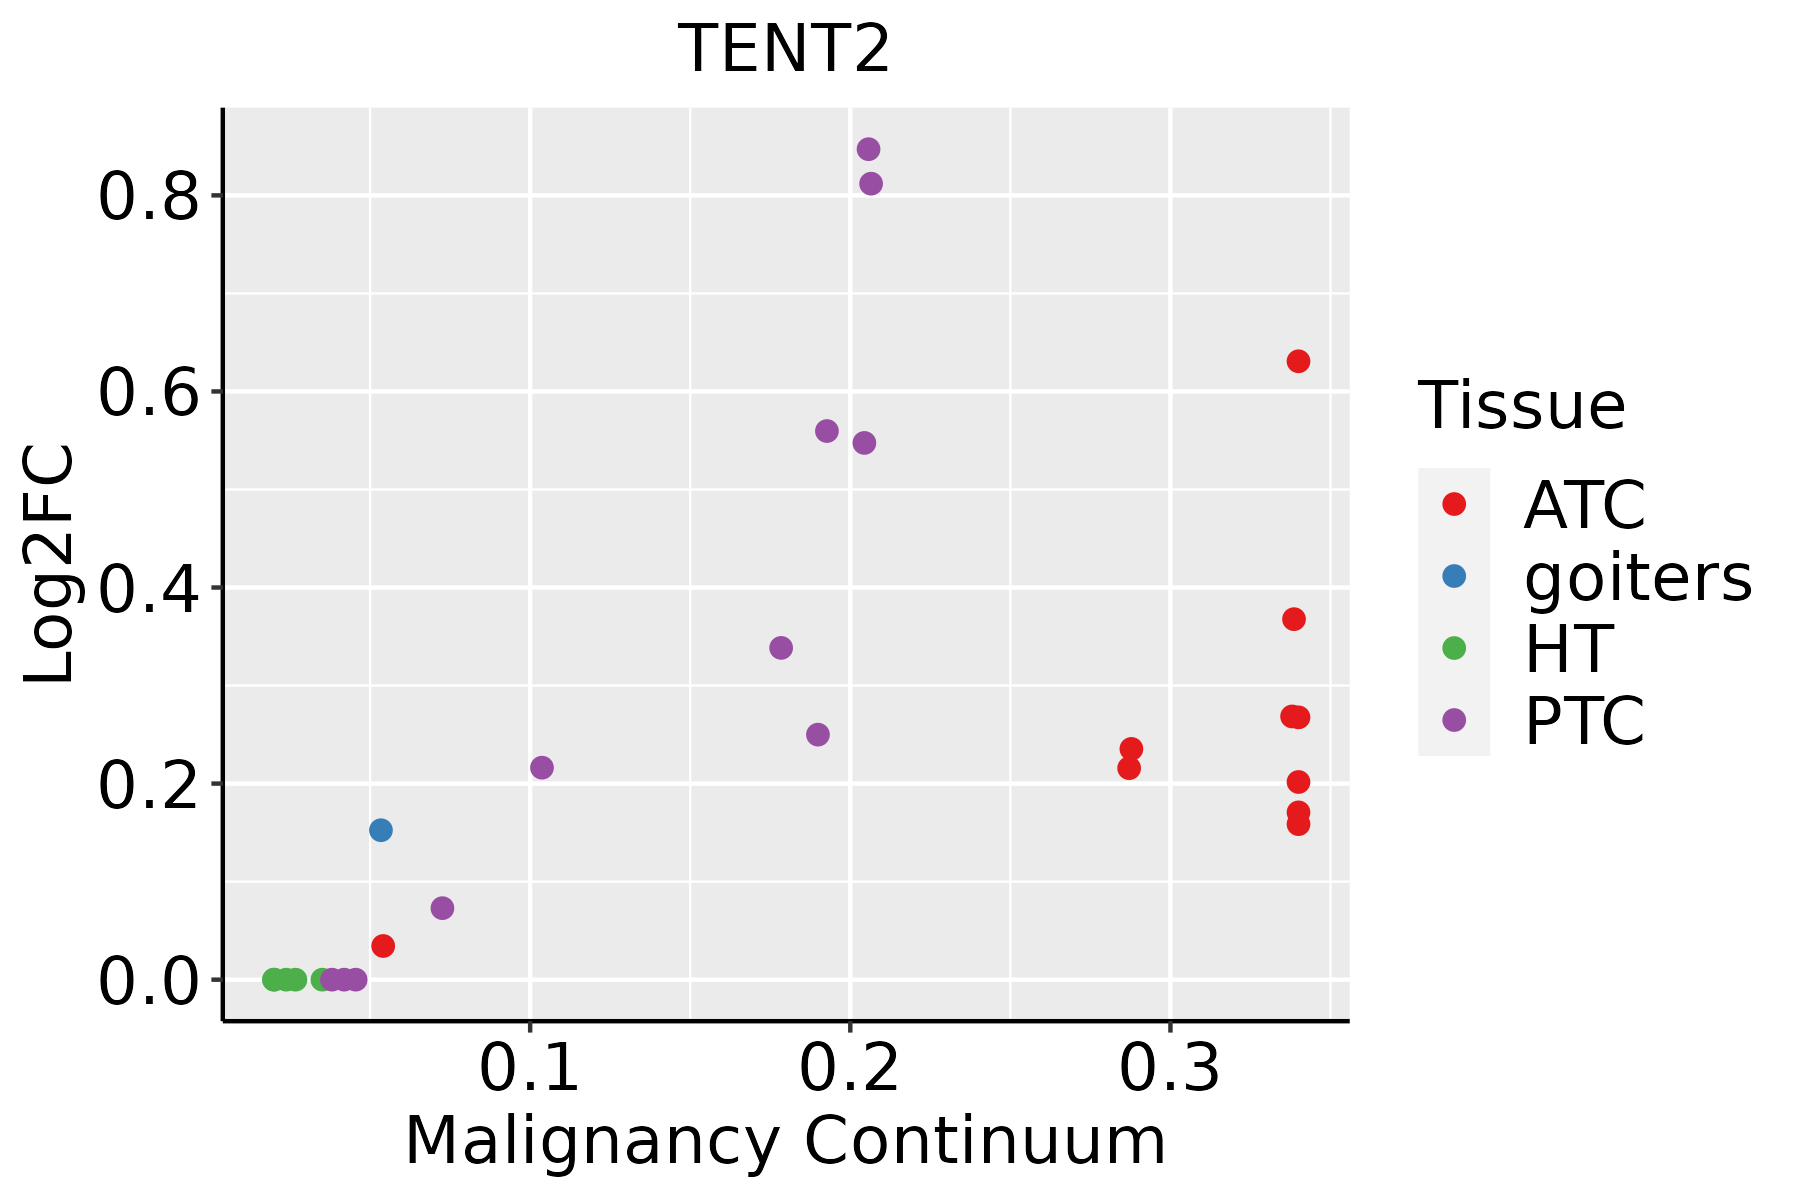 | ATC: Anaplastic thyroid cancer |
| HT: Hashimoto's thyroiditis | ||
| PTC: Papillary thyroid cancer |
| ∗log2FC in expression of this searched gene in stem-like cells from each diseased tissue sample relative to stem-like cells in normal samples in each tissue plotted against the malignancy continuum. Samples are colored based on if they are from different disease stage. |
Top |
Malignant transformation related pathway analysis |
| Find out the enriched GO biological processes and KEGG pathways involved in transition from healthy to precancer to cancer |
| Tissue | Disease Stage | Enriched GO biological Processes |
| Colorectum | AD |  |
| Colorectum | SER |  |
| Colorectum | MSS |  |
| Colorectum | MSI-H |  |
| Colorectum | FAP |  |
| ∗Top 15 enriched GO BP terms are showed in the bar plot of each disease state in each tissue. Each row represents a significant GO biological process which is colored according to the -log10(p.adjust). |
| Page: 1 2 3 4 5 6 7 8 9 |
| GO ID | Tissue | Disease Stage | Description | Gene Ratio | Bg Ratio | pvalue | p.adjust | Count |
| GO:003133010 | Cervix | CC | negative regulation of cellular catabolic process | 63/2311 | 262/18723 | 1.10e-07 | 5.68e-06 | 63 |
| GO:00064029 | Cervix | CC | mRNA catabolic process | 56/2311 | 232/18723 | 4.81e-07 | 1.83e-05 | 56 |
| GO:000989510 | Cervix | CC | negative regulation of catabolic process | 69/2311 | 320/18723 | 2.15e-06 | 6.55e-05 | 69 |
| GO:00064019 | Cervix | CC | RNA catabolic process | 62/2311 | 278/18723 | 2.18e-06 | 6.56e-05 | 62 |
| GO:00712148 | Cervix | CC | cellular response to abiotic stimulus | 69/2311 | 331/18723 | 7.36e-06 | 1.73e-04 | 69 |
| GO:01040048 | Cervix | CC | cellular response to environmental stimulus | 69/2311 | 331/18723 | 7.36e-06 | 1.73e-04 | 69 |
| GO:00009567 | Cervix | CC | nuclear-transcribed mRNA catabolic process | 30/2311 | 112/18723 | 2.60e-05 | 4.37e-04 | 30 |
| GO:00093149 | Cervix | CC | response to radiation | 86/2311 | 456/18723 | 3.50e-05 | 5.63e-04 | 86 |
| GO:00714786 | Cervix | CC | cellular response to radiation | 41/2311 | 186/18723 | 1.41e-04 | 1.71e-03 | 41 |
| GO:00467008 | Cervix | CC | heterocycle catabolic process | 80/2311 | 445/18723 | 3.23e-04 | 3.42e-03 | 80 |
| GO:00346559 | Cervix | CC | nucleobase-containing compound catabolic process | 74/2311 | 407/18723 | 3.77e-04 | 3.88e-03 | 74 |
| GO:00434879 | Cervix | CC | regulation of RNA stability | 36/2311 | 170/18723 | 7.72e-04 | 6.86e-03 | 36 |
| GO:00442709 | Cervix | CC | cellular nitrogen compound catabolic process | 79/2311 | 451/18723 | 7.80e-04 | 6.91e-03 | 79 |
| GO:00022443 | Cervix | CC | hematopoietic progenitor cell differentiation | 26/2311 | 114/18723 | 1.30e-03 | 1.03e-02 | 26 |
| GO:19023698 | Cervix | CC | negative regulation of RNA catabolic process | 19/2311 | 75/18723 | 1.54e-03 | 1.19e-02 | 19 |
| GO:00194398 | Cervix | CC | aromatic compound catabolic process | 79/2311 | 467/18723 | 2.14e-03 | 1.54e-02 | 79 |
| GO:00309003 | Cervix | CC | forebrain development | 64/2311 | 379/18723 | 5.53e-03 | 3.19e-02 | 64 |
| GO:0150063 | Cervix | CC | visual system development | 63/2311 | 375/18723 | 6.58e-03 | 3.65e-02 | 63 |
| GO:19013618 | Cervix | CC | organic cyclic compound catabolic process | 80/2311 | 495/18723 | 6.77e-03 | 3.72e-02 | 80 |
| GO:0001654 | Cervix | CC | eye development | 62/2311 | 371/18723 | 7.83e-03 | 4.13e-02 | 62 |
| Page: 1 2 3 4 5 6 7 8 9 10 11 12 13 |
| Pathway ID | Tissue | Disease Stage | Description | Gene Ratio | Bg Ratio | pvalue | p.adjust | qvalue | Count |
| Page: 1 |
Top |
Cell-cell communication analysis |
| Identification of potential cell-cell interactions between two cell types and their ligand-receptor pairs for different disease states |
| Ligand | Receptor | LRpair | Pathway | Tissue | Disease Stage |
| Page: 1 |
Top |
Single-cell gene regulatory network inference analysis |
| Find out the significant the regulons (TFs) and the target genes of each regulon across cell types for different disease states |
| TF | Cell Type | Tissue | Disease Stage | Target Gene | RSS | Regulon Activity |
| ∗The dot plots of a searched regulon are shown for all cell subpopulations in each disease state of each tissue based on the regulon specific score inferred using pySCENIC and by calculating the average expression. |
| Page: 1 |
Top |
Somatic mutation of malignant transformation related genes |
| Annotation of somatic variants for genes involved in malignant transformation |
| Hugo Symbol | Variant Class | Variant Classification | dbSNP RS | HGVSc | HGVSp | HGVSp Short | SWISSPROT | BIOTYPE | SIFT | PolyPhen | Tumor Sample Barcode | Tissue | Histology | Sex | Age | Stage | Therapy Types | Drugs | Outcome |
| Page: 1 |
Top |
Related drugs of malignant transformation related genes |
| Identification of chemicals and drugs interact with genes involved in malignant transfromation |
| (DGIdb 4.0) |
| Entrez ID | Symbol | Category | Interaction Types | Drug Claim Name | Drug Name | PMIDs |
| Page: 1 |

Copyright 2023-Present -The University of Texas Health Science Center at Houston |