
|
|||||
|
 | |
| |
| |
| |
| |
| |
|
Gene: TENM4 |
Gene summary for TENM4 |
| Gene information | Species | Human | Gene symbol | TENM4 | Gene ID | 26011 |
| Gene name | teneurin transmembrane protein 4 | |
| Gene Alias | Doc4 | |
| Cytomap | 11q14.1 | |
| Gene Type | protein-coding | GO ID | GO:0001702 | UniProtAcc | Q6N022 |
Top |
Malignant transformation analysis |
| Identification of the aberrant gene expression in precancerous and cancerous lesions by comparing the gene expression of stem-like cells in diseased tissues with normal stem cells |
| Entrez ID | Symbol | Replicates | Species | Organ | Tissue | Adj P-value | Log2FC | Malignancy |
| 26011 | TENM4 | CCI_1 | Human | Cervix | CC | 1.56e-10 | 8.69e-01 | 0.528 |
| 26011 | TENM4 | CCI_3 | Human | Cervix | CC | 1.19e-11 | 7.26e-01 | 0.516 |
| 26011 | TENM4 | AEH-subject1 | Human | Endometrium | AEH | 3.29e-04 | 1.86e-01 | -0.3059 |
| 26011 | TENM4 | EEC-subject2 | Human | Endometrium | EEC | 4.96e-06 | 2.95e-01 | -0.2607 |
| 26011 | TENM4 | EEC-subject5 | Human | Endometrium | EEC | 1.80e-07 | 3.32e-01 | -0.249 |
| 26011 | TENM4 | LZE24T | Human | Esophagus | ESCC | 1.71e-13 | 4.26e-01 | 0.0596 |
| 26011 | TENM4 | P4T-E | Human | Esophagus | ESCC | 6.58e-11 | 3.16e-01 | 0.1323 |
| 26011 | TENM4 | P5T-E | Human | Esophagus | ESCC | 4.78e-07 | 1.63e-01 | 0.1327 |
| 26011 | TENM4 | P8T-E | Human | Esophagus | ESCC | 2.49e-03 | 1.35e-01 | 0.0889 |
| 26011 | TENM4 | P9T-E | Human | Esophagus | ESCC | 4.25e-08 | 1.57e-01 | 0.1131 |
| 26011 | TENM4 | P10T-E | Human | Esophagus | ESCC | 6.63e-05 | 1.89e-01 | 0.116 |
| 26011 | TENM4 | P11T-E | Human | Esophagus | ESCC | 2.73e-05 | 2.48e-01 | 0.1426 |
| 26011 | TENM4 | P12T-E | Human | Esophagus | ESCC | 1.69e-26 | 5.13e-01 | 0.1122 |
| 26011 | TENM4 | P15T-E | Human | Esophagus | ESCC | 1.11e-27 | 6.95e-01 | 0.1149 |
| 26011 | TENM4 | P21T-E | Human | Esophagus | ESCC | 2.19e-07 | 1.57e-01 | 0.1617 |
| 26011 | TENM4 | P22T-E | Human | Esophagus | ESCC | 7.15e-04 | 5.79e-02 | 0.1236 |
| 26011 | TENM4 | P23T-E | Human | Esophagus | ESCC | 3.65e-12 | 3.38e-01 | 0.108 |
| 26011 | TENM4 | P26T-E | Human | Esophagus | ESCC | 8.62e-24 | 4.37e-01 | 0.1276 |
| 26011 | TENM4 | P27T-E | Human | Esophagus | ESCC | 1.14e-37 | 6.62e-01 | 0.1055 |
| 26011 | TENM4 | P28T-E | Human | Esophagus | ESCC | 4.63e-16 | 3.29e-01 | 0.1149 |
| Page: 1 2 3 |
| Tissue | Expression Dynamics | Abbreviation |
| Cervix | 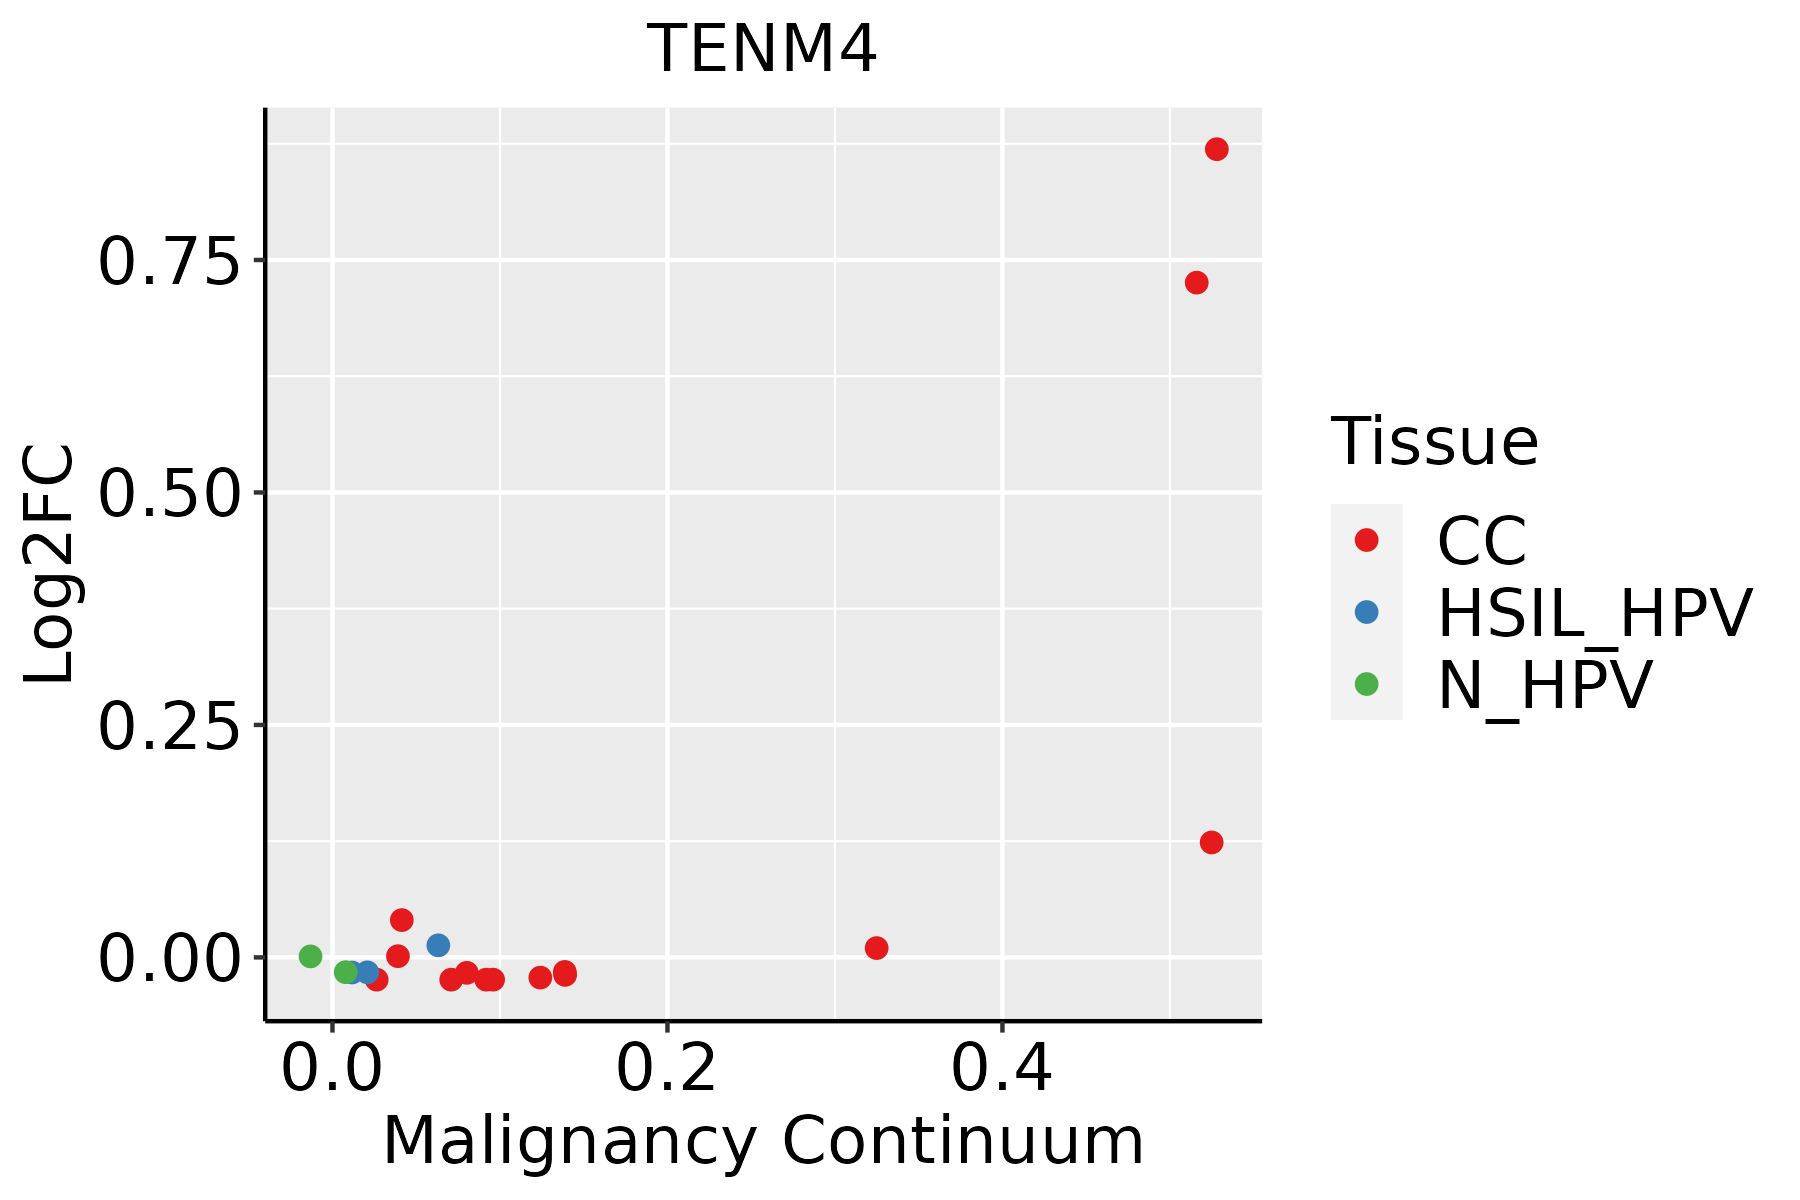 | CC: Cervix cancer |
| HSIL_HPV: HPV-infected high-grade squamous intraepithelial lesions | ||
| N_HPV: HPV-infected normal cervix | ||
| Endometrium |  | AEH: Atypical endometrial hyperplasia |
| EEC: Endometrioid Cancer | ||
| Esophagus |  | ESCC: Esophageal squamous cell carcinoma |
| HGIN: High-grade intraepithelial neoplasias | ||
| LGIN: Low-grade intraepithelial neoplasias | ||
| Skin | 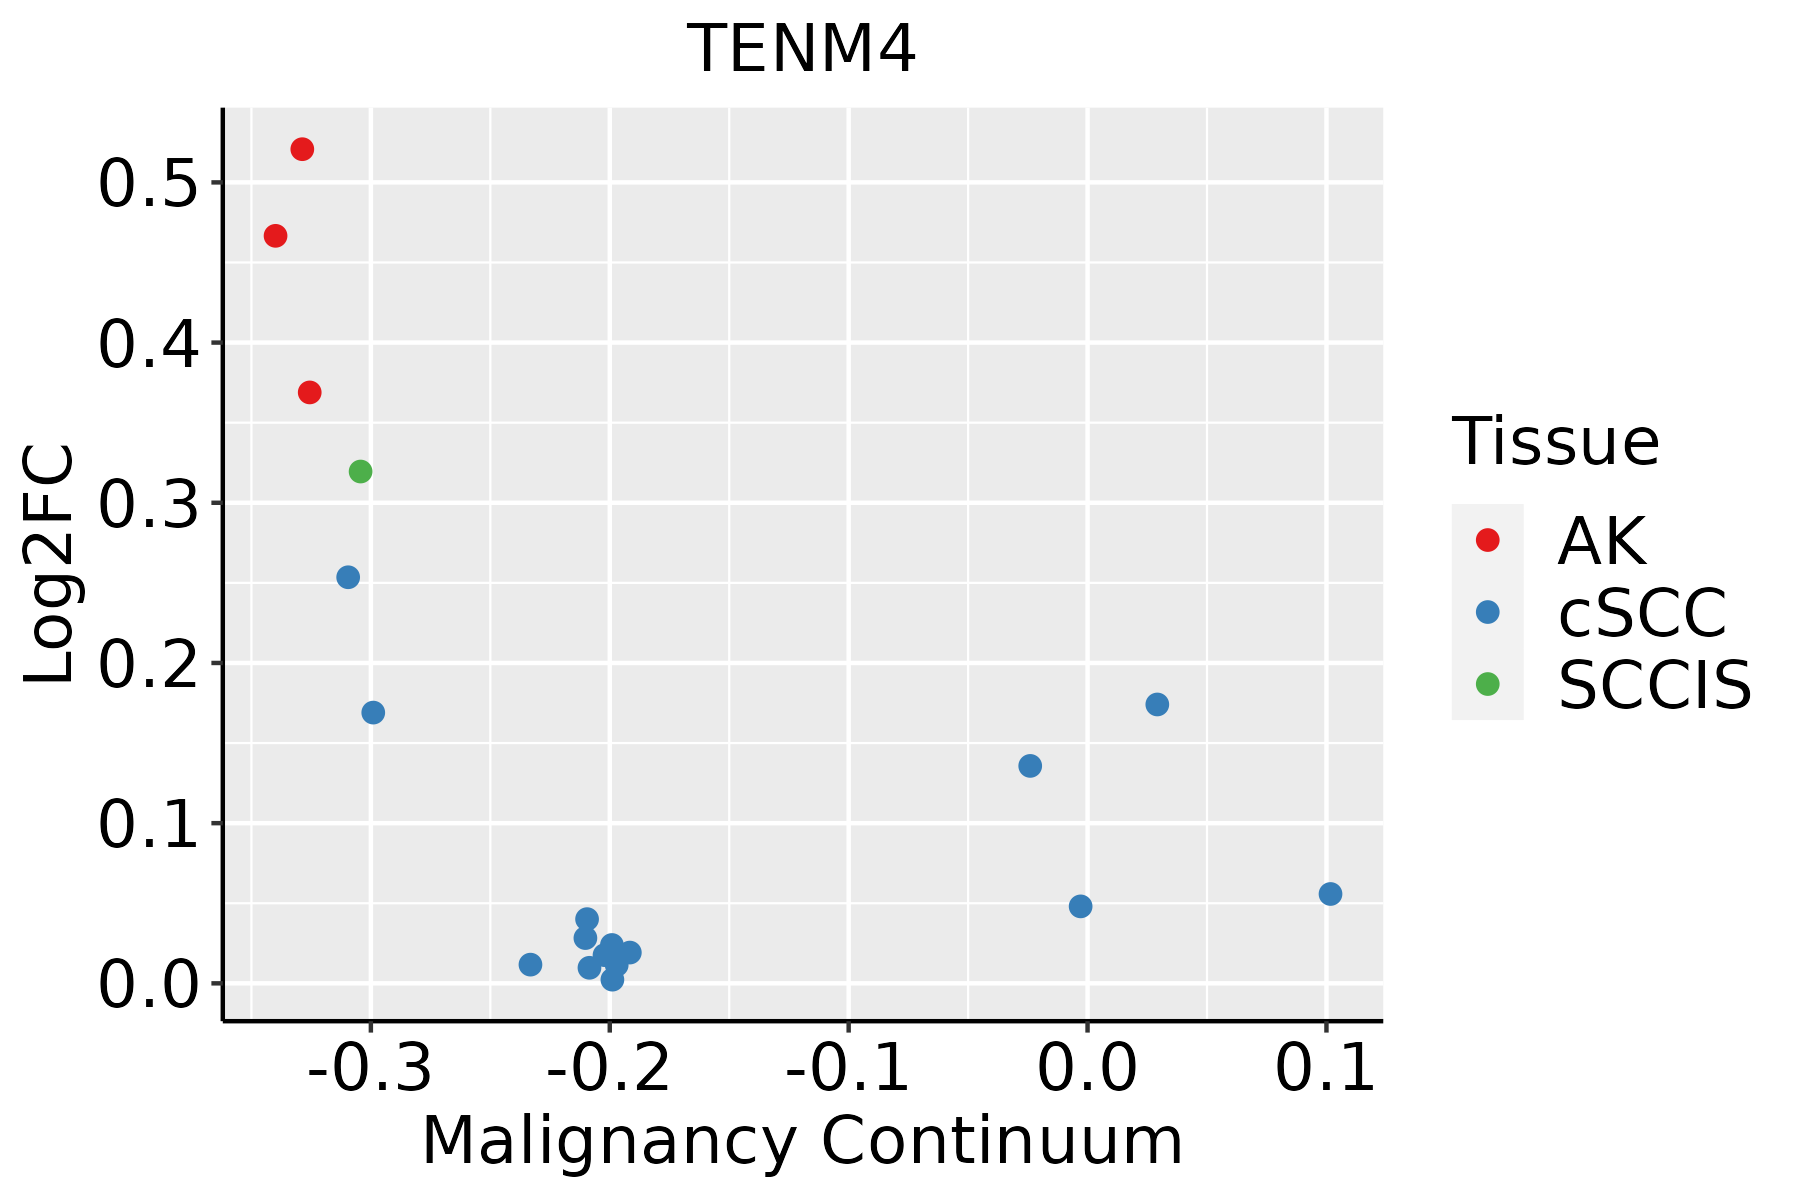 | AK: Actinic keratosis |
| cSCC: Cutaneous squamous cell carcinoma | ||
| SCCIS:squamous cell carcinoma in situ |
| ∗log2FC in expression of this searched gene in stem-like cells from each diseased tissue sample relative to stem-like cells in normal samples in each tissue plotted against the malignancy continuum. Samples are colored based on if they are from different disease stage. |
Top |
Malignant transformation related pathway analysis |
| Find out the enriched GO biological processes and KEGG pathways involved in transition from healthy to precancer to cancer |
| Tissue | Disease Stage | Enriched GO biological Processes |
| Colorectum | AD |  |
| Colorectum | SER |  |
| Colorectum | MSS |  |
| Colorectum | MSI-H |  |
| Colorectum | FAP |  |
| ∗Top 15 enriched GO BP terms are showed in the bar plot of each disease state in each tissue. Each row represents a significant GO biological process which is colored according to the -log10(p.adjust). |
| Page: 1 2 3 4 5 6 7 8 9 |
| GO ID | Tissue | Disease Stage | Description | Gene Ratio | Bg Ratio | pvalue | p.adjust | Count |
| GO:00107206 | Cervix | CC | positive regulation of cell development | 64/2311 | 298/18723 | 5.69e-06 | 1.41e-04 | 64 |
| GO:00073695 | Cervix | CC | gastrulation | 42/2311 | 185/18723 | 5.83e-05 | 8.46e-04 | 42 |
| GO:00605375 | Cervix | CC | muscle tissue development | 76/2311 | 403/18723 | 9.76e-05 | 1.27e-03 | 76 |
| GO:00147064 | Cervix | CC | striated muscle tissue development | 72/2311 | 384/18723 | 1.76e-04 | 2.07e-03 | 72 |
| GO:00459955 | Cervix | CC | regulation of embryonic development | 19/2311 | 64/18723 | 1.78e-04 | 2.09e-03 | 19 |
| GO:0033002 | Cervix | CC | muscle cell proliferation | 49/2311 | 248/18723 | 5.43e-04 | 5.24e-03 | 49 |
| GO:00519603 | Cervix | CC | regulation of nervous system development | 77/2311 | 443/18723 | 1.13e-03 | 9.30e-03 | 77 |
| GO:00507676 | Cervix | CC | regulation of neurogenesis | 65/2311 | 364/18723 | 1.33e-03 | 1.05e-02 | 65 |
| GO:00507694 | Cervix | CC | positive regulation of neurogenesis | 43/2311 | 225/18723 | 2.25e-03 | 1.61e-02 | 43 |
| GO:0014855 | Cervix | CC | striated muscle cell proliferation | 18/2311 | 76/18723 | 4.45e-03 | 2.71e-02 | 18 |
| GO:00519622 | Cervix | CC | positive regulation of nervous system development | 48/2311 | 272/18723 | 6.60e-03 | 3.65e-02 | 48 |
| GO:00605376 | Endometrium | AEH | muscle tissue development | 83/2100 | 403/18723 | 2.57e-08 | 1.50e-06 | 83 |
| GO:00147065 | Endometrium | AEH | striated muscle tissue development | 75/2100 | 384/18723 | 1.06e-06 | 3.62e-05 | 75 |
| GO:00330022 | Endometrium | AEH | muscle cell proliferation | 51/2100 | 248/18723 | 1.26e-05 | 2.77e-04 | 51 |
| GO:00107207 | Endometrium | AEH | positive regulation of cell development | 57/2100 | 298/18723 | 3.72e-05 | 6.49e-04 | 57 |
| GO:00459956 | Endometrium | AEH | regulation of embryonic development | 18/2100 | 64/18723 | 1.65e-04 | 2.15e-03 | 18 |
| GO:0048738 | Endometrium | AEH | cardiac muscle tissue development | 43/2100 | 236/18723 | 9.06e-04 | 8.30e-03 | 43 |
| GO:0035265 | Endometrium | AEH | organ growth | 33/2100 | 178/18723 | 2.53e-03 | 1.87e-02 | 33 |
| GO:00507677 | Endometrium | AEH | regulation of neurogenesis | 56/2100 | 364/18723 | 8.87e-03 | 4.82e-02 | 56 |
| GO:006053713 | Endometrium | EEC | muscle tissue development | 82/2168 | 403/18723 | 2.14e-07 | 9.38e-06 | 82 |
| Page: 1 2 3 4 5 |
| Pathway ID | Tissue | Disease Stage | Description | Gene Ratio | Bg Ratio | pvalue | p.adjust | qvalue | Count |
| Page: 1 |
Top |
Cell-cell communication analysis |
| Identification of potential cell-cell interactions between two cell types and their ligand-receptor pairs for different disease states |
| Ligand | Receptor | LRpair | Pathway | Tissue | Disease Stage |
| Page: 1 |
Top |
Single-cell gene regulatory network inference analysis |
| Find out the significant the regulons (TFs) and the target genes of each regulon across cell types for different disease states |
| TF | Cell Type | Tissue | Disease Stage | Target Gene | RSS | Regulon Activity |
| ∗The dot plots of a searched regulon are shown for all cell subpopulations in each disease state of each tissue based on the regulon specific score inferred using pySCENIC and by calculating the average expression. |
| Page: 1 |
Top |
Somatic mutation of malignant transformation related genes |
| Annotation of somatic variants for genes involved in malignant transformation |
| Hugo Symbol | Variant Class | Variant Classification | dbSNP RS | HGVSc | HGVSp | HGVSp Short | SWISSPROT | BIOTYPE | SIFT | PolyPhen | Tumor Sample Barcode | Tissue | Histology | Sex | Age | Stage | Therapy Types | Drugs | Outcome |
| TENM4 | SNV | Missense_Mutation | c.191N>A | p.Val64Glu | p.V64E | Q6N022 | protein_coding | tolerated_low_confidence(0.1) | probably_damaging(0.988) | TCGA-A1-A0SM-01 | Breast | breast invasive carcinoma | Male | >=65 | I/II | Unknown | Unknown | SD | |
| TENM4 | SNV | Missense_Mutation | c.2228N>A | p.Thr743Asn | p.T743N | Q6N022 | protein_coding | tolerated(0.15) | benign(0.254) | TCGA-A2-A04V-01 | Breast | breast invasive carcinoma | Female | <65 | I/II | Chemotherapy | cytoxan | PD | |
| TENM4 | SNV | Missense_Mutation | rs756075933 | c.5105N>A | p.Arg1702His | p.R1702H | Q6N022 | protein_coding | tolerated(0.14) | probably_damaging(0.991) | TCGA-A2-A0CM-01 | Breast | breast invasive carcinoma | Female | <65 | I/II | Chemotherapy | adriamycin | PD |
| TENM4 | SNV | Missense_Mutation | rs750647178 | c.1855A>G | p.Lys619Glu | p.K619E | Q6N022 | protein_coding | deleterious(0.01) | benign(0.187) | TCGA-A2-A1FW-01 | Breast | breast invasive carcinoma | Female | <65 | III/IV | Chemotherapy | cytoxan | SD |
| TENM4 | SNV | Missense_Mutation | c.6389T>C | p.Ile2130Thr | p.I2130T | Q6N022 | protein_coding | deleterious(0) | probably_damaging(0.977) | TCGA-A2-A25B-01 | Breast | breast invasive carcinoma | Female | <65 | I/II | Chemotherapy | taxotere | PD | |
| TENM4 | SNV | Missense_Mutation | c.6748G>T | p.Asp2250Tyr | p.D2250Y | Q6N022 | protein_coding | deleterious(0) | probably_damaging(0.997) | TCGA-A8-A07R-01 | Breast | breast invasive carcinoma | Female | >=65 | III/IV | Ancillary | zoledronic | SD | |
| TENM4 | SNV | Missense_Mutation | rs750647178 | c.1855A>G | p.Lys619Glu | p.K619E | Q6N022 | protein_coding | deleterious(0.01) | benign(0.187) | TCGA-AC-A23H-01 | Breast | breast invasive carcinoma | Female | >=65 | I/II | Unknown | Unknown | PD |
| TENM4 | SNV | Missense_Mutation | c.6110C>A | p.Thr2037Lys | p.T2037K | Q6N022 | protein_coding | deleterious(0.02) | benign(0.103) | TCGA-AC-A2FE-01 | Breast | breast invasive carcinoma | Female | <65 | III/IV | Chemotherapy | adriamycin | PD | |
| TENM4 | SNV | Missense_Mutation | novel | c.1456N>T | p.Pro486Ser | p.P486S | Q6N022 | protein_coding | deleterious(0) | probably_damaging(0.996) | TCGA-AN-A046-01 | Breast | breast invasive carcinoma | Female | >=65 | I/II | Unknown | Unknown | SD |
| TENM4 | SNV | Missense_Mutation | rs750647178 | c.1855N>G | p.Lys619Glu | p.K619E | Q6N022 | protein_coding | deleterious(0.01) | benign(0.187) | TCGA-AR-A1AY-01 | Breast | breast invasive carcinoma | Female | >=65 | I/II | Unspecific | Doxorubicin | SD |
| Page: 1 2 3 4 5 6 7 8 9 10 11 12 13 14 15 16 17 18 19 20 21 22 23 24 25 26 27 28 29 30 31 32 33 34 35 36 |
Top |
Related drugs of malignant transformation related genes |
| Identification of chemicals and drugs interact with genes involved in malignant transfromation |
| (DGIdb 4.0) |
| Entrez ID | Symbol | Category | Interaction Types | Drug Claim Name | Drug Name | PMIDs |
| Page: 1 |

Copyright 2023-Present -The University of Texas Health Science Center at Houston |