
|
|||||
|
 | |
| |
| |
| |
| |
| |
|
Gene: TENM3 |
Gene summary for TENM3 |
| Gene information | Species | Human | Gene symbol | TENM3 | Gene ID | 55714 |
| Gene name | teneurin transmembrane protein 3 | |
| Gene Alias | MCOPCB9 | |
| Cytomap | 4q34.3-q35.1 | |
| Gene Type | protein-coding | GO ID | GO:0001654 | UniProtAcc | A0A140VJW8 |
Top |
Malignant transformation analysis |
| Identification of the aberrant gene expression in precancerous and cancerous lesions by comparing the gene expression of stem-like cells in diseased tissues with normal stem cells |
| Entrez ID | Symbol | Replicates | Species | Organ | Tissue | Adj P-value | Log2FC | Malignancy |
| 55714 | TENM3 | AEH-subject4 | Human | Endometrium | AEH | 2.89e-04 | 2.18e-01 | -0.2657 |
| 55714 | TENM3 | P2T-E | Human | Esophagus | ESCC | 4.58e-16 | 2.81e-01 | 0.1177 |
| 55714 | TENM3 | P5T-E | Human | Esophagus | ESCC | 1.81e-02 | 7.78e-02 | 0.1327 |
| 55714 | TENM3 | P10T-E | Human | Esophagus | ESCC | 5.91e-22 | 4.76e-01 | 0.116 |
| 55714 | TENM3 | P11T-E | Human | Esophagus | ESCC | 4.48e-23 | 9.41e-01 | 0.1426 |
| 55714 | TENM3 | P12T-E | Human | Esophagus | ESCC | 1.34e-19 | 4.22e-01 | 0.1122 |
| 55714 | TENM3 | P16T-E | Human | Esophagus | ESCC | 2.27e-06 | 6.47e-02 | 0.1153 |
| 55714 | TENM3 | P17T-E | Human | Esophagus | ESCC | 4.41e-02 | 3.28e-01 | 0.1278 |
| 55714 | TENM3 | P19T-E | Human | Esophagus | ESCC | 2.18e-08 | 6.57e-01 | 0.1662 |
| 55714 | TENM3 | P22T-E | Human | Esophagus | ESCC | 7.28e-05 | 9.08e-02 | 0.1236 |
| 55714 | TENM3 | P24T-E | Human | Esophagus | ESCC | 1.73e-03 | 2.99e-01 | 0.1287 |
| 55714 | TENM3 | P26T-E | Human | Esophagus | ESCC | 2.76e-10 | 3.08e-01 | 0.1276 |
| 55714 | TENM3 | P32T-E | Human | Esophagus | ESCC | 3.11e-12 | 3.92e-01 | 0.1666 |
| 55714 | TENM3 | P37T-E | Human | Esophagus | ESCC | 1.99e-45 | 1.00e+00 | 0.1371 |
| 55714 | TENM3 | P44T-E | Human | Esophagus | ESCC | 4.77e-02 | 1.14e-01 | 0.1096 |
| 55714 | TENM3 | P49T-E | Human | Esophagus | ESCC | 1.90e-09 | 7.29e-01 | 0.1768 |
| 55714 | TENM3 | P52T-E | Human | Esophagus | ESCC | 5.01e-05 | 1.12e-01 | 0.1555 |
| 55714 | TENM3 | P76T-E | Human | Esophagus | ESCC | 1.22e-03 | 1.70e-01 | 0.1207 |
| 55714 | TENM3 | P83T-E | Human | Esophagus | ESCC | 2.76e-15 | 4.59e-01 | 0.1738 |
| 55714 | TENM3 | P89T-E | Human | Esophagus | ESCC | 6.42e-05 | 3.06e-01 | 0.1752 |
| Page: 1 2 |
| Tissue | Expression Dynamics | Abbreviation |
| Endometrium | 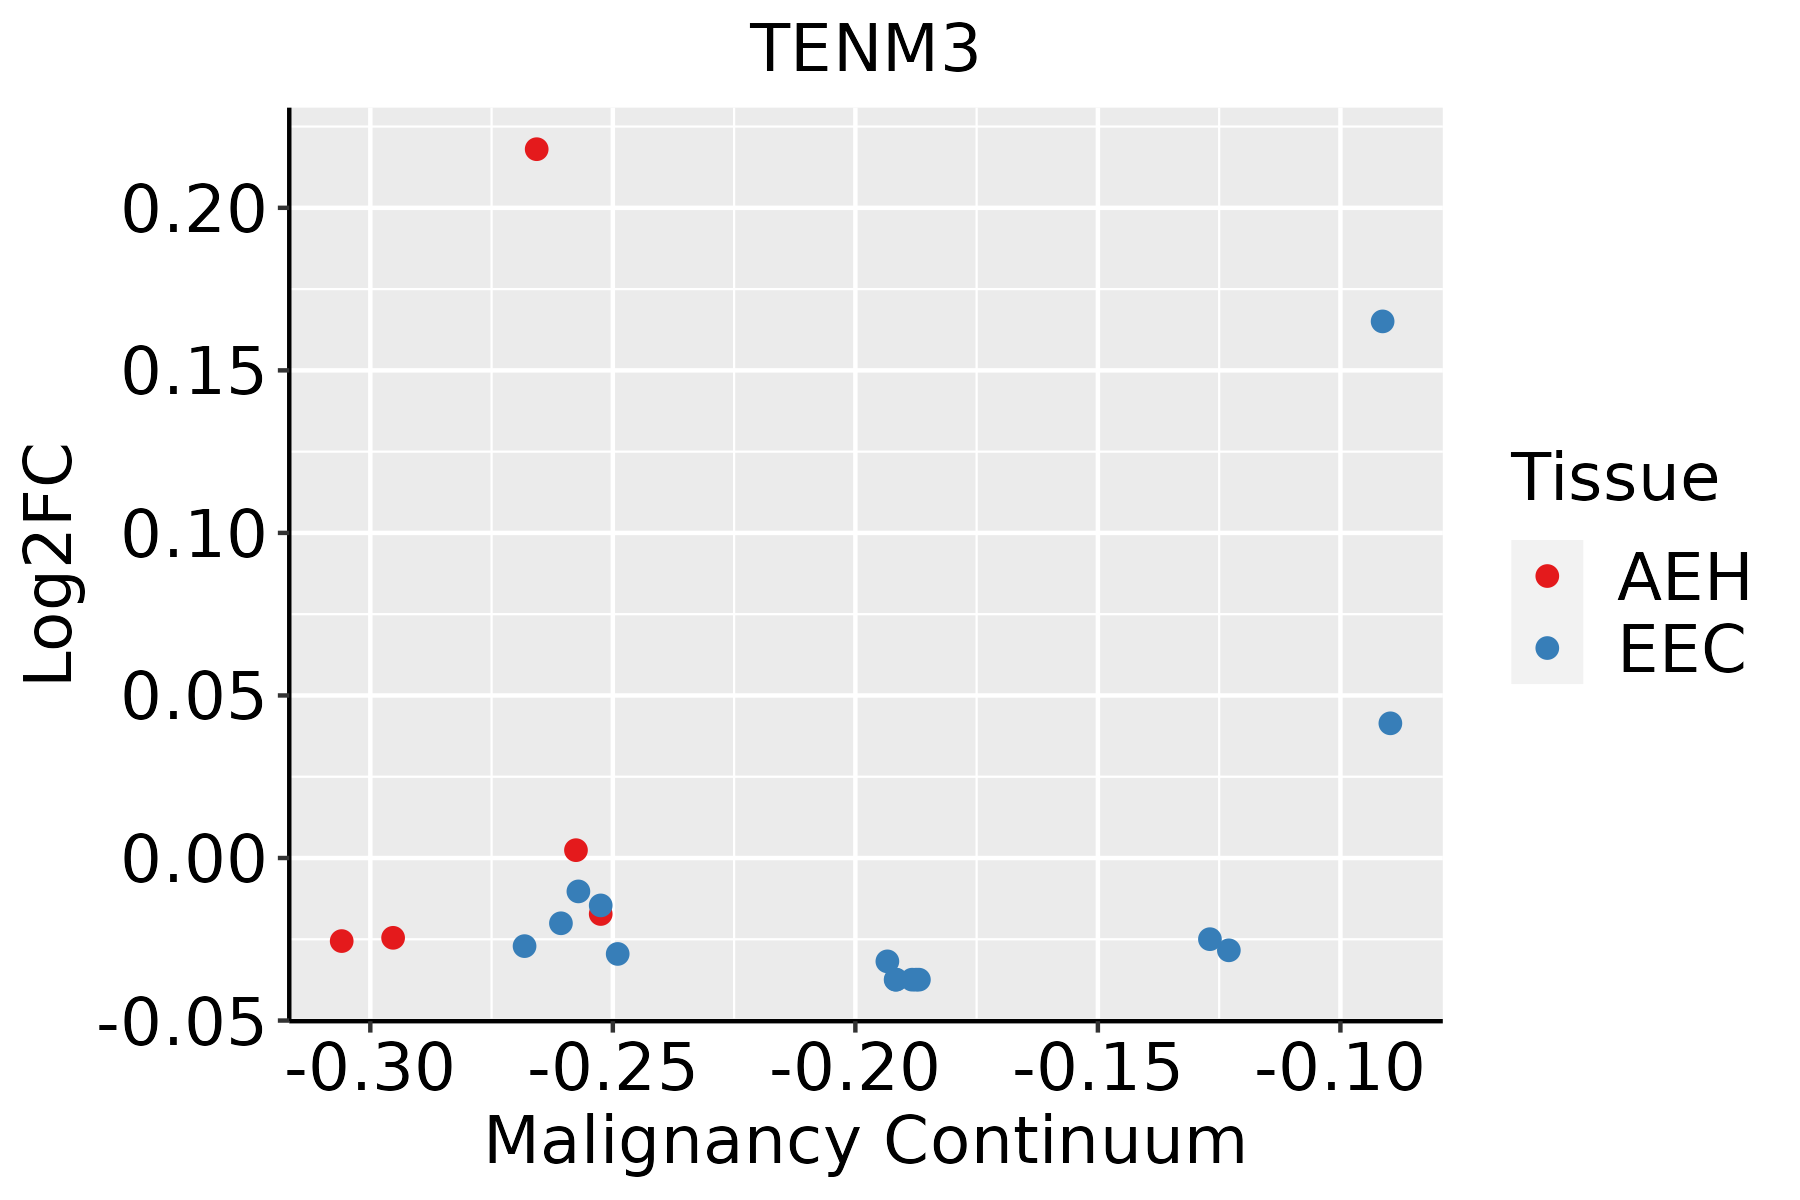 | AEH: Atypical endometrial hyperplasia |
| EEC: Endometrioid Cancer | ||
| Esophagus | 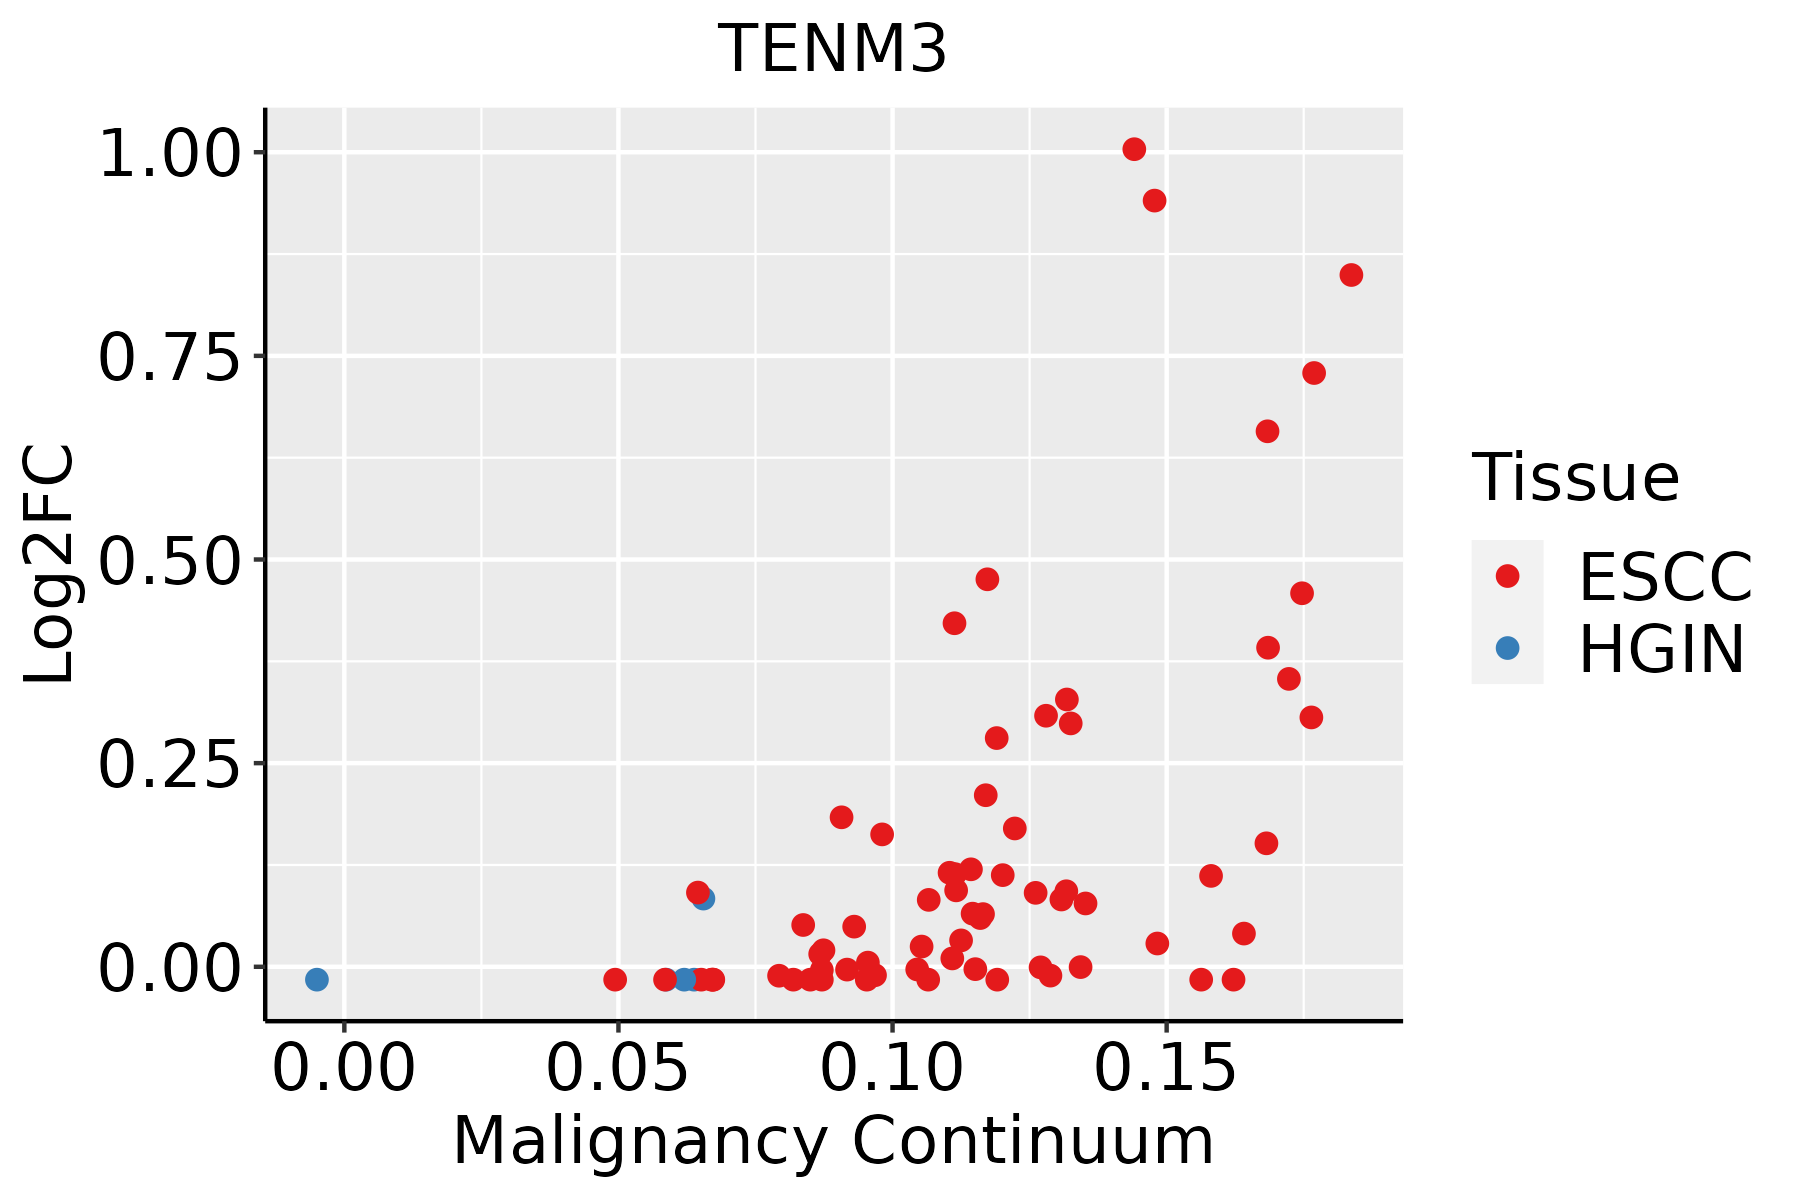 | ESCC: Esophageal squamous cell carcinoma |
| HGIN: High-grade intraepithelial neoplasias | ||
| LGIN: Low-grade intraepithelial neoplasias | ||
| Thyroid |  | ATC: Anaplastic thyroid cancer |
| HT: Hashimoto's thyroiditis | ||
| PTC: Papillary thyroid cancer |
| ∗log2FC in expression of this searched gene in stem-like cells from each diseased tissue sample relative to stem-like cells in normal samples in each tissue plotted against the malignancy continuum. Samples are colored based on if they are from different disease stage. |
Top |
Malignant transformation related pathway analysis |
| Find out the enriched GO biological processes and KEGG pathways involved in transition from healthy to precancer to cancer |
| Tissue | Disease Stage | Enriched GO biological Processes |
| Colorectum | AD |  |
| Colorectum | SER |  |
| Colorectum | MSS |  |
| Colorectum | MSI-H |  |
| Colorectum | FAP |  |
| ∗Top 15 enriched GO BP terms are showed in the bar plot of each disease state in each tissue. Each row represents a significant GO biological process which is colored according to the -log10(p.adjust). |
| Page: 1 2 3 4 5 6 7 8 9 |
| GO ID | Tissue | Disease Stage | Description | Gene Ratio | Bg Ratio | pvalue | p.adjust | Count |
| GO:002240714 | Endometrium | AEH | regulation of cell-cell adhesion | 79/2100 | 448/18723 | 2.90e-05 | 5.40e-04 | 79 |
| GO:00109758 | Endometrium | AEH | regulation of neuron projection development | 75/2100 | 445/18723 | 2.01e-04 | 2.54e-03 | 75 |
| GO:00313468 | Endometrium | AEH | positive regulation of cell projection organization | 61/2100 | 353/18723 | 3.91e-04 | 4.20e-03 | 61 |
| GO:003134616 | Esophagus | ESCC | positive regulation of cell projection organization | 201/8552 | 353/18723 | 1.19e-05 | 1.11e-04 | 201 |
| GO:001097516 | Esophagus | ESCC | regulation of neuron projection development | 240/8552 | 445/18723 | 2.48e-04 | 1.53e-03 | 240 |
| GO:002240720 | Esophagus | ESCC | regulation of cell-cell adhesion | 239/8552 | 448/18723 | 5.88e-04 | 3.19e-03 | 239 |
| GO:00109764 | Esophagus | ESCC | positive regulation of neuron projection development | 91/8552 | 163/18723 | 5.72e-03 | 2.13e-02 | 91 |
| GO:0031346110 | Thyroid | PTC | positive regulation of cell projection organization | 173/5968 | 353/18723 | 1.09e-11 | 4.40e-10 | 173 |
| GO:0010975110 | Thyroid | PTC | regulation of neuron projection development | 194/5968 | 445/18723 | 1.05e-07 | 2.08e-06 | 194 |
| GO:00109766 | Thyroid | PTC | positive regulation of neuron projection development | 75/5968 | 163/18723 | 1.06e-04 | 8.56e-04 | 75 |
| GO:003134623 | Thyroid | ATC | positive regulation of cell projection organization | 186/6293 | 353/18723 | 7.99e-14 | 4.23e-12 | 186 |
| GO:001097523 | Thyroid | ATC | regulation of neuron projection development | 212/6293 | 445/18723 | 4.16e-10 | 1.14e-08 | 212 |
| GO:001097614 | Thyroid | ATC | positive regulation of neuron projection development | 82/6293 | 163/18723 | 7.43e-06 | 7.61e-05 | 82 |
| Page: 1 |
| Pathway ID | Tissue | Disease Stage | Description | Gene Ratio | Bg Ratio | pvalue | p.adjust | qvalue | Count |
| Page: 1 |
Top |
Cell-cell communication analysis |
| Identification of potential cell-cell interactions between two cell types and their ligand-receptor pairs for different disease states |
| Ligand | Receptor | LRpair | Pathway | Tissue | Disease Stage |
| Page: 1 |
Top |
Single-cell gene regulatory network inference analysis |
| Find out the significant the regulons (TFs) and the target genes of each regulon across cell types for different disease states |
| TF | Cell Type | Tissue | Disease Stage | Target Gene | RSS | Regulon Activity |
| ∗The dot plots of a searched regulon are shown for all cell subpopulations in each disease state of each tissue based on the regulon specific score inferred using pySCENIC and by calculating the average expression. |
| Page: 1 |
Top |
Somatic mutation of malignant transformation related genes |
| Annotation of somatic variants for genes involved in malignant transformation |
| Hugo Symbol | Variant Class | Variant Classification | dbSNP RS | HGVSc | HGVSp | HGVSp Short | SWISSPROT | BIOTYPE | SIFT | PolyPhen | Tumor Sample Barcode | Tissue | Histology | Sex | Age | Stage | Therapy Types | Drugs | Outcome |
| TENM3 | SNV | Missense_Mutation | c.577T>A | p.Ser193Thr | p.S193T | Q9P273 | protein_coding | tolerated_low_confidence(0.72) | benign(0) | TCGA-A1-A0SO-01 | Breast | breast invasive carcinoma | Female | >=65 | I/II | Chemotherapy | SD | ||
| TENM3 | SNV | Missense_Mutation | novel | c.5812G>T | p.Ala1938Ser | p.A1938S | Q9P273 | protein_coding | tolerated(0.43) | benign(0.013) | TCGA-A2-A0EQ-01 | Breast | breast invasive carcinoma | Female | <65 | I/II | Chemotherapy | adriamycin | SD |
| TENM3 | SNV | Missense_Mutation | c.2603N>C | p.Arg868Thr | p.R868T | Q9P273 | protein_coding | deleterious(0.01) | probably_damaging(0.95) | TCGA-AC-A23H-01 | Breast | breast invasive carcinoma | Female | >=65 | I/II | Unknown | Unknown | PD | |
| TENM3 | SNV | Missense_Mutation | c.3128N>A | p.Arg1043Lys | p.R1043K | Q9P273 | protein_coding | tolerated(0.3) | possibly_damaging(0.899) | TCGA-AC-A23H-01 | Breast | breast invasive carcinoma | Female | >=65 | I/II | Unknown | Unknown | PD | |
| TENM3 | SNV | Missense_Mutation | c.707N>G | p.Gln236Arg | p.Q236R | Q9P273 | protein_coding | deleterious_low_confidence(0.01) | probably_damaging(0.932) | TCGA-AO-A128-01 | Breast | breast invasive carcinoma | Female | <65 | I/II | Chemotherapy | doxorubicin | SD | |
| TENM3 | SNV | Missense_Mutation | rs146065963 | c.6605N>T | p.Thr2202Met | p.T2202M | Q9P273 | protein_coding | deleterious(0.04) | benign(0.353) | TCGA-AO-A128-01 | Breast | breast invasive carcinoma | Female | <65 | I/II | Chemotherapy | doxorubicin | SD |
| TENM3 | SNV | Missense_Mutation | c.5765N>T | p.Ala1922Val | p.A1922V | Q9P273 | protein_coding | tolerated(0.08) | probably_damaging(0.968) | TCGA-AR-A1AP-01 | Breast | breast invasive carcinoma | Female | >=65 | I/II | Hormone Therapy | anastrozole | SD | |
| TENM3 | SNV | Missense_Mutation | c.5084N>A | p.Ser1695Asn | p.S1695N | Q9P273 | protein_coding | deleterious(0.02) | benign(0.14) | TCGA-BH-A0BW-01 | Breast | breast invasive carcinoma | Female | >=65 | I/II | Chemotherapy | adriamycin | CR | |
| TENM3 | SNV | Missense_Mutation | c.1409N>T | p.Arg470Leu | p.R470L | Q9P273 | protein_coding | deleterious(0.03) | possibly_damaging(0.87) | TCGA-D8-A1J8-01 | Breast | breast invasive carcinoma | Female | >=65 | I/II | Hormone Therapy | nolvadex | SD | |
| TENM3 | SNV | Missense_Mutation | rs751169755 | c.6521N>A | p.Arg2174His | p.R2174H | Q9P273 | protein_coding | tolerated(0.06) | probably_damaging(0.98) | TCGA-D8-A1XL-01 | Breast | breast invasive carcinoma | Female | <65 | I/II | Chemotherapy | doxorubicine+cyclophosphamide+tamoxifen | SD |
| Page: 1 2 3 4 5 6 7 8 9 10 11 12 13 14 15 16 17 18 19 20 21 22 23 24 25 26 27 28 29 30 31 32 33 34 35 36 37 38 39 40 41 |
Top |
Related drugs of malignant transformation related genes |
| Identification of chemicals and drugs interact with genes involved in malignant transfromation |
| (DGIdb 4.0) |
| Entrez ID | Symbol | Category | Interaction Types | Drug Claim Name | Drug Name | PMIDs |
| Page: 1 |

Copyright 2023-Present -The University of Texas Health Science Center at Houston |