
|
|||||
|
 | |
| |
| |
| |
| |
| |
|
Gene: TEN1 |
Gene summary for TEN1 |
| Gene information | Species | Human | Gene symbol | TEN1 | Gene ID | 100134934 |
| Gene name | TEN1 subunit of CST complex | |
| Gene Alias | C17orf106 | |
| Cytomap | 17q25.1 | |
| Gene Type | protein-coding | GO ID | GO:0000723 | UniProtAcc | Q86WV5 |
Top |
Malignant transformation analysis |
| Identification of the aberrant gene expression in precancerous and cancerous lesions by comparing the gene expression of stem-like cells in diseased tissues with normal stem cells |
| Entrez ID | Symbol | Replicates | Species | Organ | Tissue | Adj P-value | Log2FC | Malignancy |
| 100134934 | TEN1 | Pt13.b | Human | Liver | HCC | 5.24e-10 | 2.33e-01 | 0.0251 |
| 100134934 | TEN1 | S014 | Human | Liver | HCC | 1.87e-20 | 5.63e-01 | 0.2254 |
| 100134934 | TEN1 | S015 | Human | Liver | HCC | 2.84e-19 | 6.88e-01 | 0.2375 |
| 100134934 | TEN1 | S016 | Human | Liver | HCC | 6.39e-20 | 5.54e-01 | 0.2243 |
| 100134934 | TEN1 | S027 | Human | Liver | HCC | 6.93e-16 | 1.03e+00 | 0.2446 |
| 100134934 | TEN1 | S028 | Human | Liver | HCC | 9.41e-25 | 7.85e-01 | 0.2503 |
| 100134934 | TEN1 | S029 | Human | Liver | HCC | 1.74e-22 | 8.27e-01 | 0.2581 |
| 100134934 | TEN1 | P4_S8_cSCC | Human | Skin | cSCC | 2.93e-03 | 1.24e-01 | -0.3095 |
| 100134934 | TEN1 | P1_cSCC | Human | Skin | cSCC | 3.18e-22 | 7.20e-01 | 0.0292 |
| 100134934 | TEN1 | P2_cSCC | Human | Skin | cSCC | 7.95e-09 | 3.64e-01 | -0.024 |
| 100134934 | TEN1 | P4_cSCC | Human | Skin | cSCC | 7.00e-12 | 3.67e-01 | -0.00290000000000005 |
| 100134934 | TEN1 | P10_cSCC | Human | Skin | cSCC | 2.63e-10 | 3.79e-01 | 0.1017 |
| 100134934 | TEN1 | cSCC_p1 | Human | Skin | cSCC | 9.41e-05 | -1.90e-01 | -0.1916 |
| 100134934 | TEN1 | cSCC_p10 | Human | Skin | cSCC | 2.00e-04 | -1.91e-01 | -0.2095 |
| 100134934 | TEN1 | cSCC_p11 | Human | Skin | cSCC | 4.43e-05 | -1.91e-01 | -0.2102 |
| 100134934 | TEN1 | cSCC_p3 | Human | Skin | cSCC | 2.00e-04 | -1.91e-01 | -0.2085 |
| 100134934 | TEN1 | cSCC_p4 | Human | Skin | cSCC | 9.41e-05 | -1.91e-01 | -0.2022 |
| 100134934 | TEN1 | cSCC_p6 | Human | Skin | cSCC | 2.00e-04 | -1.91e-01 | -0.1989 |
| 100134934 | TEN1 | cSCC_p7 | Human | Skin | cSCC | 9.41e-05 | -1.91e-01 | -0.2332 |
| 100134934 | TEN1 | cSCC_p8 | Human | Skin | cSCC | 4.24e-04 | -1.91e-01 | -0.1971 |
| Page: 1 2 |
| Tissue | Expression Dynamics | Abbreviation |
| Liver |  | HCC: Hepatocellular carcinoma |
| NAFLD: Non-alcoholic fatty liver disease | ||
| Skin | 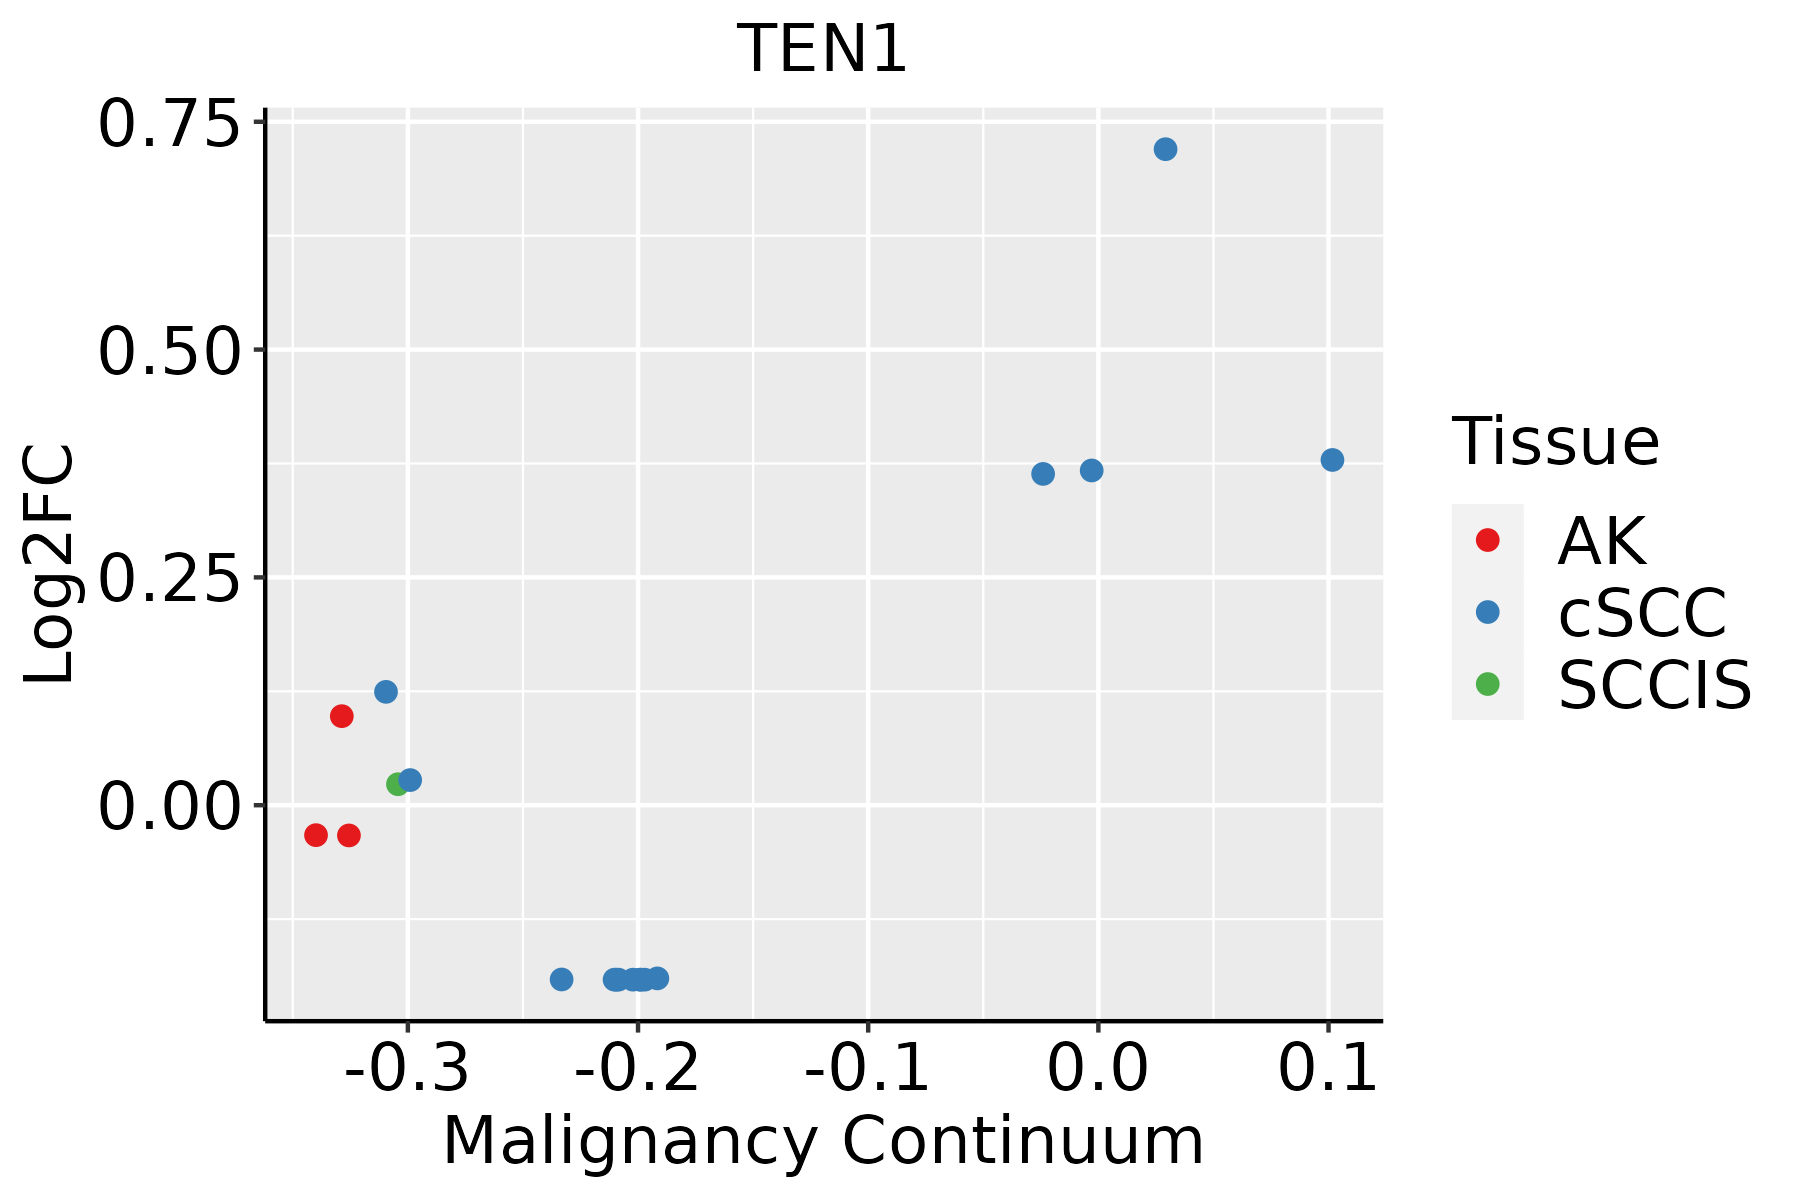 | AK: Actinic keratosis |
| cSCC: Cutaneous squamous cell carcinoma | ||
| SCCIS:squamous cell carcinoma in situ |
| ∗log2FC in expression of this searched gene in stem-like cells from each diseased tissue sample relative to stem-like cells in normal samples in each tissue plotted against the malignancy continuum. Samples are colored based on if they are from different disease stage. |
Top |
Malignant transformation related pathway analysis |
| Find out the enriched GO biological processes and KEGG pathways involved in transition from healthy to precancer to cancer |
| Tissue | Disease Stage | Enriched GO biological Processes |
| Colorectum | AD |  |
| Colorectum | SER |  |
| Colorectum | MSS |  |
| Colorectum | MSI-H |  |
| Colorectum | FAP |  |
| ∗Top 15 enriched GO BP terms are showed in the bar plot of each disease state in each tissue. Each row represents a significant GO biological process which is colored according to the -log10(p.adjust). |
| Page: 1 2 3 4 5 6 7 8 9 |
| GO ID | Tissue | Disease Stage | Description | Gene Ratio | Bg Ratio | pvalue | p.adjust | Count |
| GO:003304421 | Liver | HCC | regulation of chromosome organization | 125/7958 | 187/18723 | 1.35e-11 | 5.40e-10 | 125 |
| GO:005134822 | Liver | HCC | negative regulation of transferase activity | 166/7958 | 268/18723 | 8.97e-11 | 3.18e-09 | 166 |
| GO:001063912 | Liver | HCC | negative regulation of organelle organization | 204/7958 | 348/18723 | 7.67e-10 | 2.37e-08 | 204 |
| GO:000072311 | Liver | HCC | telomere maintenance | 85/7958 | 131/18723 | 1.86e-07 | 3.40e-06 | 85 |
| GO:005105221 | Liver | HCC | regulation of DNA metabolic process | 198/7958 | 359/18723 | 7.62e-07 | 1.17e-05 | 198 |
| GO:000700412 | Liver | HCC | telomere maintenance via telomerase | 49/7958 | 69/18723 | 1.51e-06 | 2.15e-05 | 49 |
| GO:003220411 | Liver | HCC | regulation of telomere maintenance | 55/7958 | 80/18723 | 1.83e-06 | 2.54e-05 | 55 |
| GO:000627811 | Liver | HCC | RNA-dependent DNA biosynthetic process | 50/7958 | 75/18723 | 2.02e-05 | 2.17e-04 | 50 |
| GO:2001251 | Liver | HCC | negative regulation of chromosome organization | 55/7958 | 86/18723 | 4.80e-05 | 4.60e-04 | 55 |
| GO:003221011 | Liver | HCC | regulation of telomere maintenance via telomerase | 37/7958 | 53/18723 | 5.28e-05 | 5.01e-04 | 37 |
| GO:001083322 | Liver | HCC | telomere maintenance via telomere lengthening | 52/7958 | 81/18723 | 6.59e-05 | 6.00e-04 | 52 |
| GO:200027812 | Liver | HCC | regulation of DNA biosynthetic process | 64/7958 | 106/18723 | 1.53e-04 | 1.23e-03 | 64 |
| GO:190435621 | Liver | HCC | regulation of telomere maintenance via telomere lengthening | 40/7958 | 61/18723 | 2.30e-04 | 1.75e-03 | 40 |
| GO:00718975 | Liver | HCC | DNA biosynthetic process | 99/7958 | 180/18723 | 4.66e-04 | 3.08e-03 | 99 |
| GO:00322001 | Liver | HCC | telomere organization | 86/7958 | 159/18723 | 2.06e-03 | 1.04e-02 | 86 |
| GO:00519727 | Liver | HCC | regulation of telomerase activity | 29/7958 | 47/18723 | 6.16e-03 | 2.52e-02 | 29 |
| GO:0032211 | Liver | HCC | negative regulation of telomere maintenance via telomerase | 14/7958 | 20/18723 | 1.21e-02 | 4.41e-02 | 14 |
| GO:0032205 | Liver | HCC | negative regulation of telomere maintenance | 22/7958 | 35/18723 | 1.21e-02 | 4.41e-02 | 22 |
| GO:0016233 | Liver | HCC | telomere capping | 24/7958 | 39/18723 | 1.28e-02 | 4.61e-02 | 24 |
| GO:003304417 | Skin | cSCC | regulation of chromosome organization | 100/4864 | 187/18723 | 8.97e-16 | 7.70e-14 | 100 |
| Page: 1 2 |
| Pathway ID | Tissue | Disease Stage | Description | Gene Ratio | Bg Ratio | pvalue | p.adjust | qvalue | Count |
| Page: 1 |
Top |
Cell-cell communication analysis |
| Identification of potential cell-cell interactions between two cell types and their ligand-receptor pairs for different disease states |
| Ligand | Receptor | LRpair | Pathway | Tissue | Disease Stage |
| Page: 1 |
Top |
Single-cell gene regulatory network inference analysis |
| Find out the significant the regulons (TFs) and the target genes of each regulon across cell types for different disease states |
| TF | Cell Type | Tissue | Disease Stage | Target Gene | RSS | Regulon Activity |
| ∗The dot plots of a searched regulon are shown for all cell subpopulations in each disease state of each tissue based on the regulon specific score inferred using pySCENIC and by calculating the average expression. |
| Page: 1 |
Top |
Somatic mutation of malignant transformation related genes |
| Annotation of somatic variants for genes involved in malignant transformation |
| Hugo Symbol | Variant Class | Variant Classification | dbSNP RS | HGVSc | HGVSp | HGVSp Short | SWISSPROT | BIOTYPE | SIFT | PolyPhen | Tumor Sample Barcode | Tissue | Histology | Sex | Age | Stage | Therapy Types | Drugs | Outcome |
| TEN1 | SNV | Missense_Mutation | novel | c.355N>T | p.Arg119Trp | p.R119W | Q86WV5 | protein_coding | deleterious(0) | probably_damaging(0.988) | TCGA-AJ-A3EL-01 | Endometrium | uterine corpus endometrioid carcinoma | Female | <65 | I/II | Unknown | Unknown | SD |
| TEN1 | SNV | Missense_Mutation | rs759172427 | c.50N>T | p.Ala17Val | p.A17V | Q86WV5 | protein_coding | tolerated(0.07) | possibly_damaging(0.786) | TCGA-AP-A1DK-01 | Endometrium | uterine corpus endometrioid carcinoma | Female | <65 | I/II | Unknown | Unknown | SD |
| TEN1 | SNV | Missense_Mutation | c.223N>A | p.Val75Ile | p.V75I | Q86WV5 | protein_coding | deleterious(0.02) | benign(0.322) | TCGA-AX-A1C9-01 | Endometrium | uterine corpus endometrioid carcinoma | Female | >=65 | I/II | Unknown | Unknown | SD |
| Page: 1 |
Top |
Related drugs of malignant transformation related genes |
| Identification of chemicals and drugs interact with genes involved in malignant transfromation |
| (DGIdb 4.0) |
| Entrez ID | Symbol | Category | Interaction Types | Drug Claim Name | Drug Name | PMIDs |
| Page: 1 |

Copyright 2023-Present -The University of Texas Health Science Center at Houston |