
|
|||||
|
 | |
| |
| |
| |
| |
| |
|
Gene: TECPR2 |
Gene summary for TECPR2 |
| Gene information | Species | Human | Gene symbol | TECPR2 | Gene ID | 9895 |
| Gene name | tectonin beta-propeller repeat containing 2 | |
| Gene Alias | KIAA0329 | |
| Cytomap | 14q32.31 | |
| Gene Type | protein-coding | GO ID | GO:0006810 | UniProtAcc | O15040 |
Top |
Malignant transformation analysis |
| Identification of the aberrant gene expression in precancerous and cancerous lesions by comparing the gene expression of stem-like cells in diseased tissues with normal stem cells |
| Entrez ID | Symbol | Replicates | Species | Organ | Tissue | Adj P-value | Log2FC | Malignancy |
| 9895 | TECPR2 | LZE20T | Human | Esophagus | ESCC | 5.39e-05 | 2.22e-01 | 0.0662 |
| 9895 | TECPR2 | LZE24T | Human | Esophagus | ESCC | 1.03e-04 | 1.45e-01 | 0.0596 |
| 9895 | TECPR2 | P2T-E | Human | Esophagus | ESCC | 2.25e-07 | 2.04e-01 | 0.1177 |
| 9895 | TECPR2 | P4T-E | Human | Esophagus | ESCC | 3.53e-07 | 1.91e-01 | 0.1323 |
| 9895 | TECPR2 | P5T-E | Human | Esophagus | ESCC | 3.76e-03 | 6.85e-02 | 0.1327 |
| 9895 | TECPR2 | P8T-E | Human | Esophagus | ESCC | 4.65e-07 | 1.82e-01 | 0.0889 |
| 9895 | TECPR2 | P10T-E | Human | Esophagus | ESCC | 2.34e-11 | 2.53e-01 | 0.116 |
| 9895 | TECPR2 | P11T-E | Human | Esophagus | ESCC | 1.37e-03 | 1.74e-01 | 0.1426 |
| 9895 | TECPR2 | P12T-E | Human | Esophagus | ESCC | 8.24e-11 | 2.55e-01 | 0.1122 |
| 9895 | TECPR2 | P15T-E | Human | Esophagus | ESCC | 1.54e-11 | 3.07e-01 | 0.1149 |
| 9895 | TECPR2 | P16T-E | Human | Esophagus | ESCC | 6.99e-10 | 1.29e-01 | 0.1153 |
| 9895 | TECPR2 | P20T-E | Human | Esophagus | ESCC | 1.04e-03 | 1.41e-01 | 0.1124 |
| 9895 | TECPR2 | P21T-E | Human | Esophagus | ESCC | 4.06e-05 | 9.27e-02 | 0.1617 |
| 9895 | TECPR2 | P22T-E | Human | Esophagus | ESCC | 2.61e-05 | 1.26e-01 | 0.1236 |
| 9895 | TECPR2 | P23T-E | Human | Esophagus | ESCC | 1.68e-06 | 1.38e-01 | 0.108 |
| 9895 | TECPR2 | P24T-E | Human | Esophagus | ESCC | 7.21e-04 | 1.25e-01 | 0.1287 |
| 9895 | TECPR2 | P26T-E | Human | Esophagus | ESCC | 1.18e-09 | 2.20e-01 | 0.1276 |
| 9895 | TECPR2 | P27T-E | Human | Esophagus | ESCC | 7.22e-17 | 3.22e-01 | 0.1055 |
| 9895 | TECPR2 | P28T-E | Human | Esophagus | ESCC | 1.94e-09 | 2.02e-01 | 0.1149 |
| 9895 | TECPR2 | P30T-E | Human | Esophagus | ESCC | 8.88e-05 | 2.63e-01 | 0.137 |
| Page: 1 2 3 |
| Tissue | Expression Dynamics | Abbreviation |
| Esophagus | 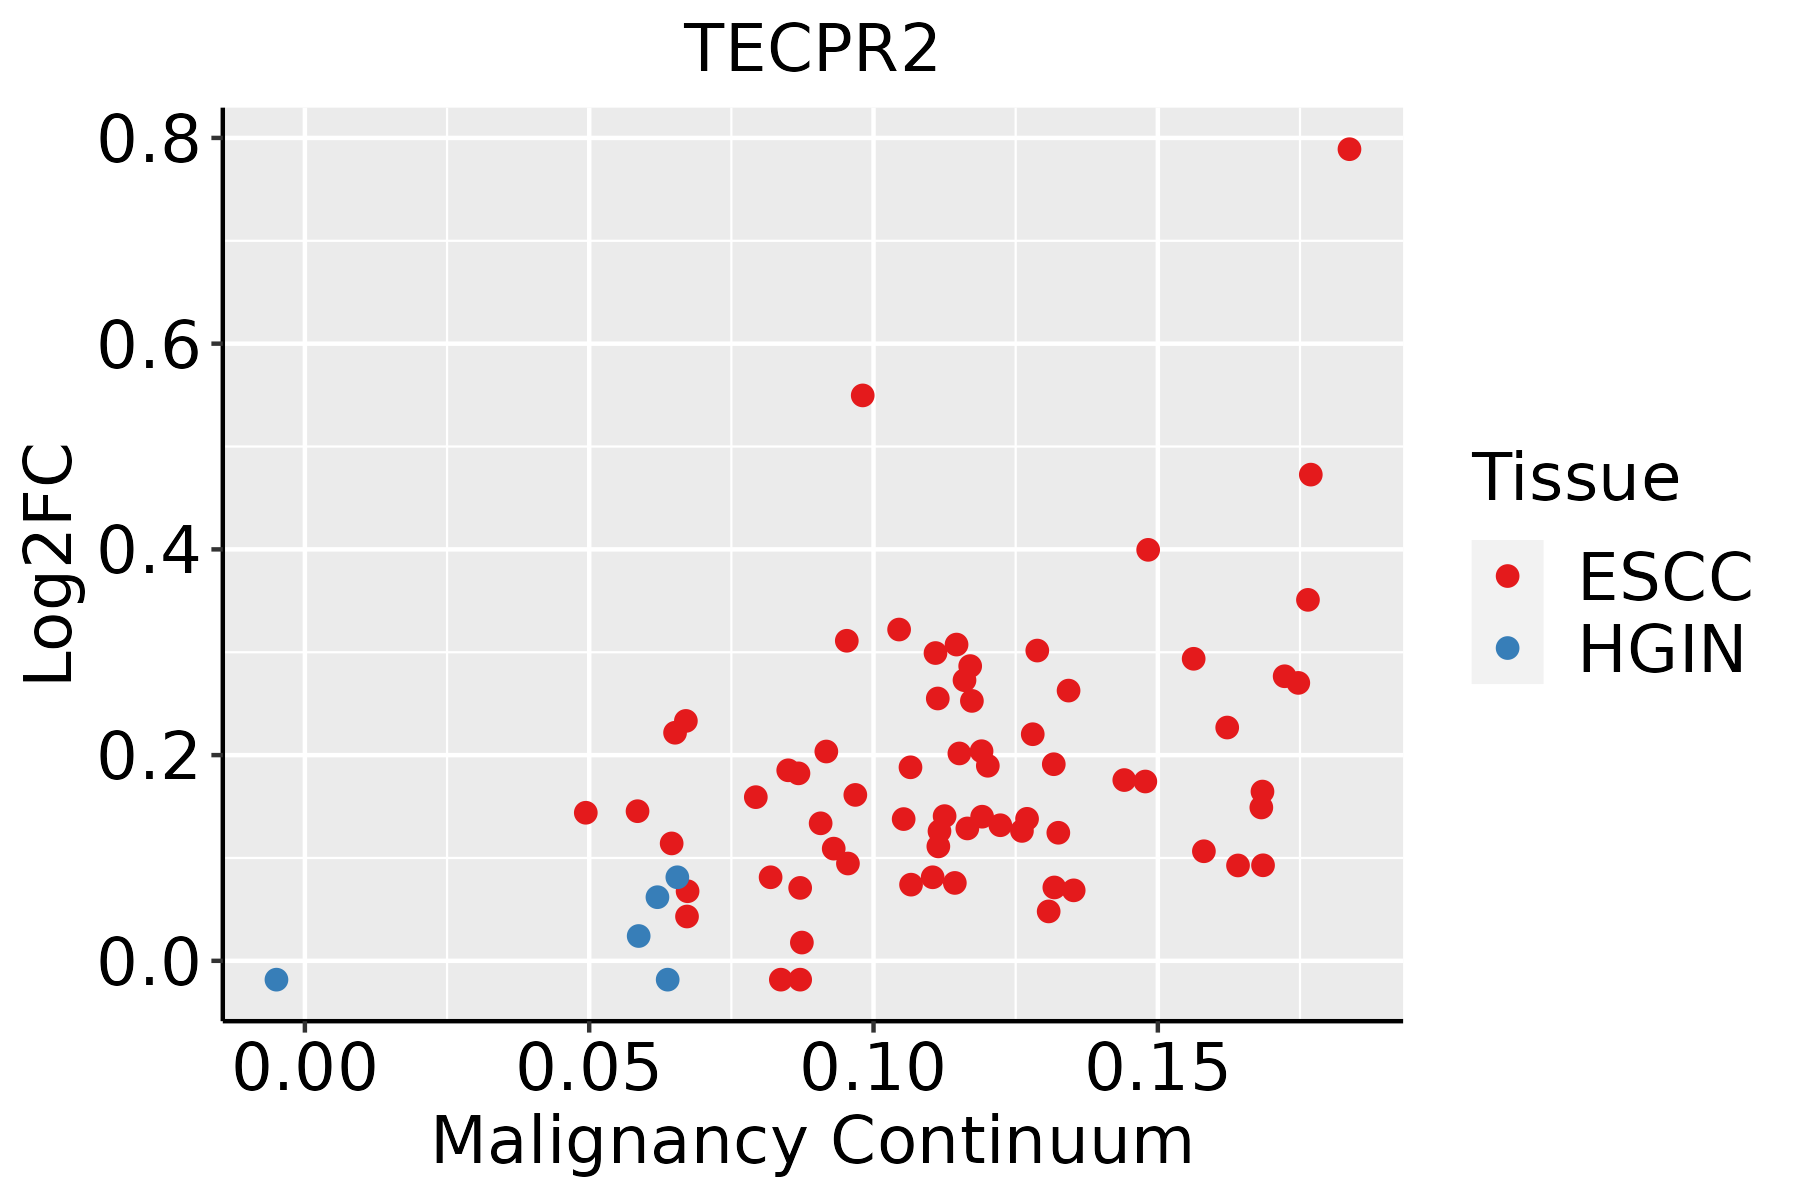 | ESCC: Esophageal squamous cell carcinoma |
| HGIN: High-grade intraepithelial neoplasias | ||
| LGIN: Low-grade intraepithelial neoplasias |
| ∗log2FC in expression of this searched gene in stem-like cells from each diseased tissue sample relative to stem-like cells in normal samples in each tissue plotted against the malignancy continuum. Samples are colored based on if they are from different disease stage. |
Top |
Malignant transformation related pathway analysis |
| Find out the enriched GO biological processes and KEGG pathways involved in transition from healthy to precancer to cancer |
| Tissue | Disease Stage | Enriched GO biological Processes |
| Colorectum | AD |  |
| Colorectum | SER |  |
| Colorectum | MSS |  |
| Colorectum | MSI-H |  |
| Colorectum | FAP |  |
| ∗Top 15 enriched GO BP terms are showed in the bar plot of each disease state in each tissue. Each row represents a significant GO biological process which is colored according to the -log10(p.adjust). |
| Page: 1 2 3 4 5 6 7 8 9 |
| GO ID | Tissue | Disease Stage | Description | Gene Ratio | Bg Ratio | pvalue | p.adjust | Count |
| GO:003252714 | Esophagus | ESCC | protein exit from endoplasmic reticulum | 37/8552 | 48/18723 | 8.99e-06 | 8.65e-05 | 37 |
| Page: 1 |
| Pathway ID | Tissue | Disease Stage | Description | Gene Ratio | Bg Ratio | pvalue | p.adjust | qvalue | Count |
| Page: 1 |
Top |
Cell-cell communication analysis |
| Identification of potential cell-cell interactions between two cell types and their ligand-receptor pairs for different disease states |
| Ligand | Receptor | LRpair | Pathway | Tissue | Disease Stage |
| Page: 1 |
Top |
Single-cell gene regulatory network inference analysis |
| Find out the significant the regulons (TFs) and the target genes of each regulon across cell types for different disease states |
| TF | Cell Type | Tissue | Disease Stage | Target Gene | RSS | Regulon Activity |
| ∗The dot plots of a searched regulon are shown for all cell subpopulations in each disease state of each tissue based on the regulon specific score inferred using pySCENIC and by calculating the average expression. |
| Page: 1 |
Top |
Somatic mutation of malignant transformation related genes |
| Annotation of somatic variants for genes involved in malignant transformation |
| Hugo Symbol | Variant Class | Variant Classification | dbSNP RS | HGVSc | HGVSp | HGVSp Short | SWISSPROT | BIOTYPE | SIFT | PolyPhen | Tumor Sample Barcode | Tissue | Histology | Sex | Age | Stage | Therapy Types | Drugs | Outcome |
| TECPR2 | SNV | Missense_Mutation | novel | c.2527C>T | p.Arg843Cys | p.R843C | O15040 | protein_coding | deleterious(0.04) | probably_damaging(0.93) | TCGA-3C-AALK-01 | Breast | breast invasive carcinoma | Female | <65 | I/II | Chemotherapy | docetaxel | SD |
| TECPR2 | SNV | Missense_Mutation | c.1965N>G | p.Ser655Arg | p.S655R | O15040 | protein_coding | tolerated_low_confidence(0.15) | benign(0) | TCGA-A2-A0T0-01 | Breast | breast invasive carcinoma | Female | <65 | I/II | Chemotherapy | taxotere | SD | |
| TECPR2 | SNV | Missense_Mutation | novel | c.521C>T | p.Ser174Phe | p.S174F | O15040 | protein_coding | deleterious(0.01) | possibly_damaging(0.664) | TCGA-BH-A0B6-01 | Breast | breast invasive carcinoma | Female | <65 | I/II | Unknown | Unknown | SD |
| TECPR2 | SNV | Missense_Mutation | novel | c.302T>G | p.Val101Gly | p.V101G | O15040 | protein_coding | deleterious(0) | probably_damaging(0.924) | TCGA-BH-A1FM-01 | Breast | breast invasive carcinoma | Female | <65 | III/IV | Unknown | Unknown | SD |
| TECPR2 | SNV | Missense_Mutation | novel | c.3853G>C | p.Asp1285His | p.D1285H | O15040 | protein_coding | deleterious(0) | probably_damaging(0.983) | TCGA-GM-A2DB-01 | Breast | breast invasive carcinoma | Female | <65 | I/II | Chemotherapy | taxol | CR |
| TECPR2 | SNV | Missense_Mutation | rs376123886 | c.4189G>A | p.Ala1397Thr | p.A1397T | O15040 | protein_coding | tolerated(0.44) | benign(0) | TCGA-S3-AA11-01 | Breast | breast invasive carcinoma | Female | >=65 | I/II | Hormone Therapy | letrozole | CR |
| TECPR2 | insertion | Frame_Shift_Ins | novel | c.1834_1835insTTTATTTATTTTTTATTTATTGGAGACAG | p.Gln612LeufsTer44 | p.Q612Lfs*44 | O15040 | protein_coding | TCGA-A8-A07G-01 | Breast | breast invasive carcinoma | Female | >=65 | I/II | Chemotherapy | 5-fluorouracil | CR | ||
| TECPR2 | insertion | Frame_Shift_Ins | novel | c.1115_1116insCAGAC | p.Glu373ArgfsTer88 | p.E373Rfs*88 | O15040 | protein_coding | TCGA-A8-A09M-01 | Breast | breast invasive carcinoma | Female | >=65 | III/IV | Chemotherapy | paclitaxel | CR | ||
| TECPR2 | insertion | In_Frame_Ins | novel | c.2003_2004insCCTGCTAAATTTTGAGACTCCGTCTCAAAA | p.Arg668delinsSerLeuLeuAsnPheGluThrProSerGlnLys | p.R668delinsSLLNFETPSQK | O15040 | protein_coding | TCGA-B6-A0IA-01 | Breast | breast invasive carcinoma | Female | <65 | I/II | Unknown | Unknown | SD | ||
| TECPR2 | insertion | Frame_Shift_Ins | novel | c.312dupT | p.Gln105SerfsTer11 | p.Q105Sfs*11 | O15040 | protein_coding | TCGA-BH-A18G-01 | Breast | breast invasive carcinoma | Female | >=65 | I/II | Unknown | Unknown | SD |
| Page: 1 2 3 4 5 6 7 8 9 10 11 12 13 |
Top |
Related drugs of malignant transformation related genes |
| Identification of chemicals and drugs interact with genes involved in malignant transfromation |
| (DGIdb 4.0) |
| Entrez ID | Symbol | Category | Interaction Types | Drug Claim Name | Drug Name | PMIDs |
| Page: 1 |

Copyright 2023-Present -The University of Texas Health Science Center at Houston |