
|
|||||
|
 | |
| |
| |
| |
| |
| |
|
Gene: TECPR1 |
Gene summary for TECPR1 |
| Gene information | Species | Human | Gene symbol | TECPR1 | Gene ID | 25851 |
| Gene name | tectonin beta-propeller repeat containing 1 | |
| Gene Alias | TECPR1 | |
| Cytomap | 7q21.3 | |
| Gene Type | protein-coding | GO ID | GO:0006914 | UniProtAcc | Q7Z6L1 |
Top |
Malignant transformation analysis |
| Identification of the aberrant gene expression in precancerous and cancerous lesions by comparing the gene expression of stem-like cells in diseased tissues with normal stem cells |
| Entrez ID | Symbol | Replicates | Species | Organ | Tissue | Adj P-value | Log2FC | Malignancy |
| 25851 | TECPR1 | LZE7T | Human | Esophagus | ESCC | 2.49e-03 | 1.31e-01 | 0.0667 |
| 25851 | TECPR1 | LZE24T | Human | Esophagus | ESCC | 7.68e-07 | 7.92e-02 | 0.0596 |
| 25851 | TECPR1 | P1T-E | Human | Esophagus | ESCC | 6.34e-04 | 2.68e-01 | 0.0875 |
| 25851 | TECPR1 | P2T-E | Human | Esophagus | ESCC | 3.61e-05 | 1.39e-01 | 0.1177 |
| 25851 | TECPR1 | P4T-E | Human | Esophagus | ESCC | 9.70e-05 | 5.32e-02 | 0.1323 |
| 25851 | TECPR1 | P5T-E | Human | Esophagus | ESCC | 4.17e-05 | 8.31e-02 | 0.1327 |
| 25851 | TECPR1 | P8T-E | Human | Esophagus | ESCC | 9.20e-06 | 1.04e-01 | 0.0889 |
| 25851 | TECPR1 | P9T-E | Human | Esophagus | ESCC | 5.51e-03 | 3.86e-02 | 0.1131 |
| 25851 | TECPR1 | P10T-E | Human | Esophagus | ESCC | 4.31e-06 | 9.53e-02 | 0.116 |
| 25851 | TECPR1 | P11T-E | Human | Esophagus | ESCC | 3.21e-06 | 1.50e-01 | 0.1426 |
| 25851 | TECPR1 | P12T-E | Human | Esophagus | ESCC | 4.41e-07 | 1.16e-01 | 0.1122 |
| 25851 | TECPR1 | P15T-E | Human | Esophagus | ESCC | 7.46e-09 | 1.65e-01 | 0.1149 |
| 25851 | TECPR1 | P16T-E | Human | Esophagus | ESCC | 4.29e-24 | 4.28e-01 | 0.1153 |
| 25851 | TECPR1 | P17T-E | Human | Esophagus | ESCC | 2.77e-04 | 1.95e-01 | 0.1278 |
| 25851 | TECPR1 | P19T-E | Human | Esophagus | ESCC | 3.38e-03 | 2.55e-01 | 0.1662 |
| 25851 | TECPR1 | P20T-E | Human | Esophagus | ESCC | 1.34e-12 | 1.63e-01 | 0.1124 |
| 25851 | TECPR1 | P21T-E | Human | Esophagus | ESCC | 3.68e-05 | 1.12e-01 | 0.1617 |
| 25851 | TECPR1 | P22T-E | Human | Esophagus | ESCC | 4.99e-03 | 7.51e-02 | 0.1236 |
| 25851 | TECPR1 | P23T-E | Human | Esophagus | ESCC | 1.89e-06 | 1.22e-01 | 0.108 |
| 25851 | TECPR1 | P26T-E | Human | Esophagus | ESCC | 9.20e-06 | 1.07e-01 | 0.1276 |
| Page: 1 2 3 4 |
| Tissue | Expression Dynamics | Abbreviation |
| Esophagus | 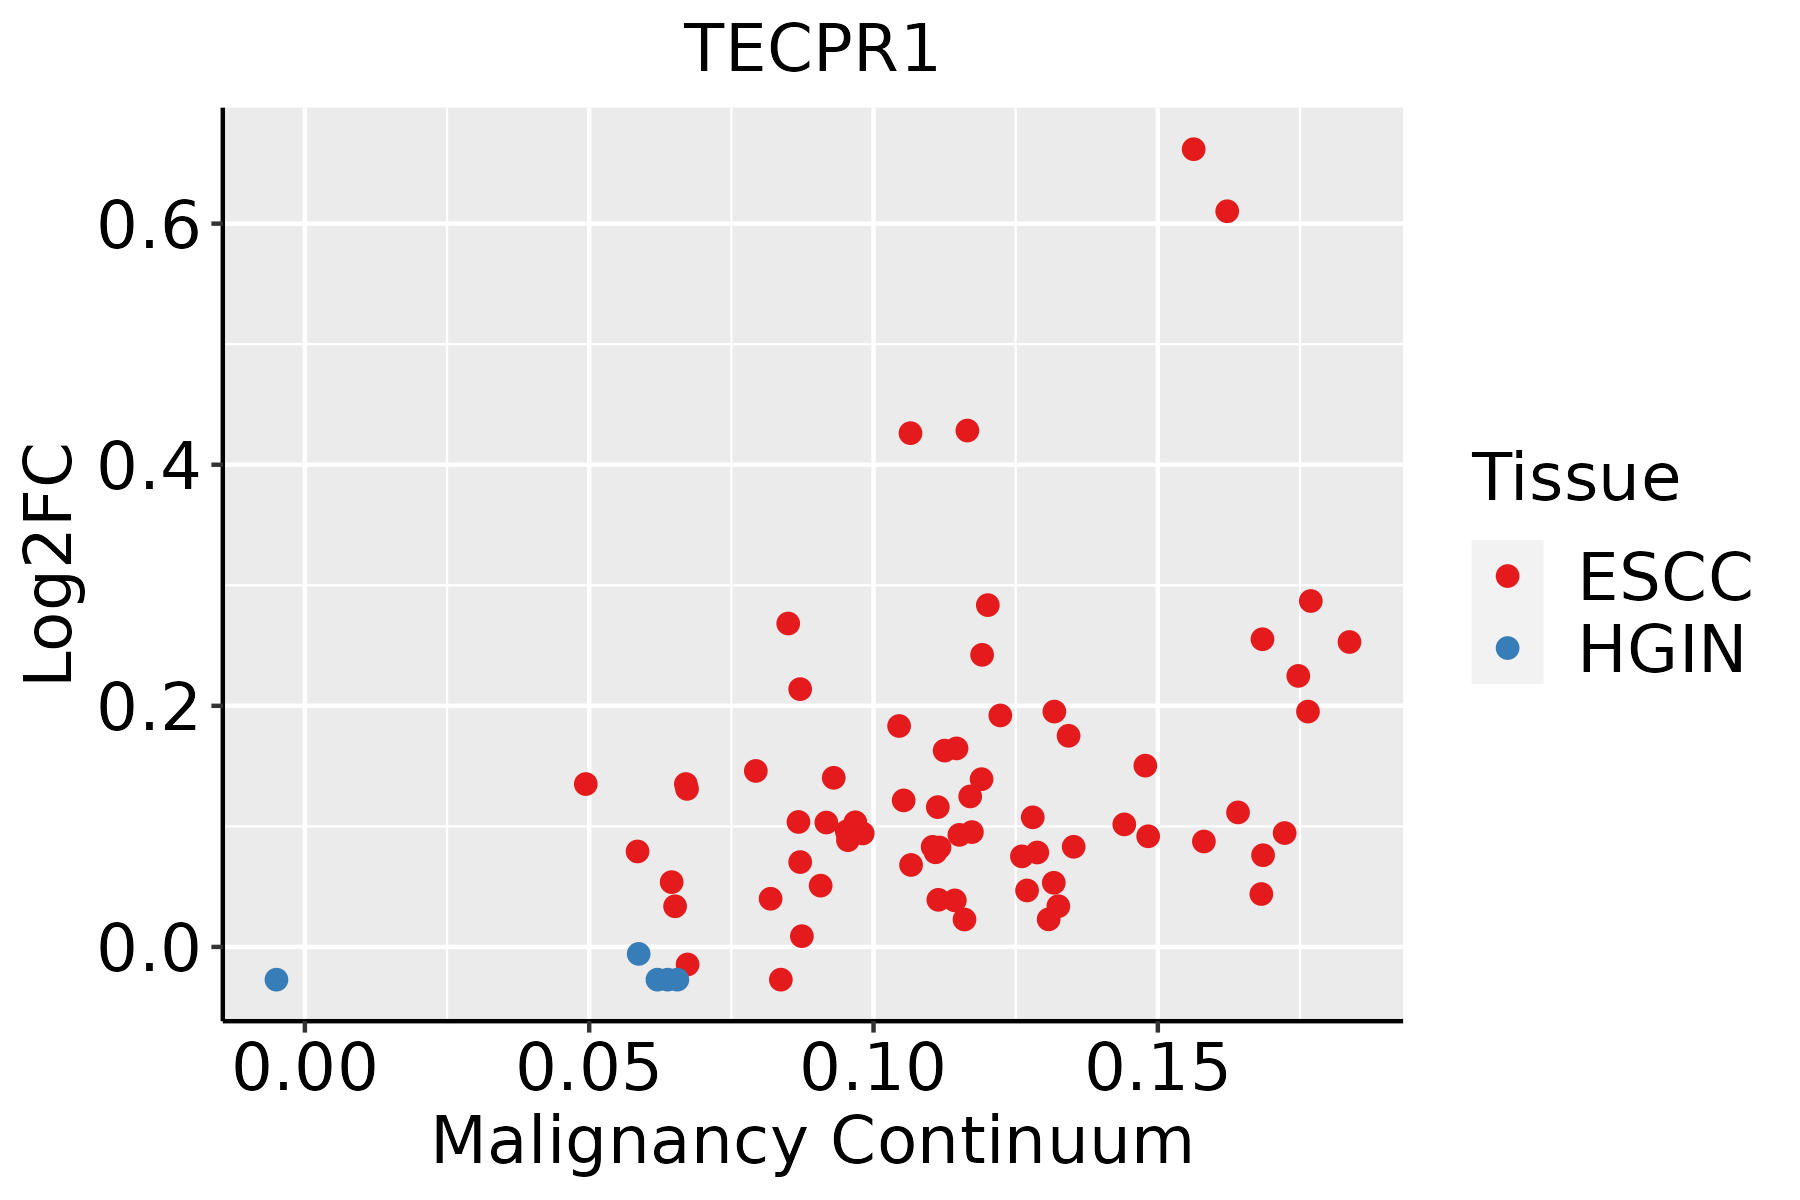 | ESCC: Esophageal squamous cell carcinoma |
| HGIN: High-grade intraepithelial neoplasias | ||
| LGIN: Low-grade intraepithelial neoplasias | ||
| Liver | 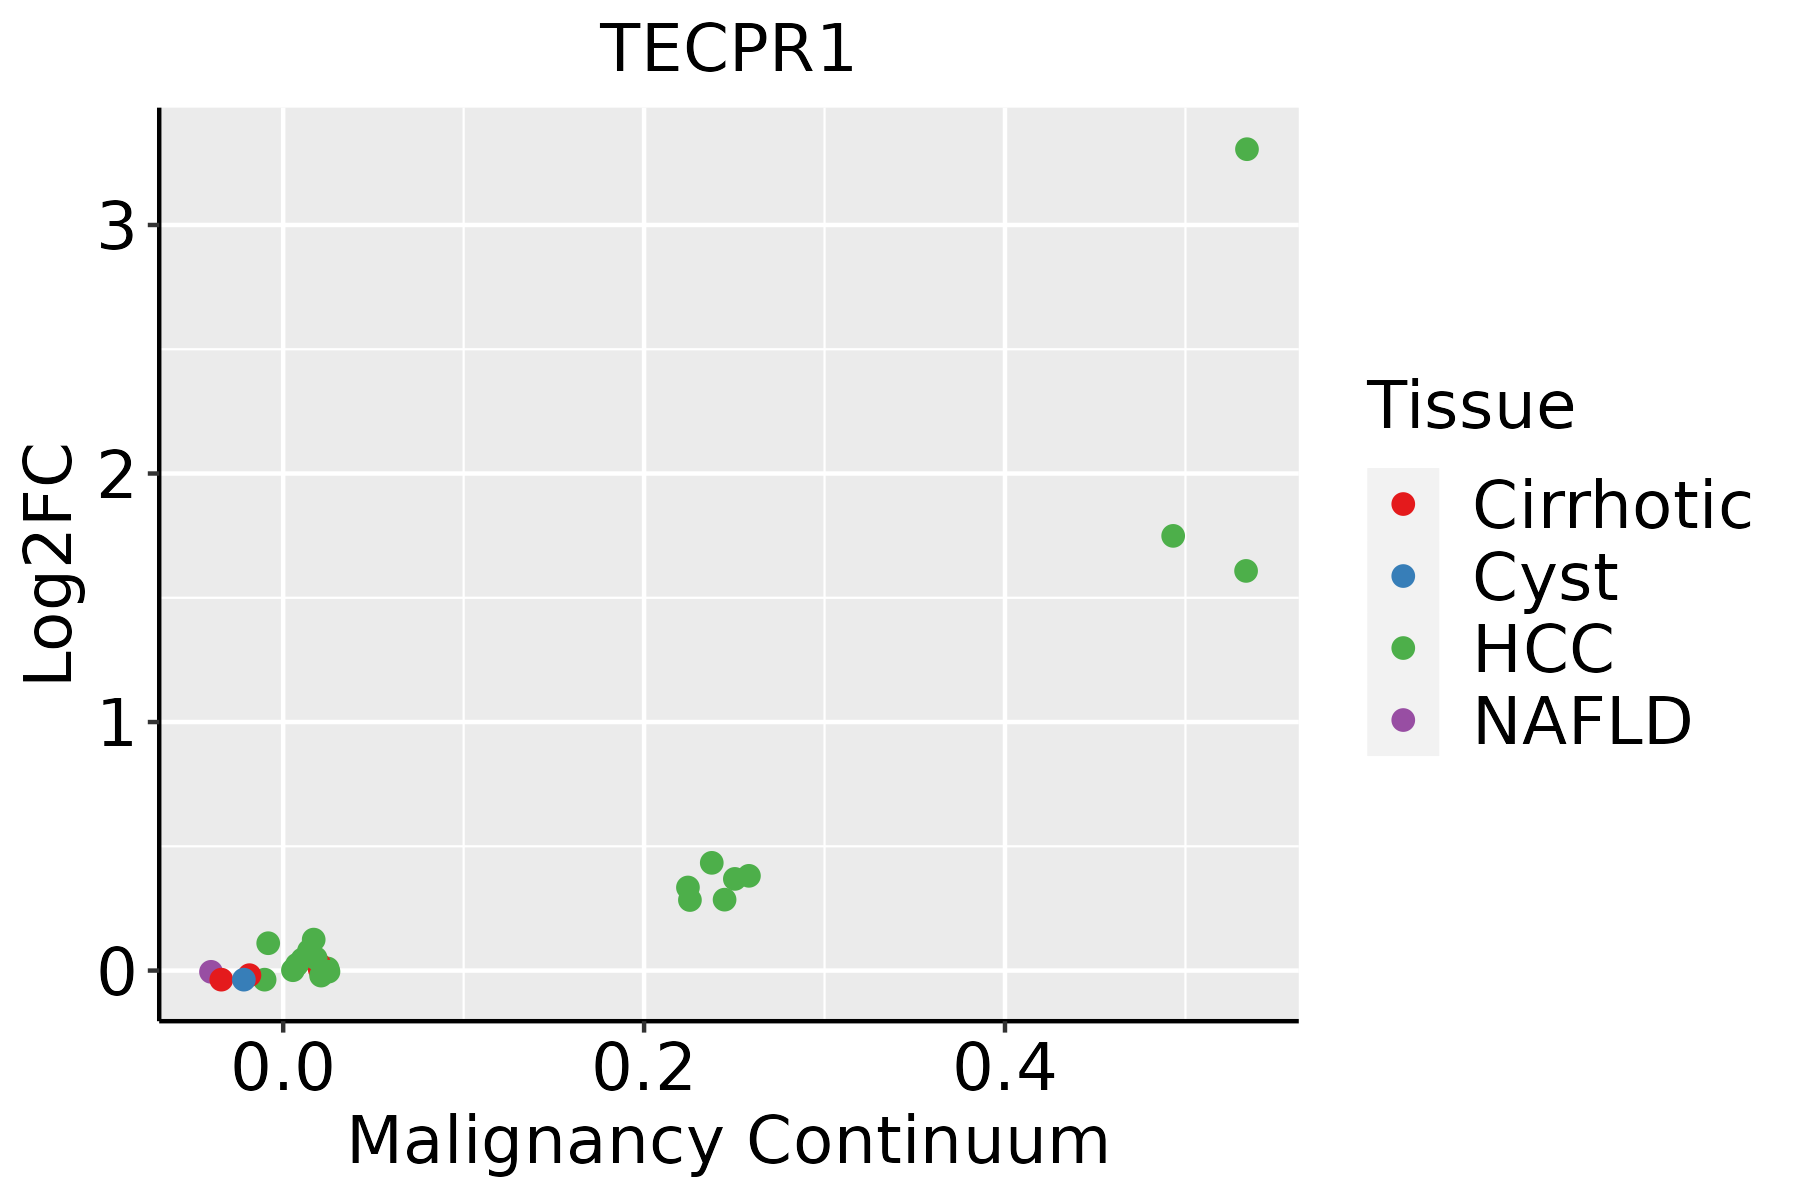 | HCC: Hepatocellular carcinoma |
| NAFLD: Non-alcoholic fatty liver disease | ||
| Thyroid |  | ATC: Anaplastic thyroid cancer |
| HT: Hashimoto's thyroiditis | ||
| PTC: Papillary thyroid cancer |
| ∗log2FC in expression of this searched gene in stem-like cells from each diseased tissue sample relative to stem-like cells in normal samples in each tissue plotted against the malignancy continuum. Samples are colored based on if they are from different disease stage. |
Top |
Malignant transformation related pathway analysis |
| Find out the enriched GO biological processes and KEGG pathways involved in transition from healthy to precancer to cancer |
| Tissue | Disease Stage | Enriched GO biological Processes |
| Colorectum | AD |  |
| Colorectum | SER |  |
| Colorectum | MSS |  |
| Colorectum | MSI-H |  |
| Colorectum | FAP |  |
| ∗Top 15 enriched GO BP terms are showed in the bar plot of each disease state in each tissue. Each row represents a significant GO biological process which is colored according to the -log10(p.adjust). |
| Page: 1 2 3 4 5 6 7 8 9 |
| GO ID | Tissue | Disease Stage | Description | Gene Ratio | Bg Ratio | pvalue | p.adjust | Count |
| GO:001623617 | Esophagus | ESCC | macroautophagy | 216/8552 | 291/18723 | 1.94e-23 | 4.57e-21 | 216 |
| GO:0022411111 | Esophagus | ESCC | cellular component disassembly | 305/8552 | 443/18723 | 1.94e-23 | 4.57e-21 | 305 |
| GO:003298416 | Esophagus | ESCC | protein-containing complex disassembly | 151/8552 | 224/18723 | 3.45e-11 | 1.15e-09 | 151 |
| GO:00973523 | Esophagus | ESCC | autophagosome maturation | 31/8552 | 40/18723 | 4.04e-05 | 3.26e-04 | 31 |
| GO:001623621 | Liver | HCC | macroautophagy | 204/7958 | 291/18723 | 8.66e-22 | 1.41e-19 | 204 |
| GO:002241112 | Liver | HCC | cellular component disassembly | 282/7958 | 443/18723 | 1.02e-19 | 1.38e-17 | 282 |
| GO:003298411 | Liver | HCC | protein-containing complex disassembly | 138/7958 | 224/18723 | 5.59e-09 | 1.46e-07 | 138 |
| GO:00973521 | Liver | HCC | autophagosome maturation | 30/7958 | 40/18723 | 3.04e-05 | 3.12e-04 | 30 |
| GO:0022411113 | Thyroid | PTC | cellular component disassembly | 232/5968 | 443/18723 | 1.36e-19 | 1.75e-17 | 232 |
| GO:0016236110 | Thyroid | PTC | macroautophagy | 167/5968 | 291/18723 | 1.51e-19 | 1.91e-17 | 167 |
| GO:0032984110 | Thyroid | PTC | protein-containing complex disassembly | 114/5968 | 224/18723 | 2.26e-09 | 6.33e-08 | 114 |
| GO:002241124 | Thyroid | ATC | cellular component disassembly | 248/6293 | 443/18723 | 1.34e-22 | 3.69e-20 | 248 |
| GO:001623623 | Thyroid | ATC | macroautophagy | 169/6293 | 291/18723 | 6.56e-18 | 7.69e-16 | 169 |
| GO:003298422 | Thyroid | ATC | protein-containing complex disassembly | 121/6293 | 224/18723 | 2.25e-10 | 6.59e-09 | 121 |
| Page: 1 |
| Pathway ID | Tissue | Disease Stage | Description | Gene Ratio | Bg Ratio | pvalue | p.adjust | qvalue | Count |
| hsa05131211 | Esophagus | ESCC | Shigellosis | 176/4205 | 247/8465 | 2.27e-12 | 4.01e-11 | 2.05e-11 | 176 |
| hsa05131310 | Esophagus | ESCC | Shigellosis | 176/4205 | 247/8465 | 2.27e-12 | 4.01e-11 | 2.05e-11 | 176 |
| hsa0513142 | Liver | HCC | Shigellosis | 150/4020 | 247/8465 | 1.53e-05 | 1.04e-04 | 5.81e-05 | 150 |
| hsa0513152 | Liver | HCC | Shigellosis | 150/4020 | 247/8465 | 1.53e-05 | 1.04e-04 | 5.81e-05 | 150 |
| Page: 1 |
Top |
Cell-cell communication analysis |
| Identification of potential cell-cell interactions between two cell types and their ligand-receptor pairs for different disease states |
| Ligand | Receptor | LRpair | Pathway | Tissue | Disease Stage |
| Page: 1 |
Top |
Single-cell gene regulatory network inference analysis |
| Find out the significant the regulons (TFs) and the target genes of each regulon across cell types for different disease states |
| TF | Cell Type | Tissue | Disease Stage | Target Gene | RSS | Regulon Activity |
| ∗The dot plots of a searched regulon are shown for all cell subpopulations in each disease state of each tissue based on the regulon specific score inferred using pySCENIC and by calculating the average expression. |
| Page: 1 |
Top |
Somatic mutation of malignant transformation related genes |
| Annotation of somatic variants for genes involved in malignant transformation |
| Hugo Symbol | Variant Class | Variant Classification | dbSNP RS | HGVSc | HGVSp | HGVSp Short | SWISSPROT | BIOTYPE | SIFT | PolyPhen | Tumor Sample Barcode | Tissue | Histology | Sex | Age | Stage | Therapy Types | Drugs | Outcome |
| TECPR1 | SNV | Missense_Mutation | c.2957N>G | p.Asp986Gly | p.D986G | Q7Z6L1 | protein_coding | deleterious(0) | probably_damaging(0.964) | TCGA-BH-A18G-01 | Breast | breast invasive carcinoma | Female | >=65 | I/II | Unknown | Unknown | SD | |
| TECPR1 | SNV | Missense_Mutation | novel | c.3172C>T | p.Arg1058Cys | p.R1058C | Q7Z6L1 | protein_coding | deleterious(0) | probably_damaging(1) | TCGA-LD-A74U-01 | Breast | breast invasive carcinoma | Female | >=65 | III/IV | Chemotherapy | taxotere | SD |
| TECPR1 | insertion | Frame_Shift_Ins | novel | c.785_786insCCATGCATTGTTTGTTGCTGAAATTGTTGCCAATCTCC | p.Glu262AspfsTer87 | p.E262Dfs*87 | Q7Z6L1 | protein_coding | TCGA-A8-A07R-01 | Breast | breast invasive carcinoma | Female | >=65 | III/IV | Ancillary | zoledronic | SD | ||
| TECPR1 | insertion | Nonsense_Mutation | novel | c.460_461insTTATATTTCTTTTTATGTAACACTCTGTTCATTGTTG | p.Trp154PhefsTer7 | p.W154Ffs*7 | Q7Z6L1 | protein_coding | TCGA-AO-A0J7-01 | Breast | breast invasive carcinoma | Female | >=65 | I/II | Chemotherapy | doxorubicin | SD | ||
| TECPR1 | SNV | Missense_Mutation | novel | c.3277G>A | p.Ala1093Thr | p.A1093T | Q7Z6L1 | protein_coding | deleterious(0) | probably_damaging(1) | TCGA-2W-A8YY-01 | Cervix | cervical & endocervical cancer | Female | <65 | I/II | Chemotherapy | cisplatin | CR |
| TECPR1 | SNV | Missense_Mutation | rs761555359 | c.482G>A | p.Arg161Gln | p.R161Q | Q7Z6L1 | protein_coding | deleterious(0) | probably_damaging(0.966) | TCGA-2W-A8YY-01 | Cervix | cervical & endocervical cancer | Female | <65 | I/II | Chemotherapy | cisplatin | CR |
| TECPR1 | SNV | Missense_Mutation | rs757119005 | c.227G>A | p.Arg76His | p.R76H | Q7Z6L1 | protein_coding | deleterious(0) | probably_damaging(0.985) | TCGA-2W-A8YY-01 | Cervix | cervical & endocervical cancer | Female | <65 | I/II | Chemotherapy | cisplatin | CR |
| TECPR1 | SNV | Missense_Mutation | novel | c.275G>A | p.Arg92His | p.R92H | Q7Z6L1 | protein_coding | deleterious(0) | probably_damaging(1) | TCGA-EA-A3HS-01 | Cervix | cervical & endocervical cancer | Female | <65 | I/II | Unknown | Unknown | SD |
| TECPR1 | SNV | Missense_Mutation | c.2144C>G | p.Ser715Cys | p.S715C | Q7Z6L1 | protein_coding | tolerated(0.23) | benign(0.012) | TCGA-IR-A3LA-01 | Cervix | cervical & endocervical cancer | Female | <65 | I/II | Chemotherapy | cisplatin | CR | |
| TECPR1 | SNV | Missense_Mutation | c.1543C>G | p.Leu515Val | p.L515V | Q7Z6L1 | protein_coding | tolerated(0.61) | benign(0.036) | TCGA-IR-A3LA-01 | Cervix | cervical & endocervical cancer | Female | <65 | I/II | Chemotherapy | cisplatin | CR |
| Page: 1 2 3 4 5 6 7 8 9 10 |
Top |
Related drugs of malignant transformation related genes |
| Identification of chemicals and drugs interact with genes involved in malignant transfromation |
| (DGIdb 4.0) |
| Entrez ID | Symbol | Category | Interaction Types | Drug Claim Name | Drug Name | PMIDs |
| Page: 1 |

Copyright 2023-Present -The University of Texas Health Science Center at Houston |