
|
|||||
|
 | |
| |
| |
| |
| |
| |
|
Gene: TEAD4 |
Gene summary for TEAD4 |
| Gene information | Species | Human | Gene symbol | TEAD4 | Gene ID | 7004 |
| Gene name | TEA domain transcription factor 4 | |
| Gene Alias | EFTR-2 | |
| Cytomap | 12p13.33 | |
| Gene Type | protein-coding | GO ID | GO:0001501 | UniProtAcc | Q15561 |
Top |
Malignant transformation analysis |
| Identification of the aberrant gene expression in precancerous and cancerous lesions by comparing the gene expression of stem-like cells in diseased tissues with normal stem cells |
| Entrez ID | Symbol | Replicates | Species | Organ | Tissue | Adj P-value | Log2FC | Malignancy |
| 7004 | TEAD4 | LZE24T | Human | Esophagus | ESCC | 7.33e-09 | 1.17e-01 | 0.0596 |
| 7004 | TEAD4 | P2T-E | Human | Esophagus | ESCC | 1.97e-11 | 2.60e-01 | 0.1177 |
| 7004 | TEAD4 | P4T-E | Human | Esophagus | ESCC | 2.10e-13 | 4.18e-01 | 0.1323 |
| 7004 | TEAD4 | P5T-E | Human | Esophagus | ESCC | 2.34e-13 | 3.08e-01 | 0.1327 |
| 7004 | TEAD4 | P8T-E | Human | Esophagus | ESCC | 1.18e-06 | 1.17e-01 | 0.0889 |
| 7004 | TEAD4 | P9T-E | Human | Esophagus | ESCC | 7.36e-09 | 2.46e-01 | 0.1131 |
| 7004 | TEAD4 | P10T-E | Human | Esophagus | ESCC | 3.66e-05 | 8.56e-02 | 0.116 |
| 7004 | TEAD4 | P11T-E | Human | Esophagus | ESCC | 1.24e-03 | 1.39e-01 | 0.1426 |
| 7004 | TEAD4 | P12T-E | Human | Esophagus | ESCC | 5.39e-14 | 3.53e-01 | 0.1122 |
| 7004 | TEAD4 | P15T-E | Human | Esophagus | ESCC | 9.99e-04 | 1.40e-01 | 0.1149 |
| 7004 | TEAD4 | P16T-E | Human | Esophagus | ESCC | 1.09e-04 | 9.63e-02 | 0.1153 |
| 7004 | TEAD4 | P17T-E | Human | Esophagus | ESCC | 4.15e-08 | 2.31e-01 | 0.1278 |
| 7004 | TEAD4 | P19T-E | Human | Esophagus | ESCC | 6.36e-09 | 5.30e-01 | 0.1662 |
| 7004 | TEAD4 | P20T-E | Human | Esophagus | ESCC | 1.68e-08 | 3.27e-01 | 0.1124 |
| 7004 | TEAD4 | P21T-E | Human | Esophagus | ESCC | 1.01e-29 | 4.46e-01 | 0.1617 |
| 7004 | TEAD4 | P22T-E | Human | Esophagus | ESCC | 1.27e-14 | 3.42e-01 | 0.1236 |
| 7004 | TEAD4 | P23T-E | Human | Esophagus | ESCC | 3.30e-16 | 4.46e-01 | 0.108 |
| 7004 | TEAD4 | P24T-E | Human | Esophagus | ESCC | 5.18e-32 | 9.02e-01 | 0.1287 |
| 7004 | TEAD4 | P26T-E | Human | Esophagus | ESCC | 2.71e-13 | 2.56e-01 | 0.1276 |
| 7004 | TEAD4 | P27T-E | Human | Esophagus | ESCC | 7.28e-09 | 2.18e-01 | 0.1055 |
| Page: 1 2 3 4 |
| Tissue | Expression Dynamics | Abbreviation |
| Esophagus | 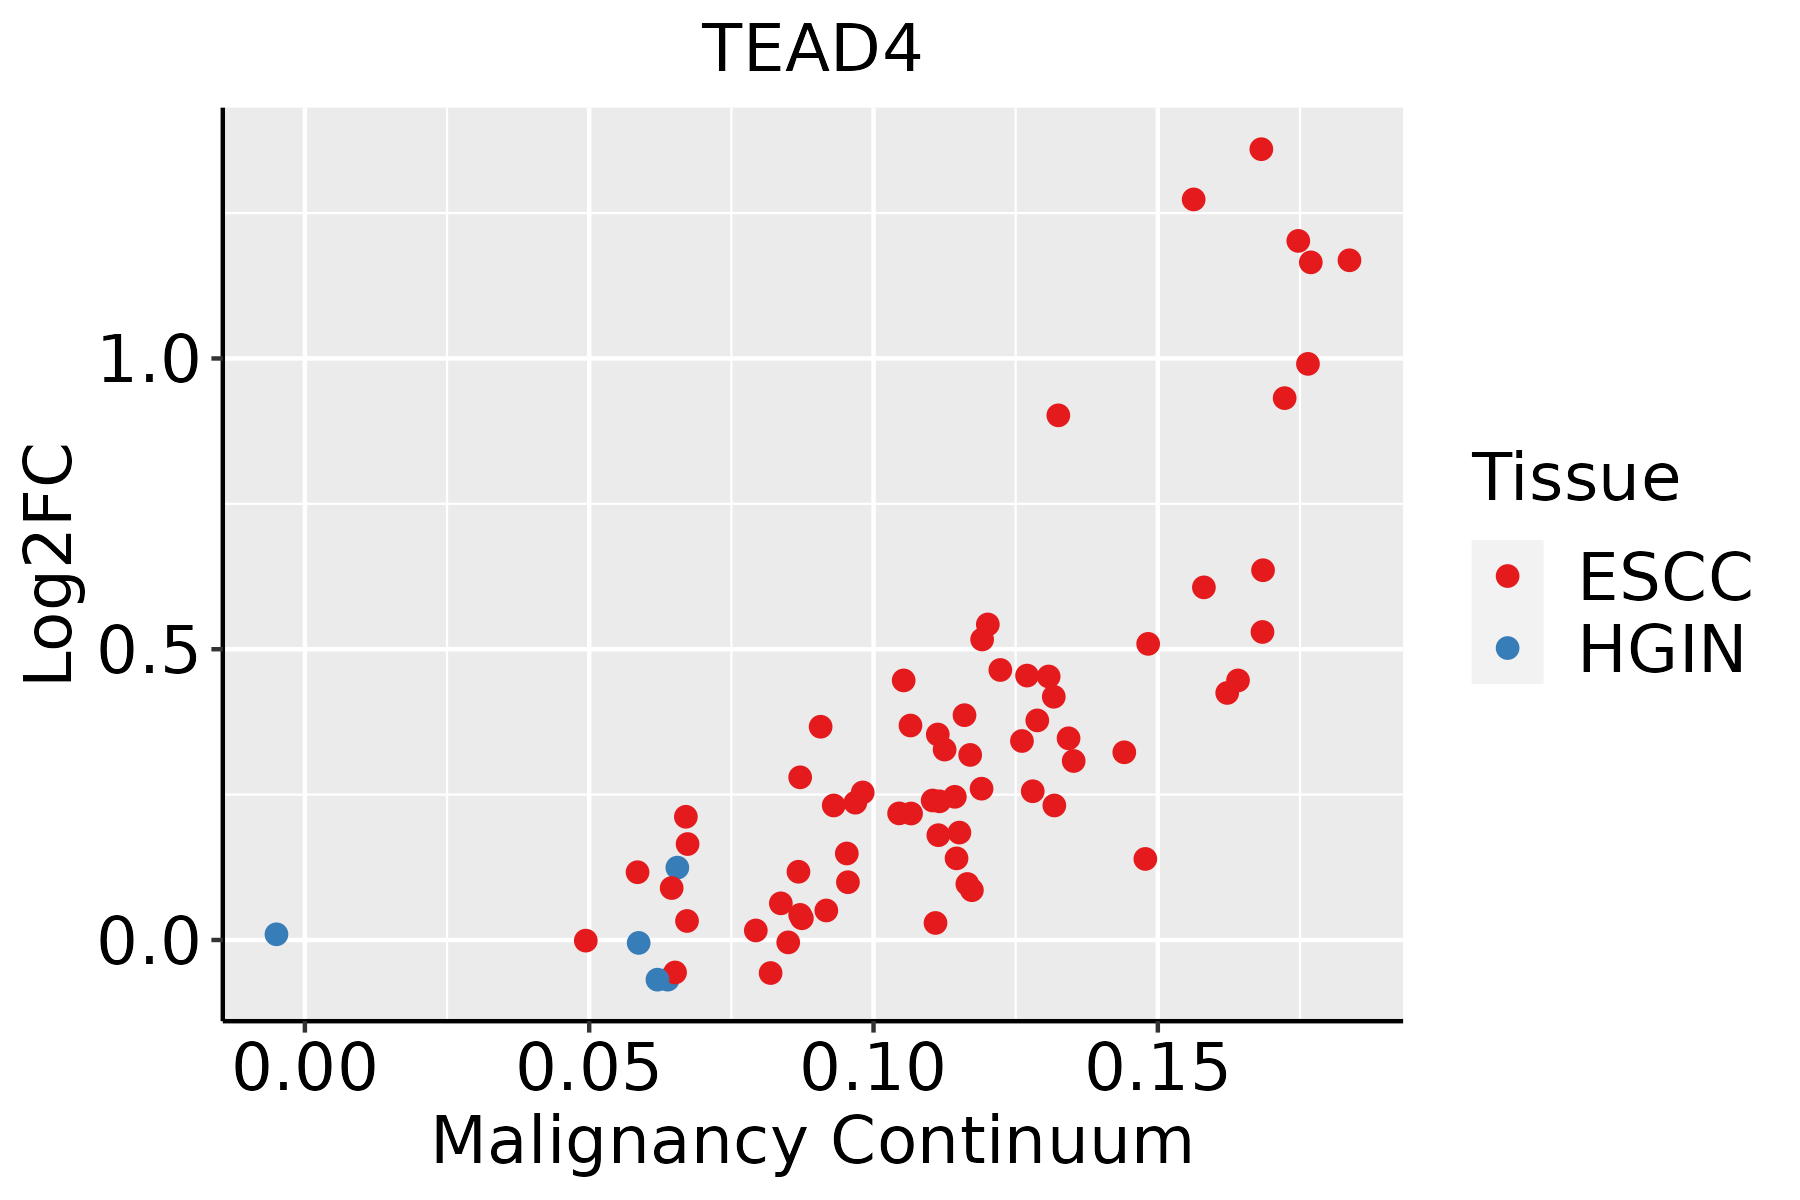 | ESCC: Esophageal squamous cell carcinoma |
| HGIN: High-grade intraepithelial neoplasias | ||
| LGIN: Low-grade intraepithelial neoplasias | ||
| Liver | 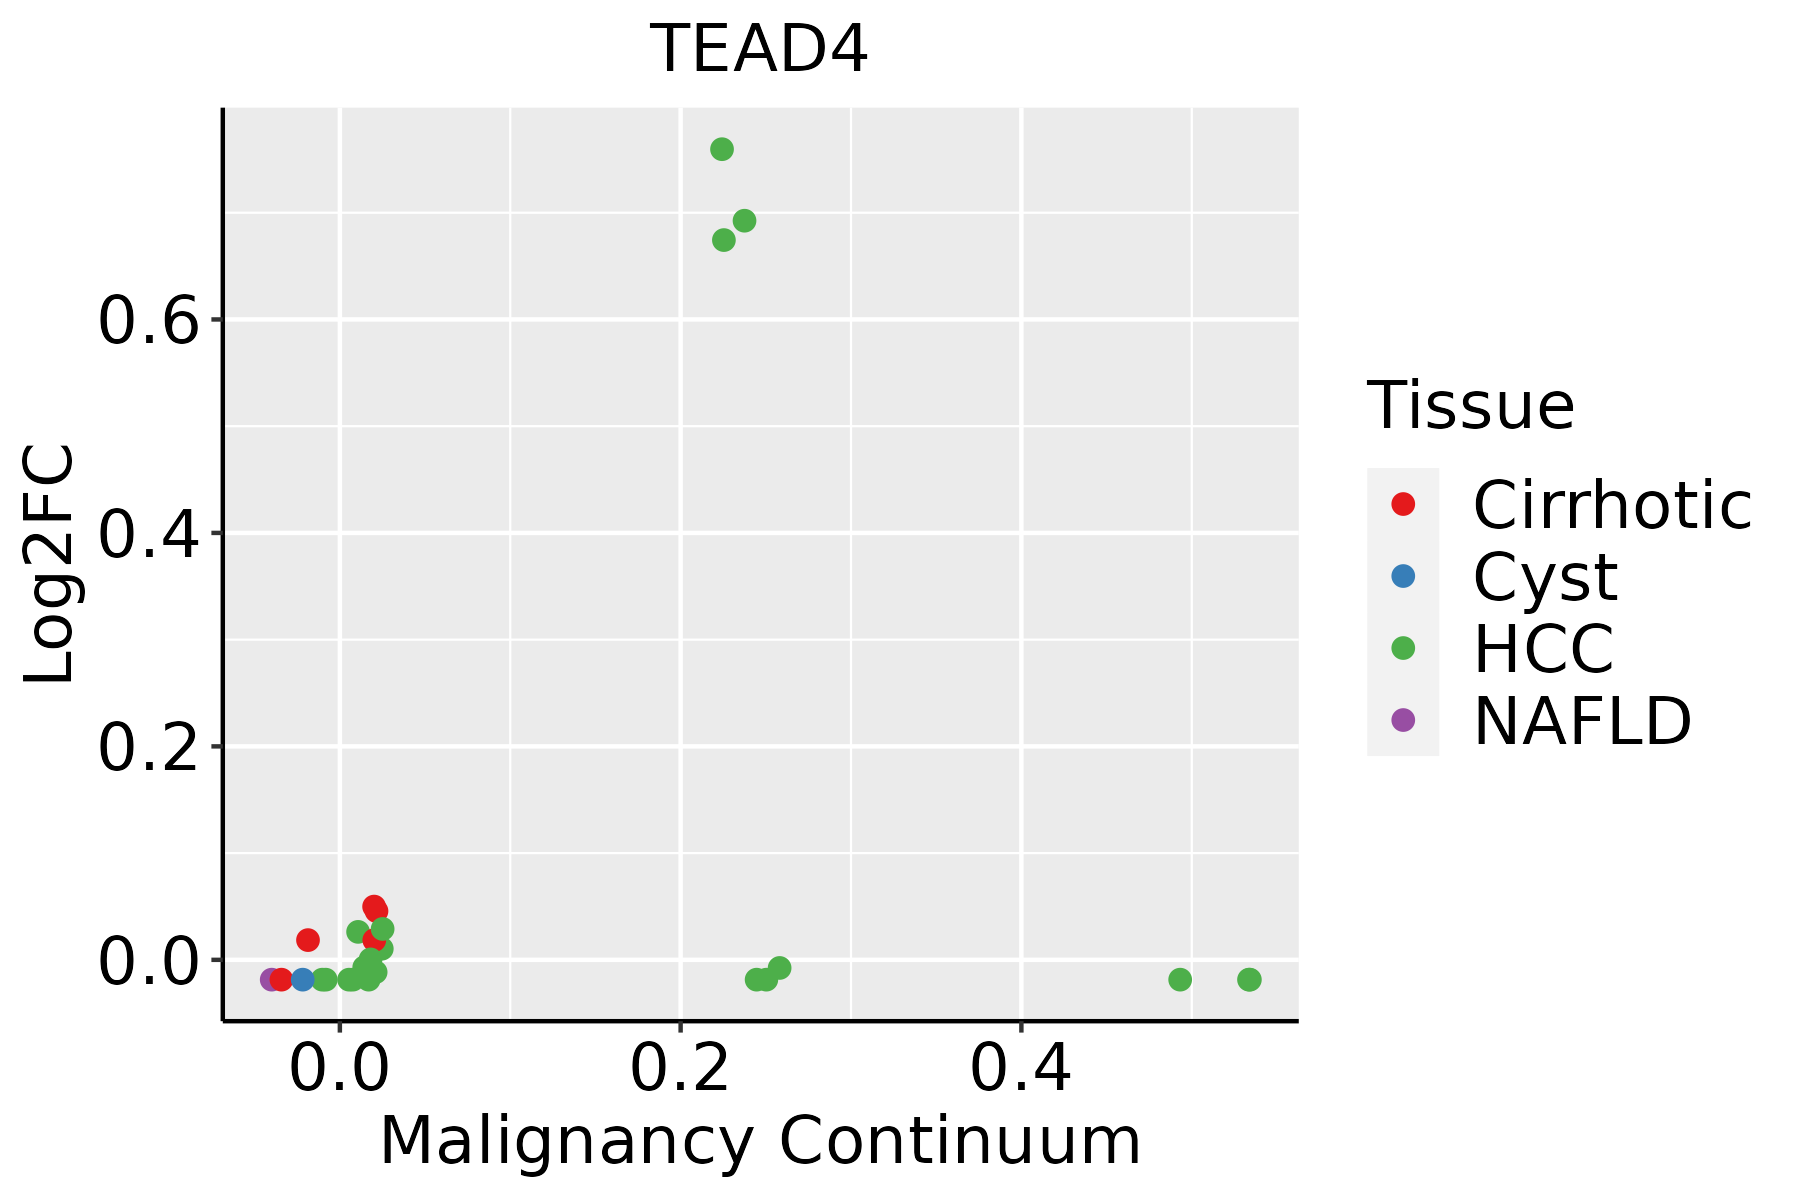 | HCC: Hepatocellular carcinoma |
| NAFLD: Non-alcoholic fatty liver disease | ||
| Oral Cavity | 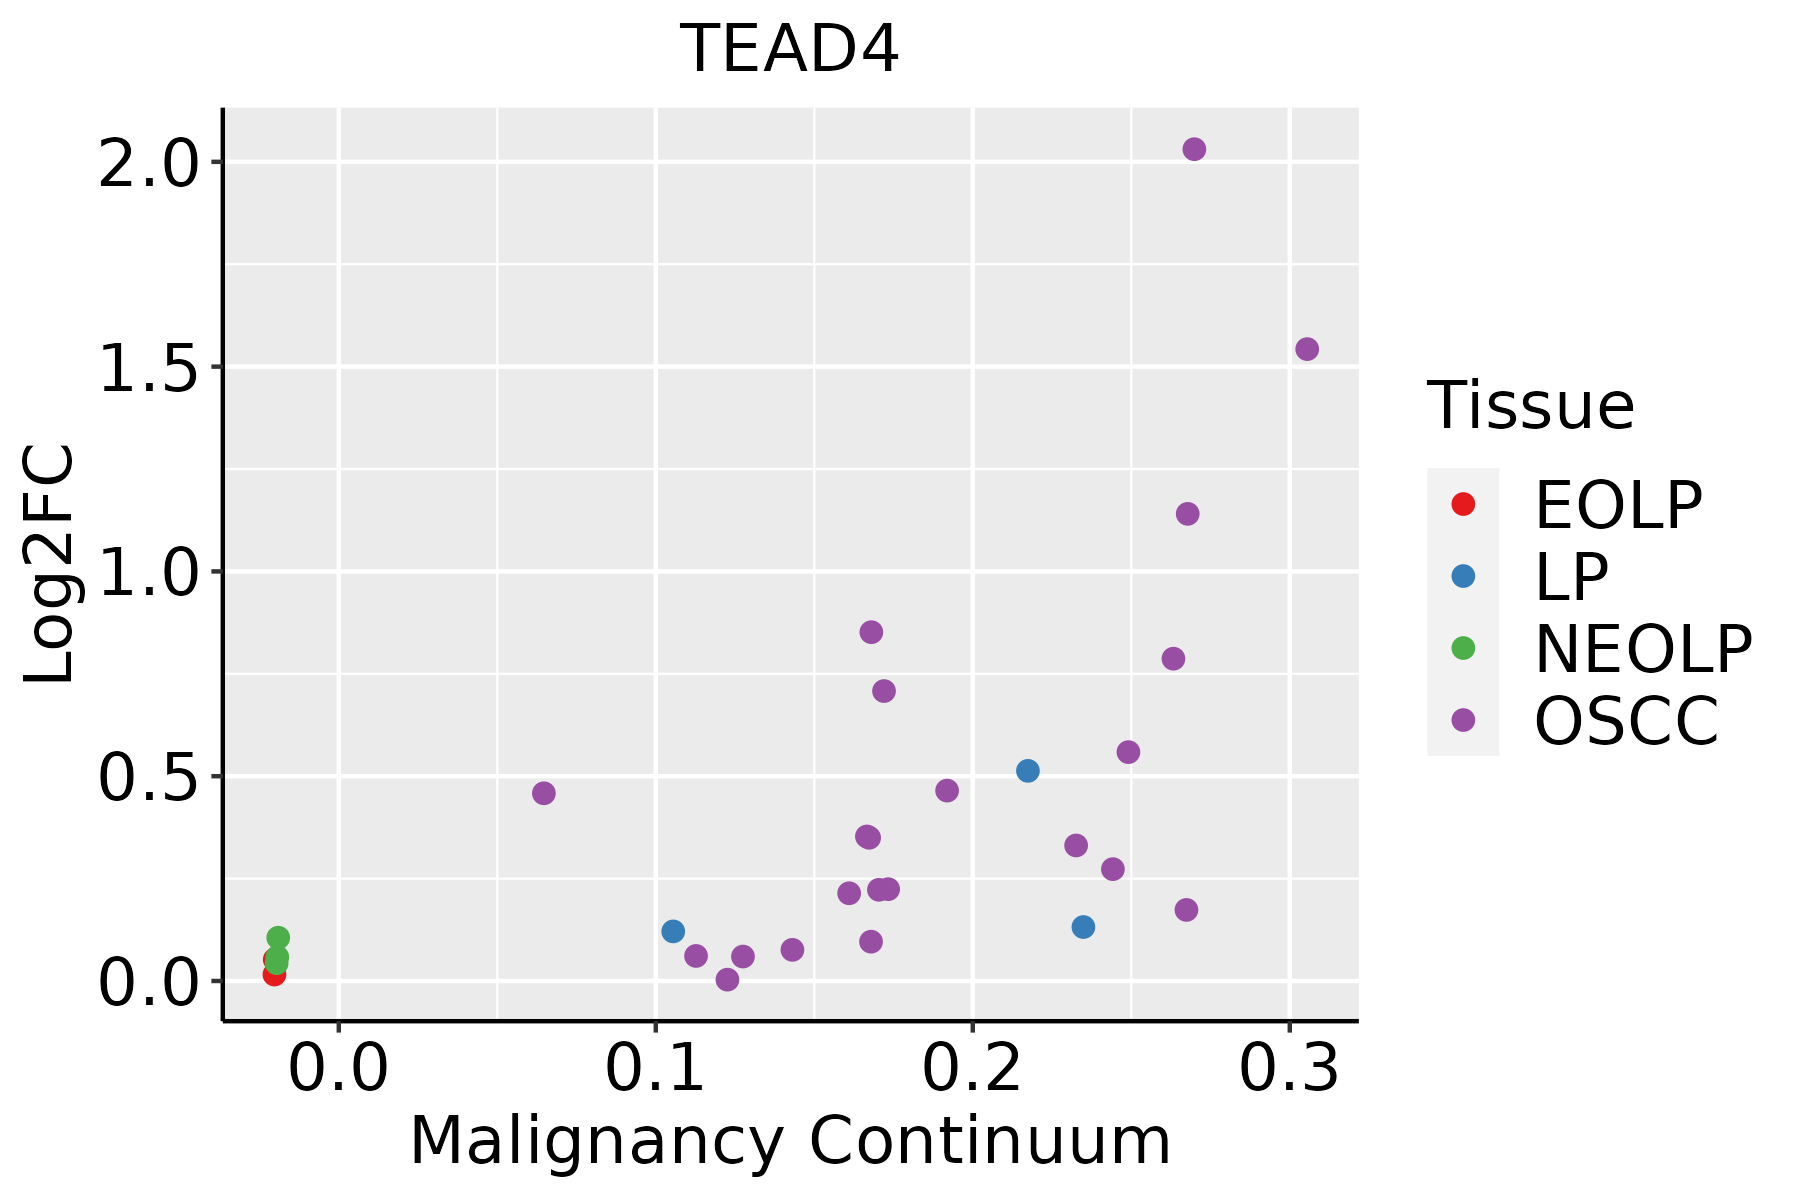 | EOLP: Erosive Oral lichen planus |
| LP: leukoplakia | ||
| NEOLP: Non-erosive oral lichen planus | ||
| OSCC: Oral squamous cell carcinoma | ||
| Skin | 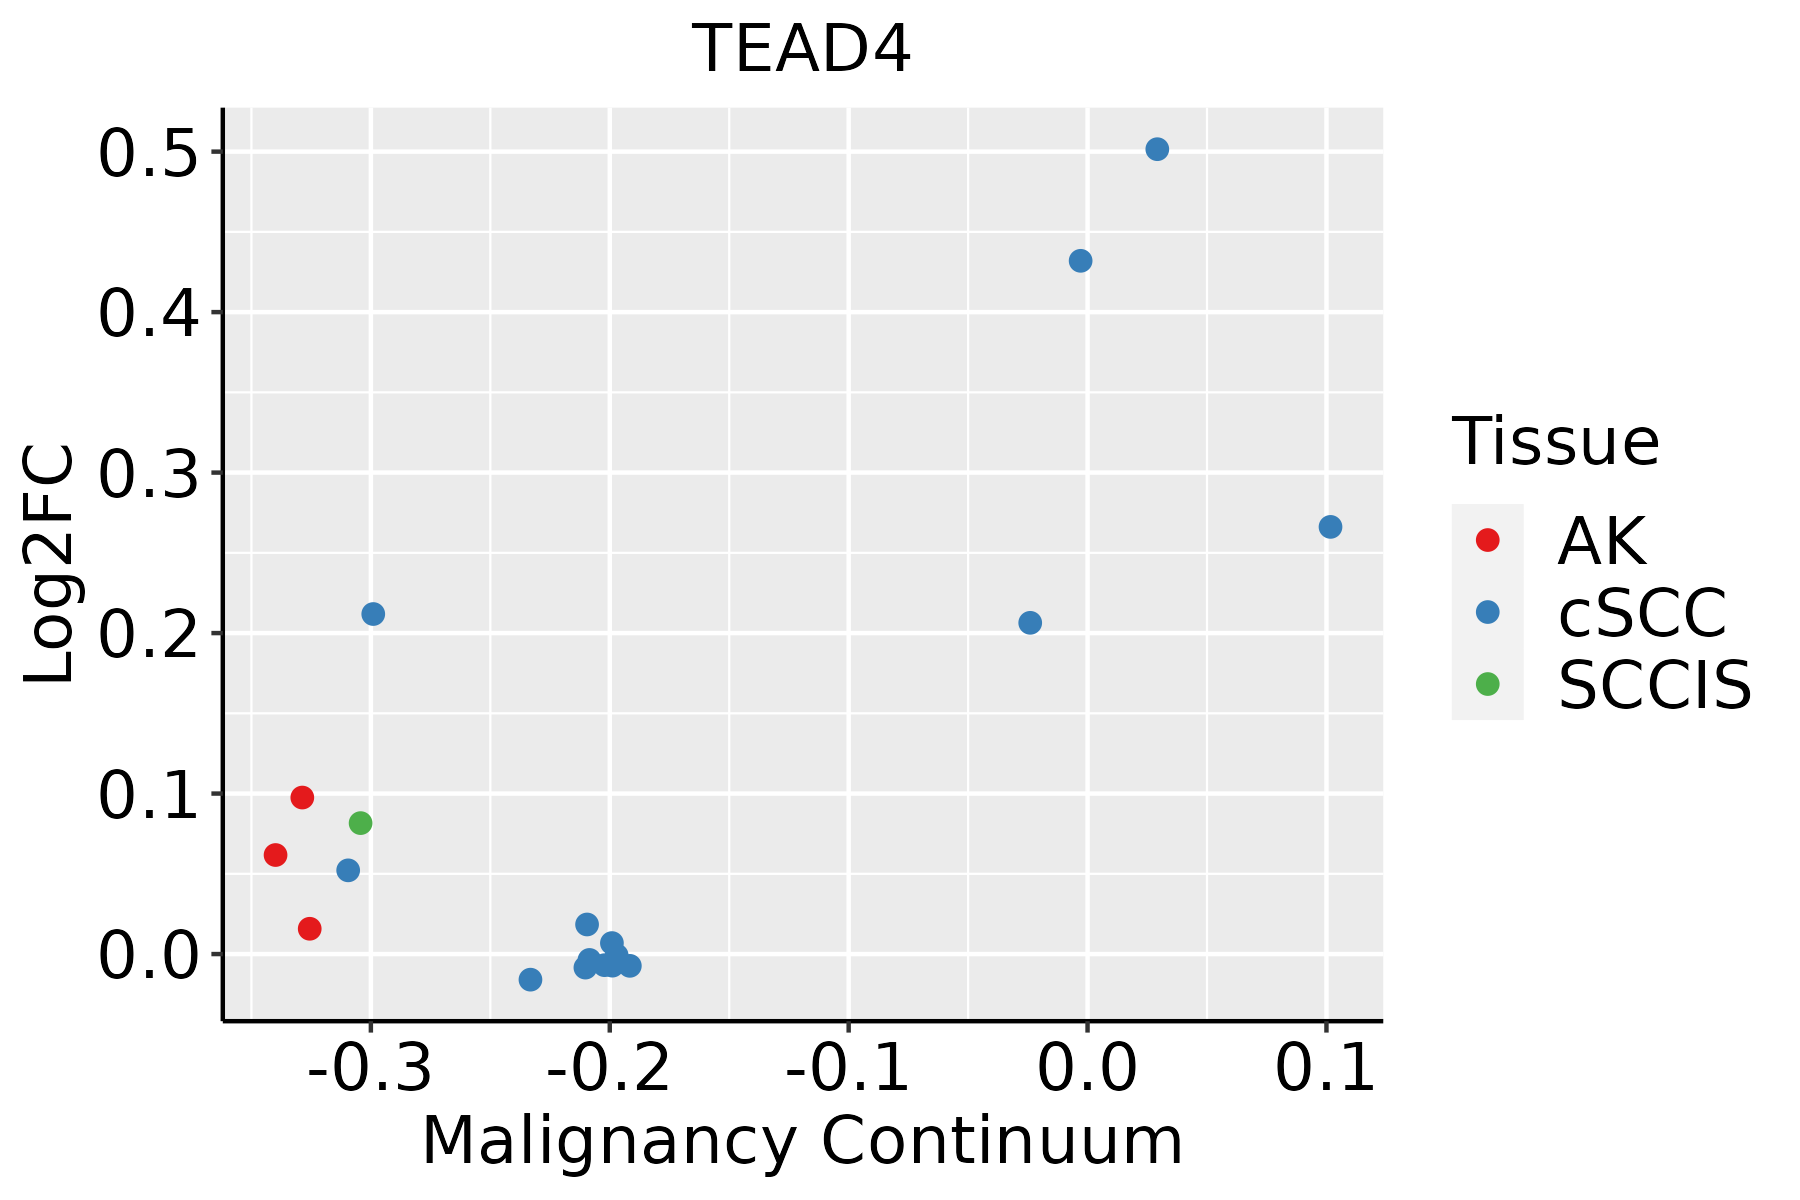 | AK: Actinic keratosis |
| cSCC: Cutaneous squamous cell carcinoma | ||
| SCCIS:squamous cell carcinoma in situ |
| ∗log2FC in expression of this searched gene in stem-like cells from each diseased tissue sample relative to stem-like cells in normal samples in each tissue plotted against the malignancy continuum. Samples are colored based on if they are from different disease stage. |
Top |
Malignant transformation related pathway analysis |
| Find out the enriched GO biological processes and KEGG pathways involved in transition from healthy to precancer to cancer |
| Tissue | Disease Stage | Enriched GO biological Processes |
| Colorectum | AD |  |
| Colorectum | SER |  |
| Colorectum | MSS |  |
| Colorectum | MSI-H |  |
| Colorectum | FAP |  |
| ∗Top 15 enriched GO BP terms are showed in the bar plot of each disease state in each tissue. Each row represents a significant GO biological process which is colored according to the -log10(p.adjust). |
| Page: 1 2 3 4 5 6 7 8 9 |
| GO ID | Tissue | Disease Stage | Description | Gene Ratio | Bg Ratio | pvalue | p.adjust | Count |
| GO:00485687 | Esophagus | ESCC | embryonic organ development | 228/8552 | 427/18723 | 7.28e-04 | 3.79e-03 | 228 |
| GO:00353297 | Esophagus | ESCC | hippo signaling | 26/8552 | 40/18723 | 1.08e-02 | 3.66e-02 | 26 |
| Page: 1 |
| Pathway ID | Tissue | Disease Stage | Description | Gene Ratio | Bg Ratio | pvalue | p.adjust | qvalue | Count |
| hsa0439018 | Esophagus | ESCC | Hippo signaling pathway | 92/4205 | 157/8465 | 1.46e-02 | 3.31e-02 | 1.69e-02 | 92 |
| hsa0439019 | Esophagus | ESCC | Hippo signaling pathway | 92/4205 | 157/8465 | 1.46e-02 | 3.31e-02 | 1.69e-02 | 92 |
| hsa0439016 | Oral cavity | OSCC | Hippo signaling pathway | 86/3704 | 157/8465 | 3.30e-03 | 8.24e-03 | 4.20e-03 | 86 |
| hsa0439017 | Oral cavity | OSCC | Hippo signaling pathway | 86/3704 | 157/8465 | 3.30e-03 | 8.24e-03 | 4.20e-03 | 86 |
| Page: 1 |
Top |
Cell-cell communication analysis |
| Identification of potential cell-cell interactions between two cell types and their ligand-receptor pairs for different disease states |
| Ligand | Receptor | LRpair | Pathway | Tissue | Disease Stage |
| Page: 1 |
Top |
Single-cell gene regulatory network inference analysis |
| Find out the significant the regulons (TFs) and the target genes of each regulon across cell types for different disease states |
| TF | Cell Type | Tissue | Disease Stage | Target Gene | RSS | Regulon Activity |
| TEAD4 | MYOEPI | Breast | Healthy | MMGT1,NAP1L5,RBBP8, etc. | 3.96e-01 |  |
| TEAD4 | GC | Cervix | CC | ACKR1,AC006160.1,LRRC14, etc. | 8.71e-02 |  |
| TEAD4 | TAC | Colorectum | Healthy | PABPC4,GGT6,DARS2, etc. | 1.20e-01 |  |
| TEAD4 | END | Colorectum | MSS | RHOJ,DNAJC18,SWT1, etc. | 4.50e-01 |  |
| TEAD4 | PFIB | Liver | Cirrhotic | COL5A3,ARHGAP23,LOXL2, etc. | 1.58e-01 |  |
| TEAD4 | AT1 | Lung | MIAC | DGKG,PLAC9,NCKAP5, etc. | 6.17e-02 |  |
| TEAD4 | ACINAR | Pancreas | ADJ | NFATC2,CTRL,SYCN, etc. | 3.22e-01 |  |
| TEAD4 | ACINAR | Pancreas | PanIN | NFATC2,CTRL,SYCN, etc. | 4.21e-01 |  |
| TEAD4 | PVA | Prostate | BPH | VPS13A,SMURF2,LIN54, etc. | 3.98e-01 |  |
| TEAD4 | MVA | Prostate | Healthy | VPS13A,SMURF2,LIN54, etc. | 4.38e-01 |  |
| ∗The dot plots of a searched regulon are shown for all cell subpopulations in each disease state of each tissue based on the regulon specific score inferred using pySCENIC and by calculating the average expression. |
| Page: 1 2 |
Top |
Somatic mutation of malignant transformation related genes |
| Annotation of somatic variants for genes involved in malignant transformation |
| Hugo Symbol | Variant Class | Variant Classification | dbSNP RS | HGVSc | HGVSp | HGVSp Short | SWISSPROT | BIOTYPE | SIFT | PolyPhen | Tumor Sample Barcode | Tissue | Histology | Sex | Age | Stage | Therapy Types | Drugs | Outcome |
| TEAD4 | SNV | Missense_Mutation | novel | c.604N>T | p.Pro202Ser | p.P202S | protein_coding | tolerated(0.36) | benign(0.005) | TCGA-A1-A0SO-01 | Breast | breast invasive carcinoma | Female | >=65 | I/II | Chemotherapy | SD | ||
| TEAD4 | SNV | Missense_Mutation | c.791N>T | p.Ala264Val | p.A264V | protein_coding | deleterious(0.04) | benign(0.021) | TCGA-A8-A09Z-01 | Breast | breast invasive carcinoma | Female | >=65 | I/II | Unknown | Unknown | SD | ||
| TEAD4 | SNV | Missense_Mutation | rs777338239 | c.92N>G | p.Leu31Arg | p.L31R | protein_coding | tolerated(0.53) | possibly_damaging(0.454) | TCGA-C8-A133-01 | Breast | breast invasive carcinoma | Female | >=65 | III/IV | Unknown | Unknown | SD | |
| TEAD4 | SNV | Missense_Mutation | c.978N>C | p.Met326Ile | p.M326I | protein_coding | tolerated(0.06) | benign(0.176) | TCGA-GM-A2D9-01 | Breast | breast invasive carcinoma | Female | >=65 | I/II | Hormone Therapy | arimidex | SD | ||
| TEAD4 | SNV | Missense_Mutation | novel | c.816N>G | p.Asp272Glu | p.D272E | protein_coding | tolerated(0.11) | possibly_damaging(0.622) | TCGA-OL-A5RW-01 | Breast | breast invasive carcinoma | Female | <65 | I/II | Chemotherapy | adriamycin | CR | |
| TEAD4 | insertion | Frame_Shift_Ins | novel | c.490_491insCACAGAATCCTCACCCCACAAATCCGCTTAGGATGGGCAG | p.Gln164ProfsTer26 | p.Q164Pfs*26 | protein_coding | TCGA-A2-A0CU-01 | Breast | breast invasive carcinoma | Female | >=65 | I/II | Hormone Therapy | tamoxiphen | SD | |||
| TEAD4 | insertion | Frame_Shift_Ins | novel | c.463_464insTAATTAATAAAATGACAGATAATGTCTCTGTAAGCTCT | p.Gly155ValfsTer36 | p.G155Vfs*36 | protein_coding | TCGA-AN-A0FX-01 | Breast | breast invasive carcinoma | Female | <65 | I/II | Unknown | Unknown | SD | |||
| TEAD4 | SNV | Missense_Mutation | rs376160263 | c.106N>A | p.Asp36Asn | p.D36N | protein_coding | tolerated(0.08) | benign(0.144) | TCGA-2W-A8YY-01 | Cervix | cervical & endocervical cancer | Female | <65 | I/II | Chemotherapy | cisplatin | CR | |
| TEAD4 | SNV | Missense_Mutation | c.227N>T | p.Gly76Val | p.G76V | protein_coding | deleterious(0) | probably_damaging(0.998) | TCGA-LP-A4AV-01 | Cervix | cervical & endocervical cancer | Female | <65 | I/II | Unknown | Unknown | SD | ||
| TEAD4 | SNV | Missense_Mutation | c.733C>T | p.His245Tyr | p.H245Y | protein_coding | deleterious(0) | probably_damaging(0.993) | TCGA-AA-3672-01 | Colorectum | colon adenocarcinoma | Female | >=65 | III/IV | Unknown | Unknown | SD |
| Page: 1 2 3 4 5 6 |
Top |
Related drugs of malignant transformation related genes |
| Identification of chemicals and drugs interact with genes involved in malignant transfromation |
| (DGIdb 4.0) |
| Entrez ID | Symbol | Category | Interaction Types | Drug Claim Name | Drug Name | PMIDs |
| Page: 1 |

Copyright 2023-Present -The University of Texas Health Science Center at Houston |