
|
|||||
|
 | |
| |
| |
| |
| |
| |
|
Gene: TEAD3 |
Gene summary for TEAD3 |
| Gene information | Species | Human | Gene symbol | TEAD3 | Gene ID | 7005 |
| Gene name | TEA domain transcription factor 3 | |
| Gene Alias | DTEF-1 | |
| Cytomap | 6p21.31 | |
| Gene Type | protein-coding | GO ID | GO:0000003 | UniProtAcc | Q99594 |
Top |
Malignant transformation analysis |
| Identification of the aberrant gene expression in precancerous and cancerous lesions by comparing the gene expression of stem-like cells in diseased tissues with normal stem cells |
| Entrez ID | Symbol | Replicates | Species | Organ | Tissue | Adj P-value | Log2FC | Malignancy |
| 7005 | TEAD3 | LZE4T | Human | Esophagus | ESCC | 5.78e-05 | 5.84e-02 | 0.0811 |
| 7005 | TEAD3 | LZE20T | Human | Esophagus | ESCC | 2.69e-03 | 1.98e-01 | 0.0662 |
| 7005 | TEAD3 | LZE22T | Human | Esophagus | ESCC | 3.17e-03 | 1.58e-01 | 0.068 |
| 7005 | TEAD3 | LZE24T | Human | Esophagus | ESCC | 4.42e-10 | 3.74e-01 | 0.0596 |
| 7005 | TEAD3 | P1T-E | Human | Esophagus | ESCC | 7.02e-09 | 5.76e-01 | 0.0875 |
| 7005 | TEAD3 | P2T-E | Human | Esophagus | ESCC | 4.52e-25 | 4.16e-01 | 0.1177 |
| 7005 | TEAD3 | P4T-E | Human | Esophagus | ESCC | 8.18e-12 | 2.46e-01 | 0.1323 |
| 7005 | TEAD3 | P5T-E | Human | Esophagus | ESCC | 1.07e-08 | 3.96e-02 | 0.1327 |
| 7005 | TEAD3 | P8T-E | Human | Esophagus | ESCC | 2.62e-22 | 3.99e-01 | 0.0889 |
| 7005 | TEAD3 | P9T-E | Human | Esophagus | ESCC | 9.41e-11 | 1.59e-01 | 0.1131 |
| 7005 | TEAD3 | P10T-E | Human | Esophagus | ESCC | 6.74e-15 | 1.64e-01 | 0.116 |
| 7005 | TEAD3 | P11T-E | Human | Esophagus | ESCC | 3.15e-12 | 3.72e-01 | 0.1426 |
| 7005 | TEAD3 | P12T-E | Human | Esophagus | ESCC | 6.55e-23 | 4.61e-01 | 0.1122 |
| 7005 | TEAD3 | P15T-E | Human | Esophagus | ESCC | 1.02e-14 | 2.17e-01 | 0.1149 |
| 7005 | TEAD3 | P16T-E | Human | Esophagus | ESCC | 5.05e-14 | 3.12e-01 | 0.1153 |
| 7005 | TEAD3 | P17T-E | Human | Esophagus | ESCC | 5.47e-07 | 4.02e-01 | 0.1278 |
| 7005 | TEAD3 | P19T-E | Human | Esophagus | ESCC | 1.76e-07 | 3.41e-01 | 0.1662 |
| 7005 | TEAD3 | P20T-E | Human | Esophagus | ESCC | 2.71e-08 | 1.51e-01 | 0.1124 |
| 7005 | TEAD3 | P21T-E | Human | Esophagus | ESCC | 8.70e-15 | 2.47e-01 | 0.1617 |
| 7005 | TEAD3 | P22T-E | Human | Esophagus | ESCC | 7.85e-22 | 1.71e-01 | 0.1236 |
| Page: 1 2 3 4 5 |
| Tissue | Expression Dynamics | Abbreviation |
| Esophagus | 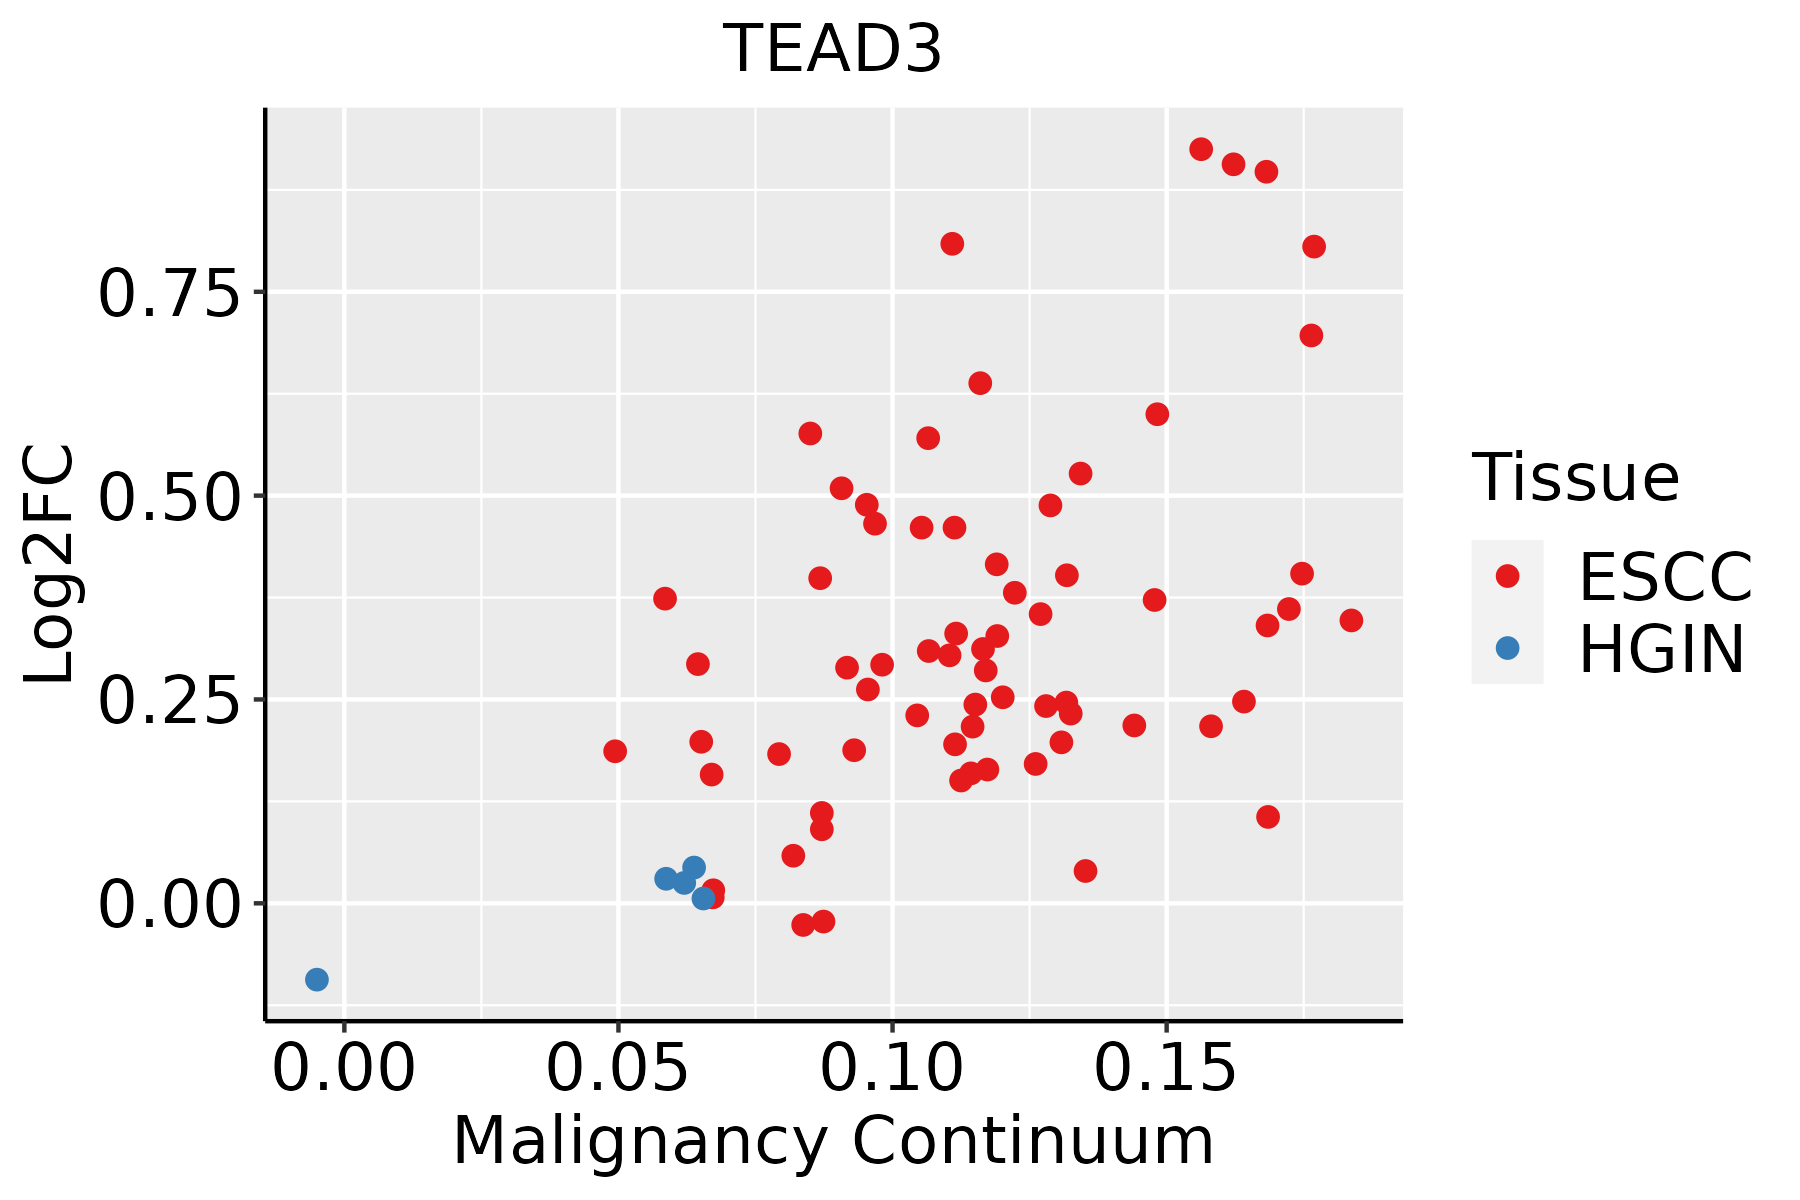 | ESCC: Esophageal squamous cell carcinoma |
| HGIN: High-grade intraepithelial neoplasias | ||
| LGIN: Low-grade intraepithelial neoplasias | ||
| Oral Cavity | 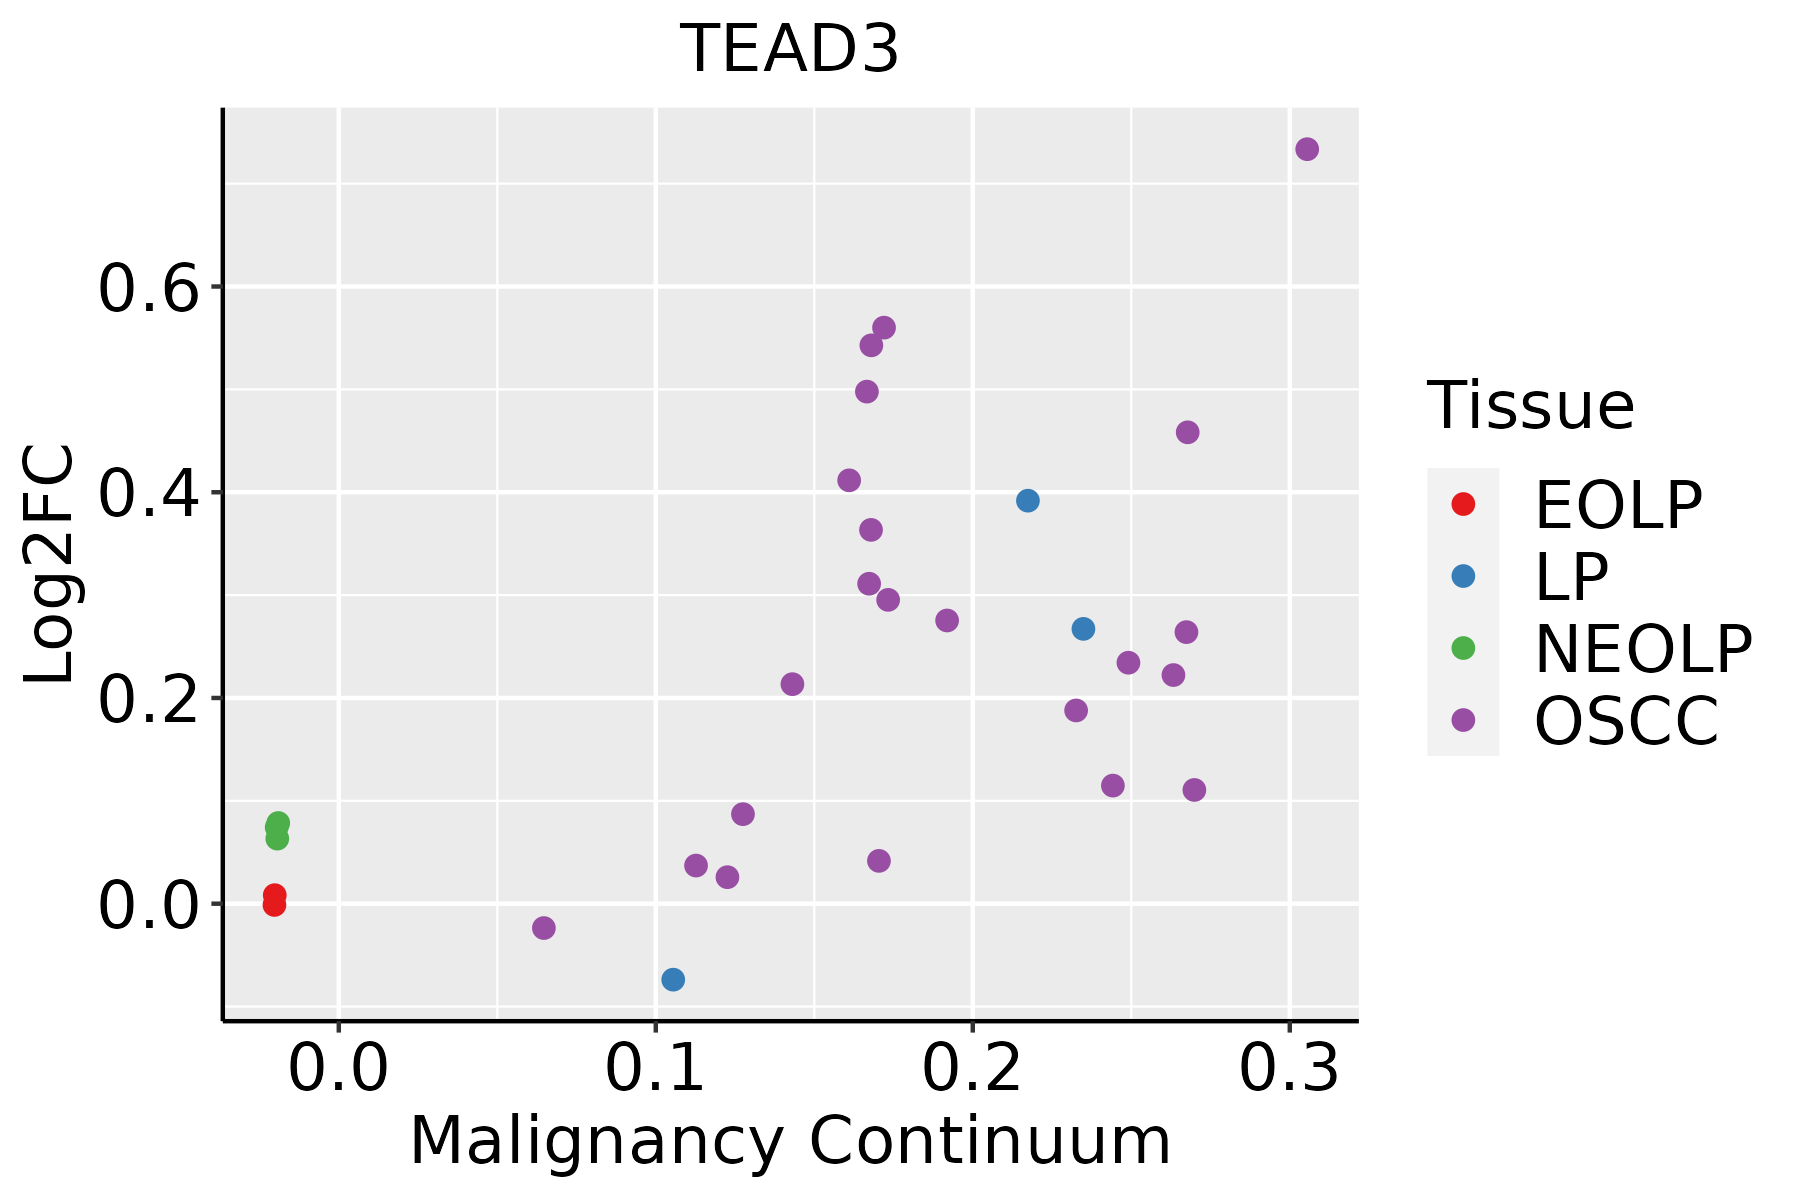 | EOLP: Erosive Oral lichen planus |
| LP: leukoplakia | ||
| NEOLP: Non-erosive oral lichen planus | ||
| OSCC: Oral squamous cell carcinoma | ||
| Thyroid | 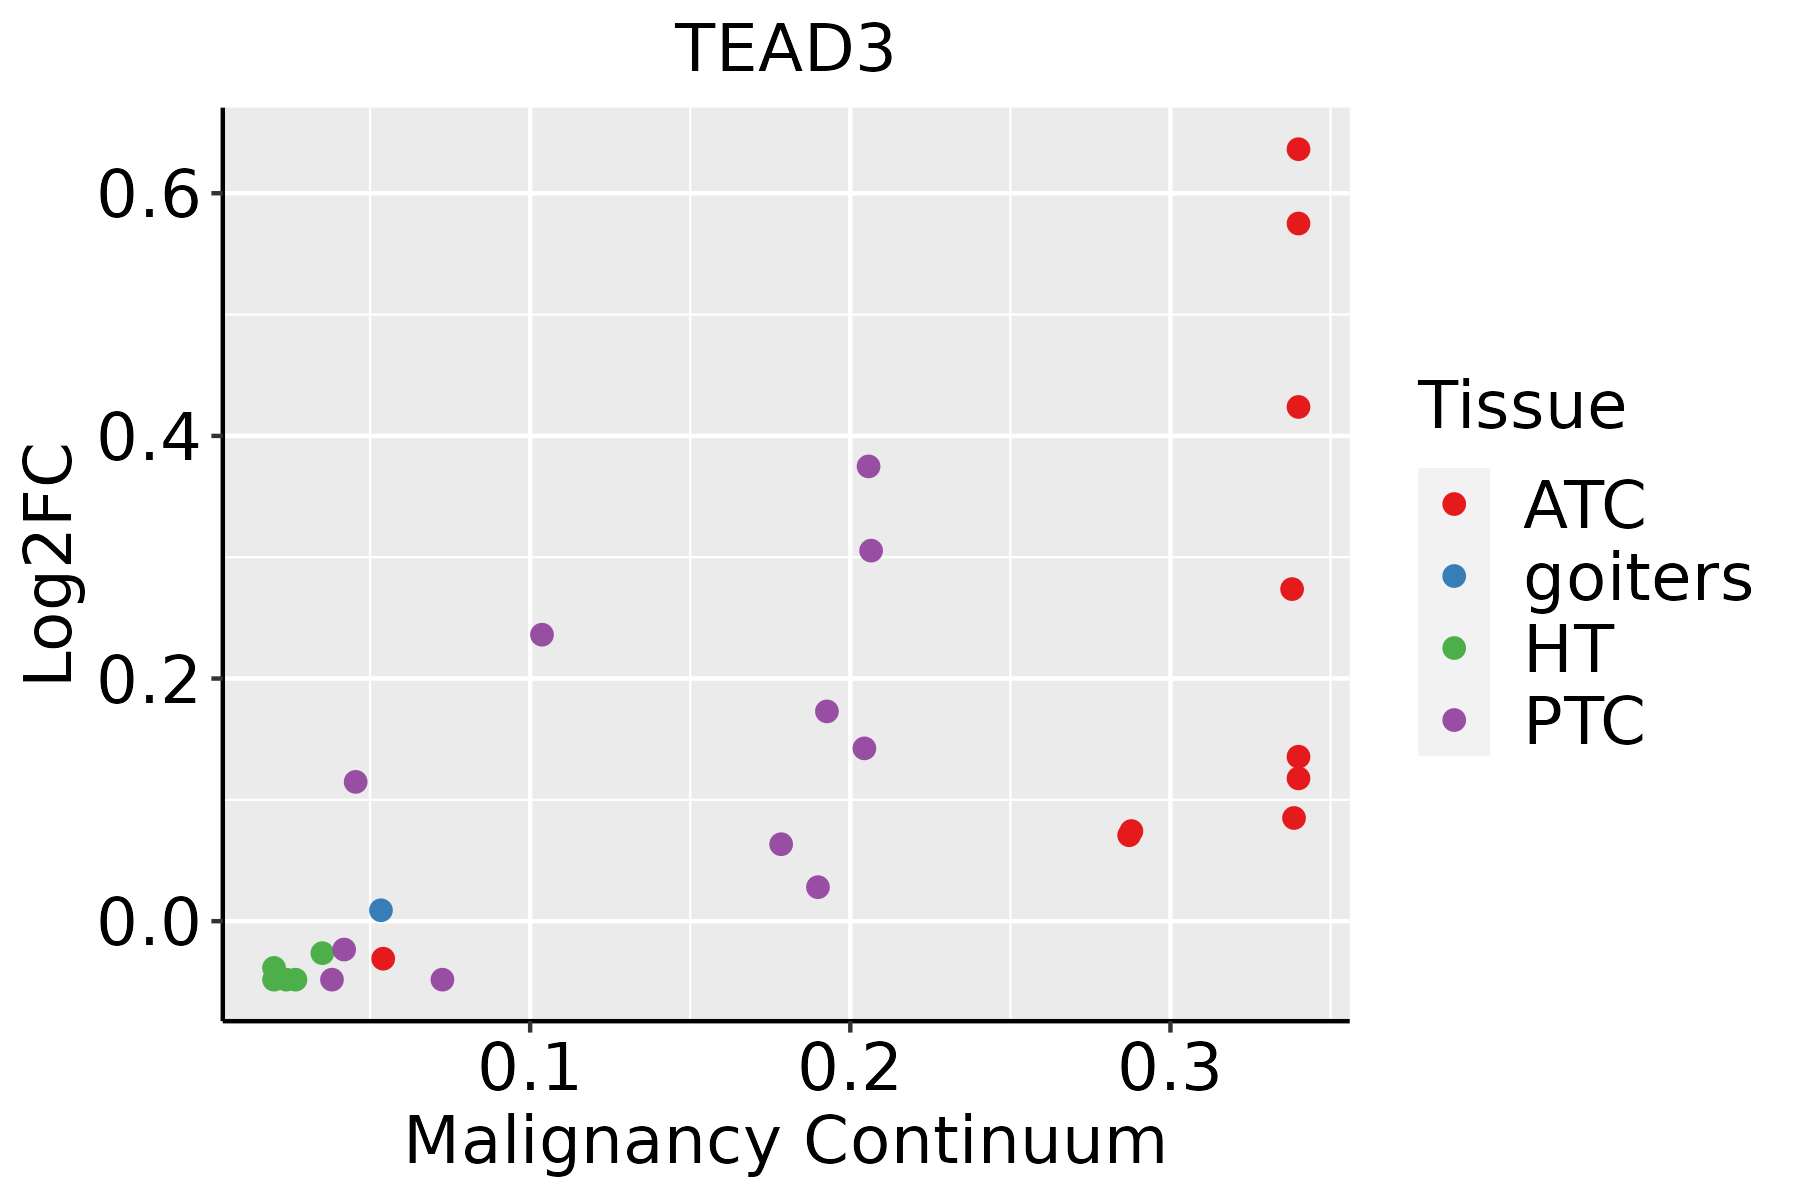 | ATC: Anaplastic thyroid cancer |
| HT: Hashimoto's thyroiditis | ||
| PTC: Papillary thyroid cancer |
| ∗log2FC in expression of this searched gene in stem-like cells from each diseased tissue sample relative to stem-like cells in normal samples in each tissue plotted against the malignancy continuum. Samples are colored based on if they are from different disease stage. |
Top |
Malignant transformation related pathway analysis |
| Find out the enriched GO biological processes and KEGG pathways involved in transition from healthy to precancer to cancer |
| Tissue | Disease Stage | Enriched GO biological Processes |
| Colorectum | AD |  |
| Colorectum | SER |  |
| Colorectum | MSS |  |
| Colorectum | MSI-H |  |
| Colorectum | FAP |  |
| ∗Top 15 enriched GO BP terms are showed in the bar plot of each disease state in each tissue. Each row represents a significant GO biological process which is colored according to the -log10(p.adjust). |
| Page: 1 2 3 4 5 6 7 8 9 |
| GO ID | Tissue | Disease Stage | Description | Gene Ratio | Bg Ratio | pvalue | p.adjust | Count |
| GO:00485687 | Esophagus | ESCC | embryonic organ development | 228/8552 | 427/18723 | 7.28e-04 | 3.79e-03 | 228 |
| GO:00353297 | Esophagus | ESCC | hippo signaling | 26/8552 | 40/18723 | 1.08e-02 | 3.66e-02 | 26 |
| GO:0008356 | Esophagus | ESCC | asymmetric cell division | 14/8552 | 19/18723 | 1.27e-02 | 4.21e-02 | 14 |
| GO:00075657 | Oral cavity | OSCC | female pregnancy | 98/7305 | 193/18723 | 5.66e-04 | 3.27e-03 | 98 |
| GO:00447067 | Oral cavity | OSCC | multi-multicellular organism process | 105/7305 | 220/18723 | 5.05e-03 | 1.97e-02 | 105 |
| GO:003532912 | Thyroid | PTC | hippo signaling | 24/5968 | 40/18723 | 2.27e-04 | 1.65e-03 | 24 |
| GO:003532921 | Thyroid | ATC | hippo signaling | 24/6293 | 40/18723 | 5.54e-04 | 3.20e-03 | 24 |
| GO:00485688 | Thyroid | ATC | embryonic organ development | 172/6293 | 427/18723 | 2.08e-03 | 9.84e-03 | 172 |
| GO:000756517 | Thyroid | ATC | female pregnancy | 82/6293 | 193/18723 | 6.04e-03 | 2.42e-02 | 82 |
| GO:00083561 | Thyroid | ATC | asymmetric cell division | 12/6293 | 19/18723 | 7.97e-03 | 3.08e-02 | 12 |
| Page: 1 |
| Pathway ID | Tissue | Disease Stage | Description | Gene Ratio | Bg Ratio | pvalue | p.adjust | qvalue | Count |
| hsa0439018 | Esophagus | ESCC | Hippo signaling pathway | 92/4205 | 157/8465 | 1.46e-02 | 3.31e-02 | 1.69e-02 | 92 |
| hsa0439019 | Esophagus | ESCC | Hippo signaling pathway | 92/4205 | 157/8465 | 1.46e-02 | 3.31e-02 | 1.69e-02 | 92 |
| hsa0439016 | Oral cavity | OSCC | Hippo signaling pathway | 86/3704 | 157/8465 | 3.30e-03 | 8.24e-03 | 4.20e-03 | 86 |
| hsa0439017 | Oral cavity | OSCC | Hippo signaling pathway | 86/3704 | 157/8465 | 3.30e-03 | 8.24e-03 | 4.20e-03 | 86 |
| Page: 1 |
Top |
Cell-cell communication analysis |
| Identification of potential cell-cell interactions between two cell types and their ligand-receptor pairs for different disease states |
| Ligand | Receptor | LRpair | Pathway | Tissue | Disease Stage |
| Page: 1 |
Top |
Single-cell gene regulatory network inference analysis |
| Find out the significant the regulons (TFs) and the target genes of each regulon across cell types for different disease states |
| TF | Cell Type | Tissue | Disease Stage | Target Gene | RSS | Regulon Activity |
| TEAD3 | STM | Breast | DCIS | TMEM61,MBNL1-AS1,SQLE, etc. | 2.24e-01 |  |
| TEAD3 | PERI | Breast | DCIS | GRP,EPHX2,ASS1, etc. | 7.54e-02 | |
| TEAD3 | PERI | Breast | IDC | GRP,EPHX2,ASS1, etc. | 2.57e-01 |  |
| TEAD3 | BN | Cervix | ADJ | LUM,SCGB2A2,KHDC1, etc. | 1.30e-02 |  |
| TEAD3 | CD8TEREX | Cervix | ADJ | LUM,SCGB2A2,KHDC1, etc. | 0.00e+00 | |
| TEAD3 | NK | Cervix | ADJ | LUM,SCGB2A2,KHDC1, etc. | 4.33e-02 | |
| TEAD3 | GC | Cervix | ADJ | LUM,SCGB2A2,KHDC1, etc. | 2.22e-16 | |
| TEAD3 | PLA | Cervix | ADJ | LUM,SCGB2A2,KHDC1, etc. | 2.22e-16 | |
| TEAD3 | DC | Cervix | CC | LUM,SCGB2A2,KHDC1, etc. | 1.84e-01 |  |
| TEAD3 | BMEM | Cervix | CC | LUM,SCGB2A2,KHDC1, etc. | 6.58e-02 | |
| ∗The dot plots of a searched regulon are shown for all cell subpopulations in each disease state of each tissue based on the regulon specific score inferred using pySCENIC and by calculating the average expression. |
| Page: 1 2 3 4 |
Top |
Somatic mutation of malignant transformation related genes |
| Annotation of somatic variants for genes involved in malignant transformation |
| Hugo Symbol | Variant Class | Variant Classification | dbSNP RS | HGVSc | HGVSp | HGVSp Short | SWISSPROT | BIOTYPE | SIFT | PolyPhen | Tumor Sample Barcode | Tissue | Histology | Sex | Age | Stage | Therapy Types | Drugs | Outcome |
| TEAD3 | SNV | Missense_Mutation | novel | c.430N>G | p.Phe144Val | p.F144V | Q99594 | protein_coding | tolerated(0.11) | benign(0) | TCGA-A2-A0CU-01 | Breast | breast invasive carcinoma | Female | >=65 | I/II | Hormone Therapy | tamoxiphen | SD |
| TEAD3 | SNV | Missense_Mutation | rs773682085 | c.1297N>A | p.Val433Ile | p.V433I | Q99594 | protein_coding | tolerated(0.2) | benign(0) | TCGA-AC-A62X-01 | Breast | breast invasive carcinoma | Female | >=65 | I/II | Unknown | Unknown | SD |
| TEAD3 | SNV | Missense_Mutation | c.502C>G | p.Leu168Val | p.L168V | Q99594 | protein_coding | tolerated(0.31) | benign(0.017) | TCGA-B6-A0RS-01 | Breast | breast invasive carcinoma | Female | <65 | I/II | Unknown | Unknown | PD | |
| TEAD3 | insertion | Frame_Shift_Ins | novel | c.431_432insAGGGAAGAGGGAACCC | p.Phe144LeufsTer62 | p.F144Lfs*62 | Q99594 | protein_coding | TCGA-A2-A0CU-01 | Breast | breast invasive carcinoma | Female | >=65 | I/II | Hormone Therapy | tamoxiphen | SD | ||
| TEAD3 | SNV | Missense_Mutation | c.332C>T | p.Ala111Val | p.A111V | Q99594 | protein_coding | tolerated(0.65) | possibly_damaging(0.787) | TCGA-2W-A8YY-01 | Cervix | cervical & endocervical cancer | Female | <65 | I/II | Chemotherapy | cisplatin | CR | |
| TEAD3 | SNV | Missense_Mutation | rs761773922 | c.1066N>A | p.Gly356Arg | p.G356R | Q99594 | protein_coding | deleterious(0) | possibly_damaging(0.836) | TCGA-MA-AA42-01 | Cervix | cervical & endocervical cancer | Female | >=65 | I/II | Unknown | Unknown | SD |
| TEAD3 | SNV | Missense_Mutation | rs758902471 | c.1270N>A | p.Gly424Arg | p.G424R | Q99594 | protein_coding | deleterious(0) | probably_damaging(0.999) | TCGA-VS-A8QA-01 | Cervix | cervical & endocervical cancer | Female | <65 | I/II | Unknown | Unknown | SD |
| TEAD3 | SNV | Missense_Mutation | c.478N>T | p.Arg160Trp | p.R160W | Q99594 | protein_coding | deleterious(0.02) | benign(0.005) | TCGA-A6-6654-01 | Colorectum | colon adenocarcinoma | Female | >=65 | III/IV | Chemotherapy | oxaliplatin | SD | |
| TEAD3 | SNV | Missense_Mutation | c.307N>T | p.Arg103Trp | p.R103W | Q99594 | protein_coding | deleterious(0) | probably_damaging(0.98) | TCGA-AA-3663-01 | Colorectum | colon adenocarcinoma | Male | <65 | I/II | Unknown | Unknown | SD | |
| TEAD3 | SNV | Missense_Mutation | c.134N>T | p.Glu45Val | p.E45V | Q99594 | protein_coding | deleterious(0) | probably_damaging(0.995) | TCGA-AA-3966-01 | Colorectum | colon adenocarcinoma | Female | >=65 | I/II | Unknown | Unknown | SD |
| Page: 1 2 3 4 |
Top |
Related drugs of malignant transformation related genes |
| Identification of chemicals and drugs interact with genes involved in malignant transfromation |
| (DGIdb 4.0) |
| Entrez ID | Symbol | Category | Interaction Types | Drug Claim Name | Drug Name | PMIDs |
| Page: 1 |

Copyright 2023-Present -The University of Texas Health Science Center at Houston |