
|
|||||
|
 | |
| |
| |
| |
| |
| |
|
Gene: TEAD2 |
Gene summary for TEAD2 |
| Gene information | Species | Human | Gene symbol | TEAD2 | Gene ID | 8463 |
| Gene name | TEA domain transcription factor 2 | |
| Gene Alias | ETF | |
| Cytomap | 19q13.33 | |
| Gene Type | protein-coding | GO ID | GO:0001568 | UniProtAcc | A0A024QZE2 |
Top |
Malignant transformation analysis |
| Identification of the aberrant gene expression in precancerous and cancerous lesions by comparing the gene expression of stem-like cells in diseased tissues with normal stem cells |
| Entrez ID | Symbol | Replicates | Species | Organ | Tissue | Adj P-value | Log2FC | Malignancy |
| 8463 | TEAD2 | LZE4T | Human | Esophagus | ESCC | 2.37e-02 | 9.00e-02 | 0.0811 |
| 8463 | TEAD2 | LZE7T | Human | Esophagus | ESCC | 6.13e-07 | 3.36e-01 | 0.0667 |
| 8463 | TEAD2 | LZE8T | Human | Esophagus | ESCC | 6.71e-04 | 1.48e-01 | 0.067 |
| 8463 | TEAD2 | LZE22T | Human | Esophagus | ESCC | 1.57e-03 | 2.21e-01 | 0.068 |
| 8463 | TEAD2 | LZE24T | Human | Esophagus | ESCC | 2.20e-04 | 1.26e-01 | 0.0596 |
| 8463 | TEAD2 | P1T-E | Human | Esophagus | ESCC | 4.53e-14 | 4.33e-01 | 0.0875 |
| 8463 | TEAD2 | P2T-E | Human | Esophagus | ESCC | 4.91e-47 | 8.24e-01 | 0.1177 |
| 8463 | TEAD2 | P4T-E | Human | Esophagus | ESCC | 3.74e-25 | 4.77e-01 | 0.1323 |
| 8463 | TEAD2 | P5T-E | Human | Esophagus | ESCC | 1.99e-06 | 7.28e-02 | 0.1327 |
| 8463 | TEAD2 | P8T-E | Human | Esophagus | ESCC | 1.24e-20 | 4.34e-01 | 0.0889 |
| 8463 | TEAD2 | P9T-E | Human | Esophagus | ESCC | 5.74e-10 | 2.16e-01 | 0.1131 |
| 8463 | TEAD2 | P10T-E | Human | Esophagus | ESCC | 1.54e-37 | 6.77e-01 | 0.116 |
| 8463 | TEAD2 | P11T-E | Human | Esophagus | ESCC | 1.78e-13 | 5.31e-01 | 0.1426 |
| 8463 | TEAD2 | P12T-E | Human | Esophagus | ESCC | 9.71e-23 | 5.22e-01 | 0.1122 |
| 8463 | TEAD2 | P15T-E | Human | Esophagus | ESCC | 1.96e-35 | 6.07e-01 | 0.1149 |
| 8463 | TEAD2 | P16T-E | Human | Esophagus | ESCC | 3.35e-27 | 4.70e-01 | 0.1153 |
| 8463 | TEAD2 | P17T-E | Human | Esophagus | ESCC | 3.31e-19 | 5.79e-01 | 0.1278 |
| 8463 | TEAD2 | P19T-E | Human | Esophagus | ESCC | 1.65e-10 | 6.91e-01 | 0.1662 |
| 8463 | TEAD2 | P20T-E | Human | Esophagus | ESCC | 1.61e-08 | 1.90e-01 | 0.1124 |
| 8463 | TEAD2 | P21T-E | Human | Esophagus | ESCC | 1.30e-33 | 5.66e-01 | 0.1617 |
| Page: 1 2 3 4 5 |
| Tissue | Expression Dynamics | Abbreviation |
| Esophagus |  | ESCC: Esophageal squamous cell carcinoma |
| HGIN: High-grade intraepithelial neoplasias | ||
| LGIN: Low-grade intraepithelial neoplasias | ||
| Liver | 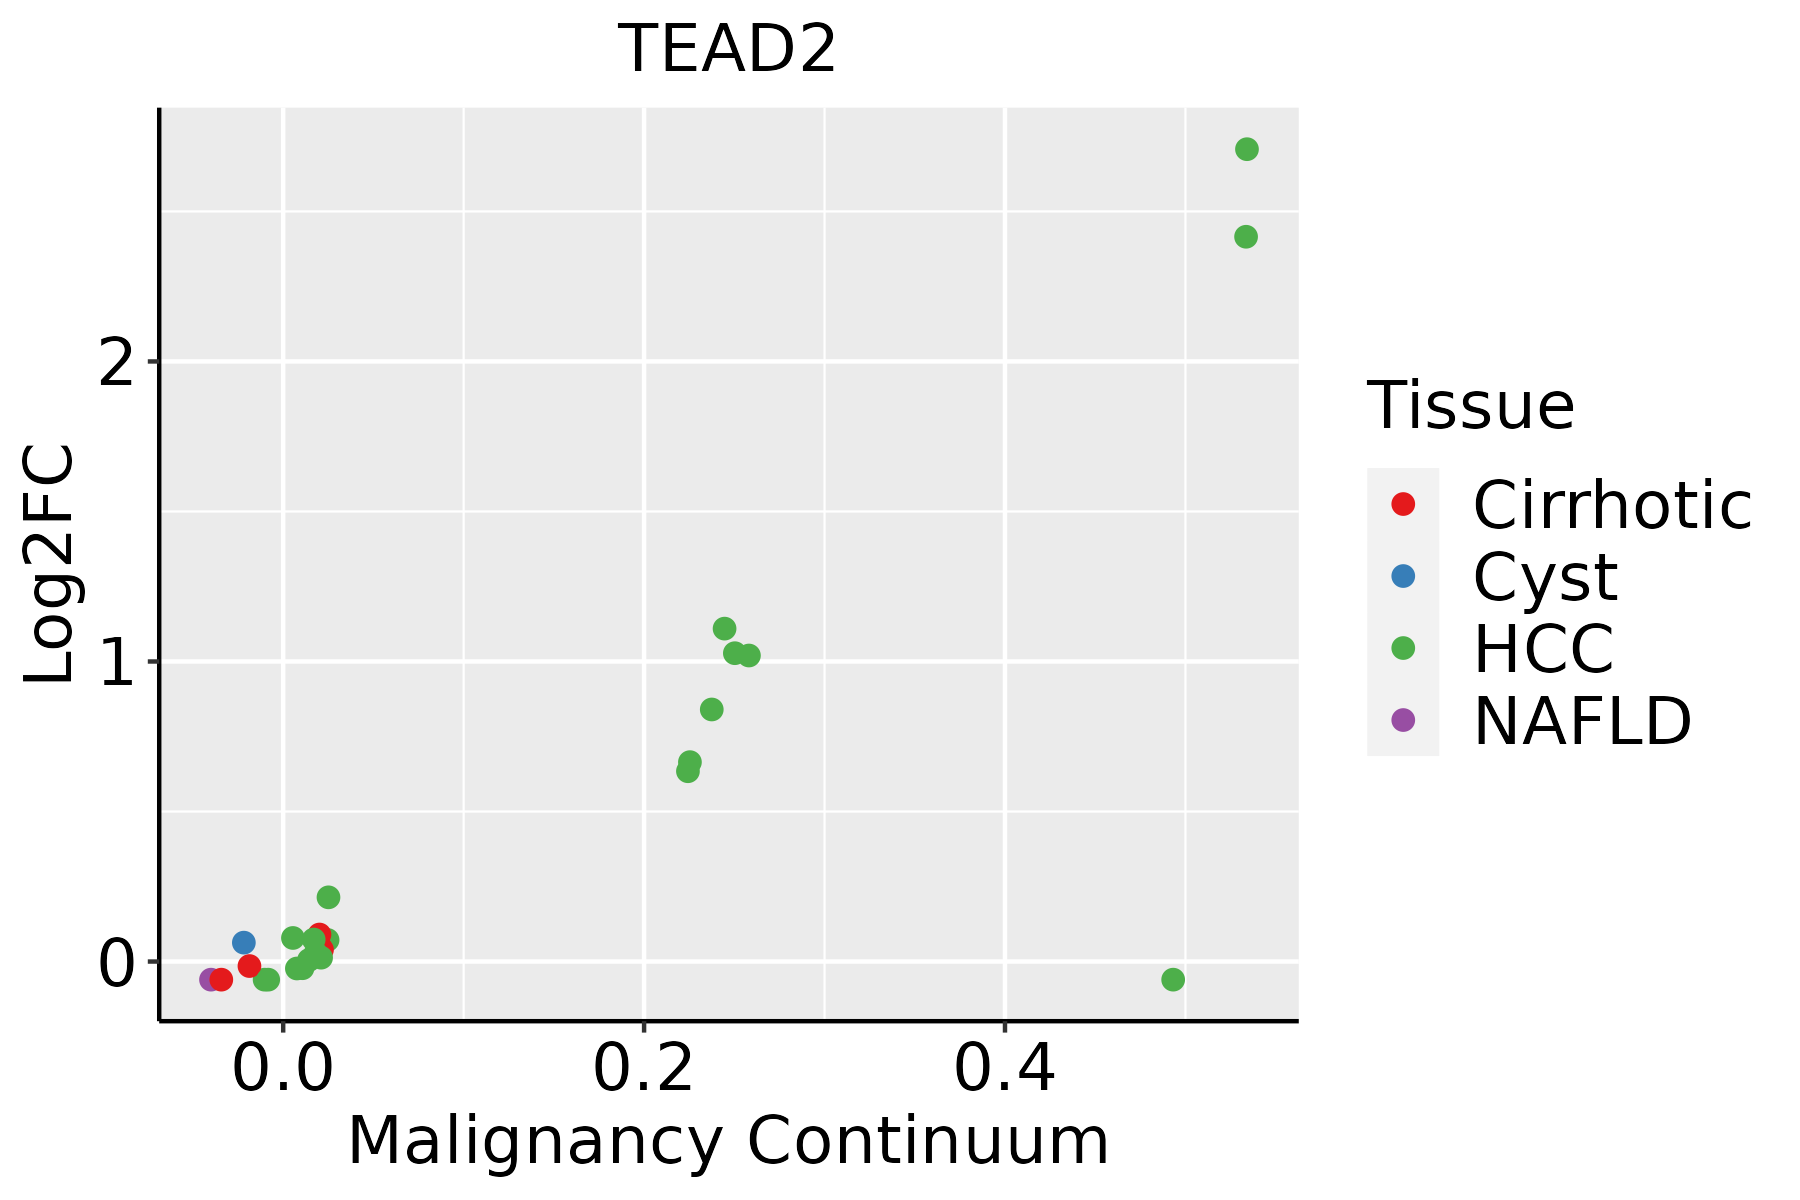 | HCC: Hepatocellular carcinoma |
| NAFLD: Non-alcoholic fatty liver disease | ||
| Oral Cavity | 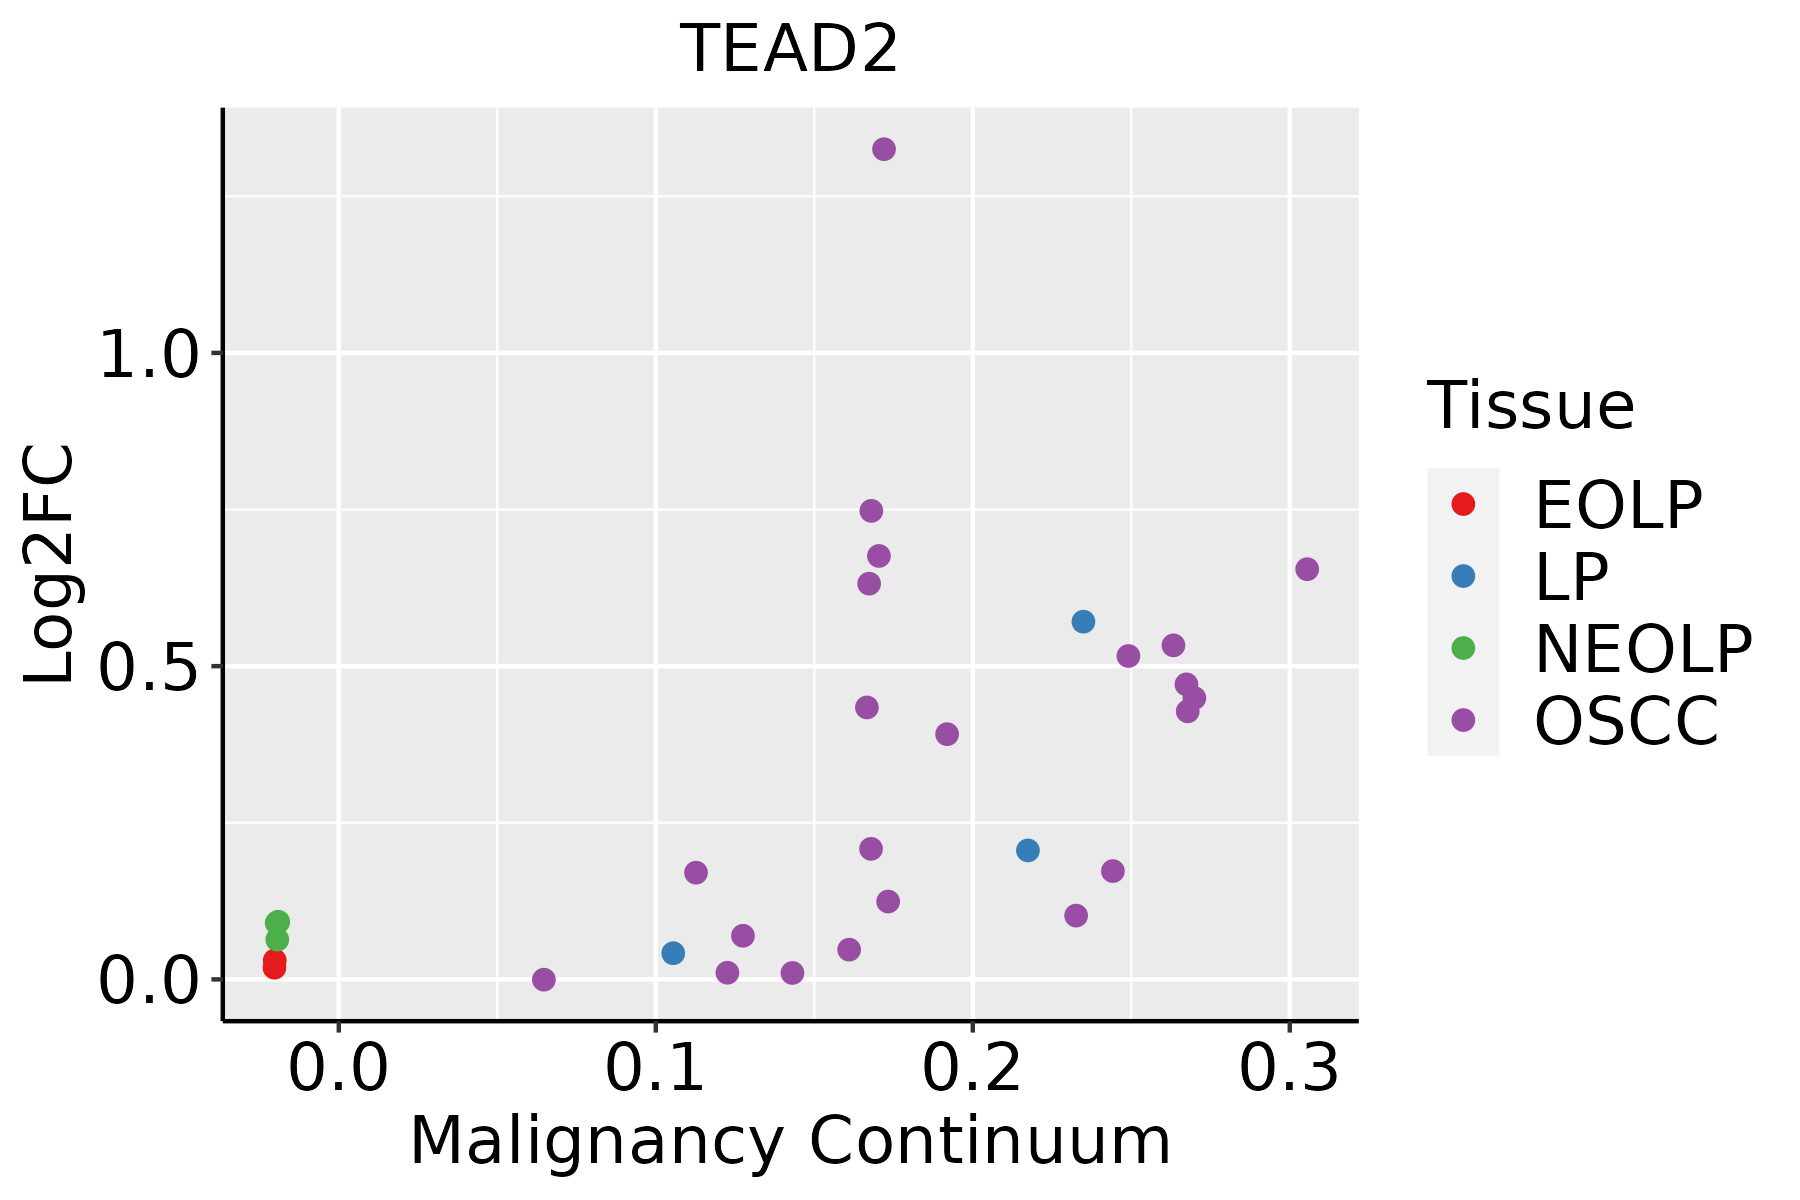 | EOLP: Erosive Oral lichen planus |
| LP: leukoplakia | ||
| NEOLP: Non-erosive oral lichen planus | ||
| OSCC: Oral squamous cell carcinoma |
| ∗log2FC in expression of this searched gene in stem-like cells from each diseased tissue sample relative to stem-like cells in normal samples in each tissue plotted against the malignancy continuum. Samples are colored based on if they are from different disease stage. |
Top |
Malignant transformation related pathway analysis |
| Find out the enriched GO biological processes and KEGG pathways involved in transition from healthy to precancer to cancer |
| Tissue | Disease Stage | Enriched GO biological Processes |
| Colorectum | AD |  |
| Colorectum | SER |  |
| Colorectum | MSS |  |
| Colorectum | MSI-H |  |
| Colorectum | FAP |  |
| ∗Top 15 enriched GO BP terms are showed in the bar plot of each disease state in each tissue. Each row represents a significant GO biological process which is colored according to the -log10(p.adjust). |
| Page: 1 2 3 4 5 6 7 8 9 |
| GO ID | Tissue | Disease Stage | Description | Gene Ratio | Bg Ratio | pvalue | p.adjust | Count |
| GO:000184115 | Esophagus | ESCC | neural tube formation | 75/8552 | 102/18723 | 9.68e-09 | 1.95e-07 | 75 |
| GO:000184314 | Esophagus | ESCC | neural tube closure | 66/8552 | 88/18723 | 1.98e-08 | 3.82e-07 | 66 |
| GO:001402014 | Esophagus | ESCC | primary neural tube formation | 69/8552 | 94/18723 | 4.22e-08 | 7.76e-07 | 69 |
| GO:006060614 | Esophagus | ESCC | tube closure | 66/8552 | 89/18723 | 4.24e-08 | 7.76e-07 | 66 |
| GO:00219159 | Esophagus | ESCC | neural tube development | 101/8552 | 152/18723 | 1.78e-07 | 2.79e-06 | 101 |
| GO:00163316 | Esophagus | ESCC | morphogenesis of embryonic epithelium | 98/8552 | 147/18723 | 2.12e-07 | 3.27e-06 | 98 |
| GO:000183814 | Esophagus | ESCC | embryonic epithelial tube formation | 83/8552 | 121/18723 | 2.78e-07 | 4.08e-06 | 83 |
| GO:003514815 | Esophagus | ESCC | tube formation | 96/8552 | 148/18723 | 1.86e-06 | 2.16e-05 | 96 |
| GO:00721759 | Esophagus | ESCC | epithelial tube formation | 86/8552 | 132/18723 | 4.81e-06 | 5.10e-05 | 86 |
| GO:006056210 | Esophagus | ESCC | epithelial tube morphogenesis | 187/8552 | 325/18723 | 9.95e-06 | 9.44e-05 | 187 |
| GO:00488638 | Esophagus | ESCC | stem cell differentiation | 122/8552 | 206/18723 | 5.95e-05 | 4.59e-04 | 122 |
| GO:00485687 | Esophagus | ESCC | embryonic organ development | 228/8552 | 427/18723 | 7.28e-04 | 3.79e-03 | 228 |
| GO:200073614 | Esophagus | ESCC | regulation of stem cell differentiation | 39/8552 | 58/18723 | 7.43e-04 | 3.86e-03 | 39 |
| GO:00604856 | Esophagus | ESCC | mesenchyme development | 156/8552 | 291/18723 | 3.76e-03 | 1.53e-02 | 156 |
| GO:00325261 | Esophagus | ESCC | response to retinoic acid | 63/8552 | 107/18723 | 4.05e-03 | 1.62e-02 | 63 |
| GO:0048339 | Esophagus | ESCC | paraxial mesoderm development | 13/8552 | 17/18723 | 1.00e-02 | 3.42e-02 | 13 |
| GO:00353297 | Esophagus | ESCC | hippo signaling | 26/8552 | 40/18723 | 1.08e-02 | 3.66e-02 | 26 |
| GO:00018415 | Liver | HCC | neural tube formation | 62/7958 | 102/18723 | 1.47e-04 | 1.18e-03 | 62 |
| GO:00018433 | Liver | HCC | neural tube closure | 53/7958 | 88/18723 | 5.95e-04 | 3.75e-03 | 53 |
| GO:00140204 | Liver | HCC | primary neural tube formation | 56/7958 | 94/18723 | 6.19e-04 | 3.86e-03 | 56 |
| Page: 1 2 3 |
| Pathway ID | Tissue | Disease Stage | Description | Gene Ratio | Bg Ratio | pvalue | p.adjust | qvalue | Count |
| hsa0439018 | Esophagus | ESCC | Hippo signaling pathway | 92/4205 | 157/8465 | 1.46e-02 | 3.31e-02 | 1.69e-02 | 92 |
| hsa0439019 | Esophagus | ESCC | Hippo signaling pathway | 92/4205 | 157/8465 | 1.46e-02 | 3.31e-02 | 1.69e-02 | 92 |
| hsa0439016 | Oral cavity | OSCC | Hippo signaling pathway | 86/3704 | 157/8465 | 3.30e-03 | 8.24e-03 | 4.20e-03 | 86 |
| hsa0439017 | Oral cavity | OSCC | Hippo signaling pathway | 86/3704 | 157/8465 | 3.30e-03 | 8.24e-03 | 4.20e-03 | 86 |
| Page: 1 |
Top |
Cell-cell communication analysis |
| Identification of potential cell-cell interactions between two cell types and their ligand-receptor pairs for different disease states |
| Ligand | Receptor | LRpair | Pathway | Tissue | Disease Stage |
| Page: 1 |
Top |
Single-cell gene regulatory network inference analysis |
| Find out the significant the regulons (TFs) and the target genes of each regulon across cell types for different disease states |
| TF | Cell Type | Tissue | Disease Stage | Target Gene | RSS | Regulon Activity |
| TEAD2 | STM | Endometrium | EEC | SAMD11,BMF,MFAP2, etc. | 4.94e-01 |  |
| TEAD2 | AT2L | Lung | IAC | PODXL2,SBK1,SPON2, etc. | 4.90e-01 |  |
| TEAD2 | MESC | Stomach | Healthy | MAT2B,COA6,HIF1A, etc. | 1.39e-02 |  |
| TEAD2 | MESC | Stomach | SIM | SOX4,GAB2,MYLIP, etc. | 1.42e-01 |  |
| ∗The dot plots of a searched regulon are shown for all cell subpopulations in each disease state of each tissue based on the regulon specific score inferred using pySCENIC and by calculating the average expression. |
| Page: 1 |
Top |
Somatic mutation of malignant transformation related genes |
| Annotation of somatic variants for genes involved in malignant transformation |
| Hugo Symbol | Variant Class | Variant Classification | dbSNP RS | HGVSc | HGVSp | HGVSp Short | SWISSPROT | BIOTYPE | SIFT | PolyPhen | Tumor Sample Barcode | Tissue | Histology | Sex | Age | Stage | Therapy Types | Drugs | Outcome |
| TEAD2 | SNV | Missense_Mutation | c.254N>A | p.Arg85His | p.R85H | Q15562 | protein_coding | deleterious(0.01) | probably_damaging(0.991) | TCGA-AN-A0AK-01 | Breast | breast invasive carcinoma | Female | >=65 | I/II | Unknown | Unknown | SD | |
| TEAD2 | SNV | Missense_Mutation | c.859G>A | p.Gly287Ser | p.G287S | Q15562 | protein_coding | deleterious(0.02) | probably_damaging(0.998) | TCGA-AN-A0AS-01 | Breast | breast invasive carcinoma | Female | >=65 | III/IV | Unknown | Unknown | SD | |
| TEAD2 | SNV | Missense_Mutation | novel | c.463N>T | p.Gly155Cys | p.G155C | Q15562 | protein_coding | deleterious(0.04) | possibly_damaging(0.76) | TCGA-OL-A97C-01 | Breast | breast invasive carcinoma | Female | >=65 | I/II | Unknown | Unknown | PD |
| TEAD2 | insertion | In_Frame_Ins | novel | c.803_804insTCCGCCTCCTGGATTCAAGCGATT | p.Pro269_Leu270insProProGlyPheLysArgLeuPro | p.P269_L270insPPGFKRLP | Q15562 | protein_coding | TCGA-BH-A0BV-01 | Breast | breast invasive carcinoma | Female | >=65 | I/II | Chemotherapy | doxorubicin | SD | ||
| TEAD2 | insertion | Nonsense_Mutation | novel | c.784_785insAATAGGGTCCTGGGCATG | p.Cys262delinsTer | p.C262delins* | Q15562 | protein_coding | TCGA-BH-A0H7-01 | Breast | breast invasive carcinoma | Female | >=65 | III/IV | Chemotherapy | doxorubicin | SD | ||
| TEAD2 | SNV | Missense_Mutation | rs768259774 | c.25N>A | p.Ala9Thr | p.A9T | Q15562 | protein_coding | tolerated_low_confidence(0.78) | benign(0.034) | TCGA-2W-A8YY-01 | Cervix | cervical & endocervical cancer | Female | <65 | I/II | Chemotherapy | cisplatin | CR |
| TEAD2 | SNV | Missense_Mutation | c.878N>G | p.Tyr293Cys | p.Y293C | Q15562 | protein_coding | deleterious(0.04) | benign(0.006) | TCGA-EA-A1QT-01 | Cervix | cervical & endocervical cancer | Female | <65 | I/II | Unknown | Unknown | SD | |
| TEAD2 | SNV | Missense_Mutation | c.1346T>C | p.Val449Ala | p.V449A | Q15562 | protein_coding | deleterious(0.02) | benign(0.173) | TCGA-AA-A010-01 | Colorectum | colon adenocarcinoma | Female | <65 | I/II | Chemotherapy | folinic | CR | |
| TEAD2 | SNV | Missense_Mutation | c.918C>A | p.Phe306Leu | p.F306L | Q15562 | protein_coding | deleterious(0.05) | benign(0.006) | TCGA-AA-A010-01 | Colorectum | colon adenocarcinoma | Female | <65 | I/II | Chemotherapy | folinic | CR | |
| TEAD2 | insertion | Frame_Shift_Ins | rs754449773 | c.619_620insC | p.Gln207ProfsTer42 | p.Q207Pfs*42 | Q15562 | protein_coding | TCGA-NH-A5IV-01 | Colorectum | colon adenocarcinoma | Female | >=65 | I/II | Unknown | Unknown | SD |
| Page: 1 2 3 4 5 6 |
Top |
Related drugs of malignant transformation related genes |
| Identification of chemicals and drugs interact with genes involved in malignant transfromation |
| (DGIdb 4.0) |
| Entrez ID | Symbol | Category | Interaction Types | Drug Claim Name | Drug Name | PMIDs |
| Page: 1 |

Copyright 2023-Present -The University of Texas Health Science Center at Houston |