
|
|||||
|
 | |
| |
| |
| |
| |
| |
|
Gene: TEAD1 |
Gene summary for TEAD1 |
| Gene information | Species | Human | Gene symbol | TEAD1 | Gene ID | 7003 |
| Gene name | TEA domain transcription factor 1 | |
| Gene Alias | AA | |
| Cytomap | 11p15.3 | |
| Gene Type | protein-coding | GO ID | GO:0006139 | UniProtAcc | P28347 |
Top |
Malignant transformation analysis |
| Identification of the aberrant gene expression in precancerous and cancerous lesions by comparing the gene expression of stem-like cells in diseased tissues with normal stem cells |
| Entrez ID | Symbol | Replicates | Species | Organ | Tissue | Adj P-value | Log2FC | Malignancy |
| 7003 | TEAD1 | CA_HPV_1 | Human | Cervix | CC | 3.29e-03 | -1.59e-01 | 0.0264 |
| 7003 | TEAD1 | CCI_2 | Human | Cervix | CC | 7.48e-11 | 1.72e+00 | 0.5249 |
| 7003 | TEAD1 | CCI_3 | Human | Cervix | CC | 6.12e-11 | 1.03e+00 | 0.516 |
| 7003 | TEAD1 | H2 | Human | Cervix | HSIL_HPV | 1.31e-03 | 2.81e-01 | 0.0632 |
| 7003 | TEAD1 | HTA11_3410_2000001011 | Human | Colorectum | AD | 3.86e-12 | -4.96e-01 | 0.0155 |
| 7003 | TEAD1 | HTA11_2487_2000001011 | Human | Colorectum | SER | 1.82e-10 | -5.53e-01 | -0.1808 |
| 7003 | TEAD1 | HTA11_2951_2000001011 | Human | Colorectum | AD | 8.41e-04 | -5.93e-01 | 0.0216 |
| 7003 | TEAD1 | HTA11_347_2000001011 | Human | Colorectum | AD | 1.09e-03 | -3.67e-01 | -0.1954 |
| 7003 | TEAD1 | HTA11_3361_2000001011 | Human | Colorectum | AD | 7.47e-06 | -5.25e-01 | -0.1207 |
| 7003 | TEAD1 | HTA11_83_2000001011 | Human | Colorectum | SER | 1.20e-06 | -4.55e-01 | -0.1526 |
| 7003 | TEAD1 | HTA11_696_2000001011 | Human | Colorectum | AD | 4.07e-09 | -4.43e-01 | -0.1464 |
| 7003 | TEAD1 | HTA11_866_2000001011 | Human | Colorectum | AD | 9.84e-11 | -4.68e-01 | -0.1001 |
| 7003 | TEAD1 | HTA11_2992_2000001011 | Human | Colorectum | SER | 4.46e-04 | -7.94e-01 | -0.1706 |
| 7003 | TEAD1 | HTA11_5212_2000001011 | Human | Colorectum | AD | 6.31e-07 | -7.93e-01 | -0.2061 |
| 7003 | TEAD1 | HTA11_5216_2000001011 | Human | Colorectum | SER | 3.28e-05 | -9.09e-01 | -0.1462 |
| 7003 | TEAD1 | HTA11_7862_2000001011 | Human | Colorectum | AD | 9.46e-06 | -6.36e-01 | -0.0179 |
| 7003 | TEAD1 | HTA11_866_3004761011 | Human | Colorectum | AD | 9.75e-05 | -3.72e-01 | 0.096 |
| 7003 | TEAD1 | HTA11_4255_2000001011 | Human | Colorectum | SER | 2.06e-03 | -4.23e-01 | 0.0446 |
| 7003 | TEAD1 | HTA11_8622_2000001021 | Human | Colorectum | SER | 1.72e-03 | -6.62e-01 | 0.0528 |
| 7003 | TEAD1 | HTA11_10623_2000001011 | Human | Colorectum | AD | 4.40e-03 | -4.46e-01 | -0.0177 |
| Page: 1 2 3 4 5 6 7 8 9 10 |
| Tissue | Expression Dynamics | Abbreviation |
| Cervix |  | CC: Cervix cancer |
| HSIL_HPV: HPV-infected high-grade squamous intraepithelial lesions | ||
| N_HPV: HPV-infected normal cervix | ||
| Colorectum (GSE201348) |  | FAP: Familial adenomatous polyposis |
| CRC: Colorectal cancer | ||
| Colorectum (HTA11) |  | AD: Adenomas |
| SER: Sessile serrated lesions | ||
| MSI-H: Microsatellite-high colorectal cancer | ||
| MSS: Microsatellite stable colorectal cancer | ||
| Endometrium | 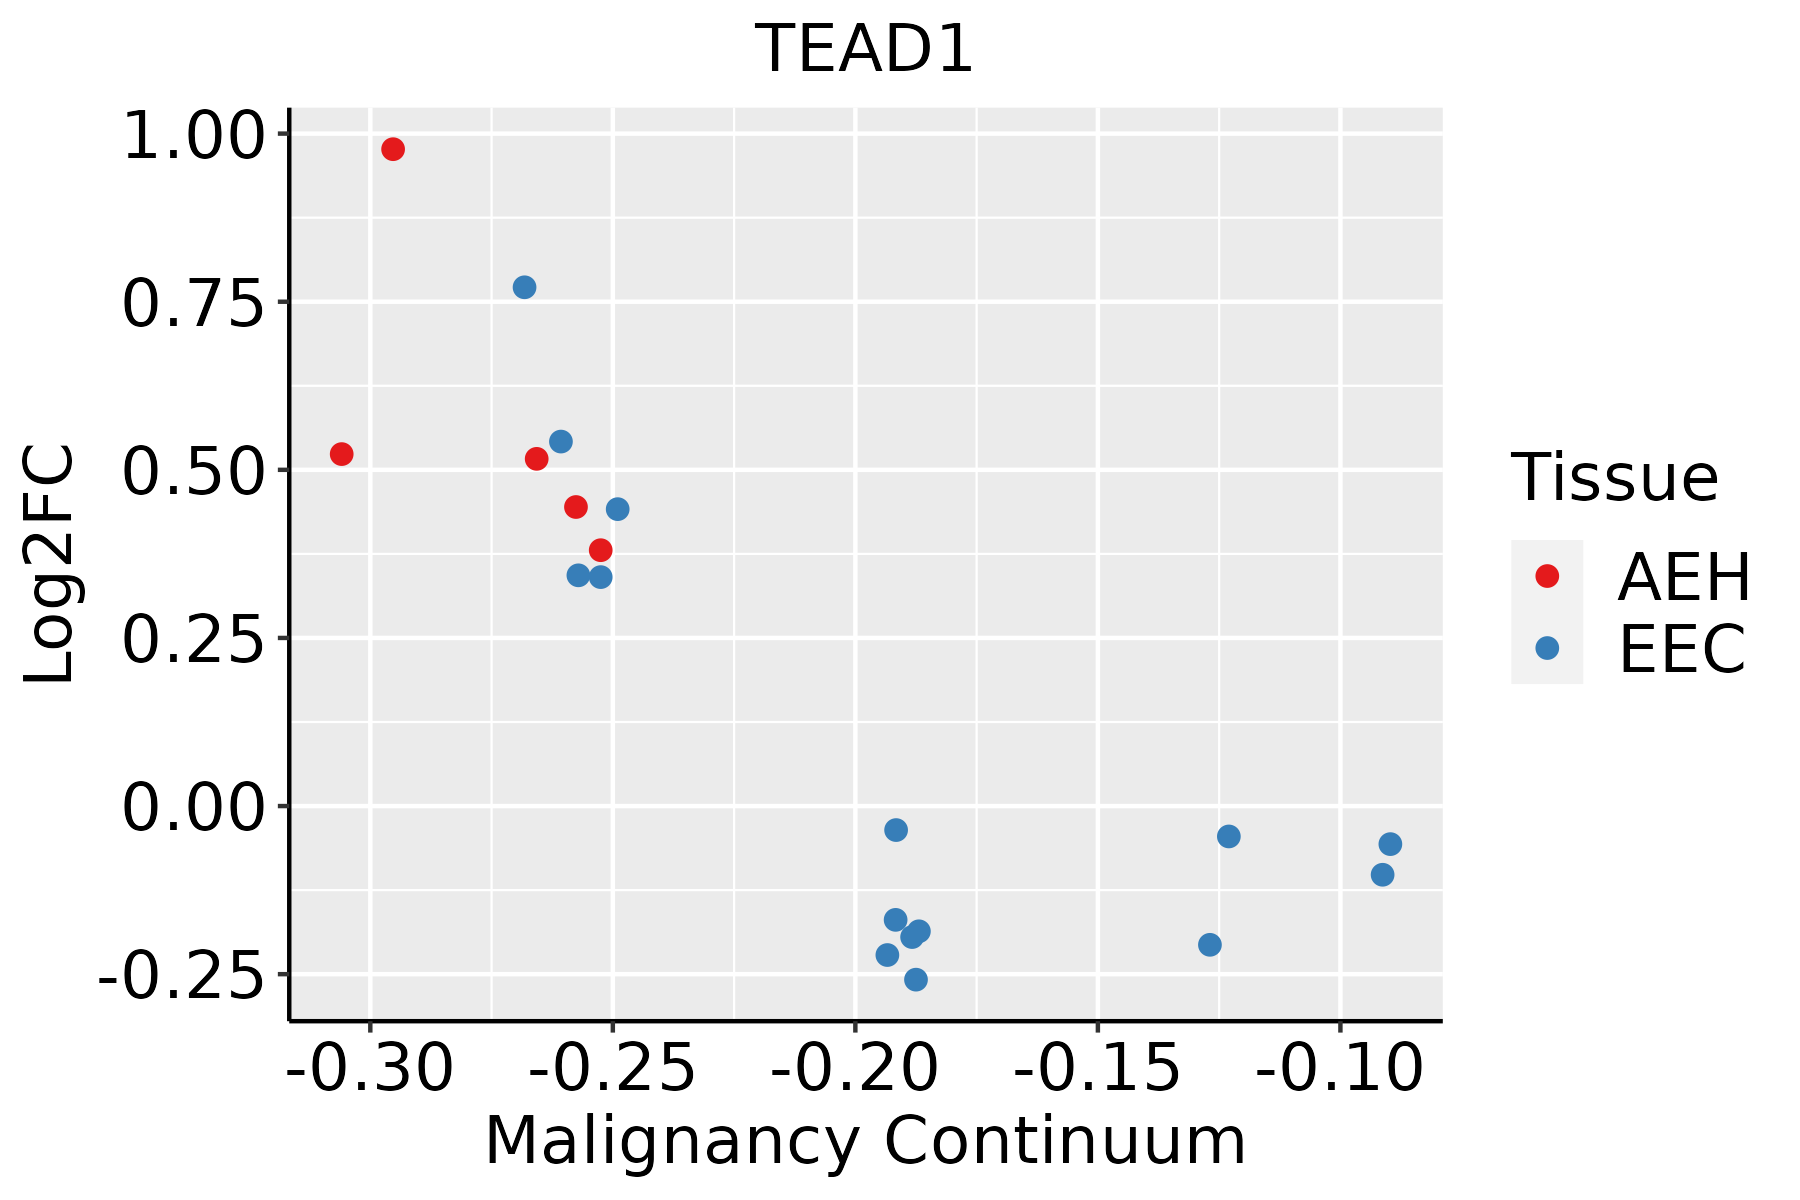 | AEH: Atypical endometrial hyperplasia |
| EEC: Endometrioid Cancer | ||
| Esophagus |  | ESCC: Esophageal squamous cell carcinoma |
| HGIN: High-grade intraepithelial neoplasias | ||
| LGIN: Low-grade intraepithelial neoplasias | ||
| Liver | 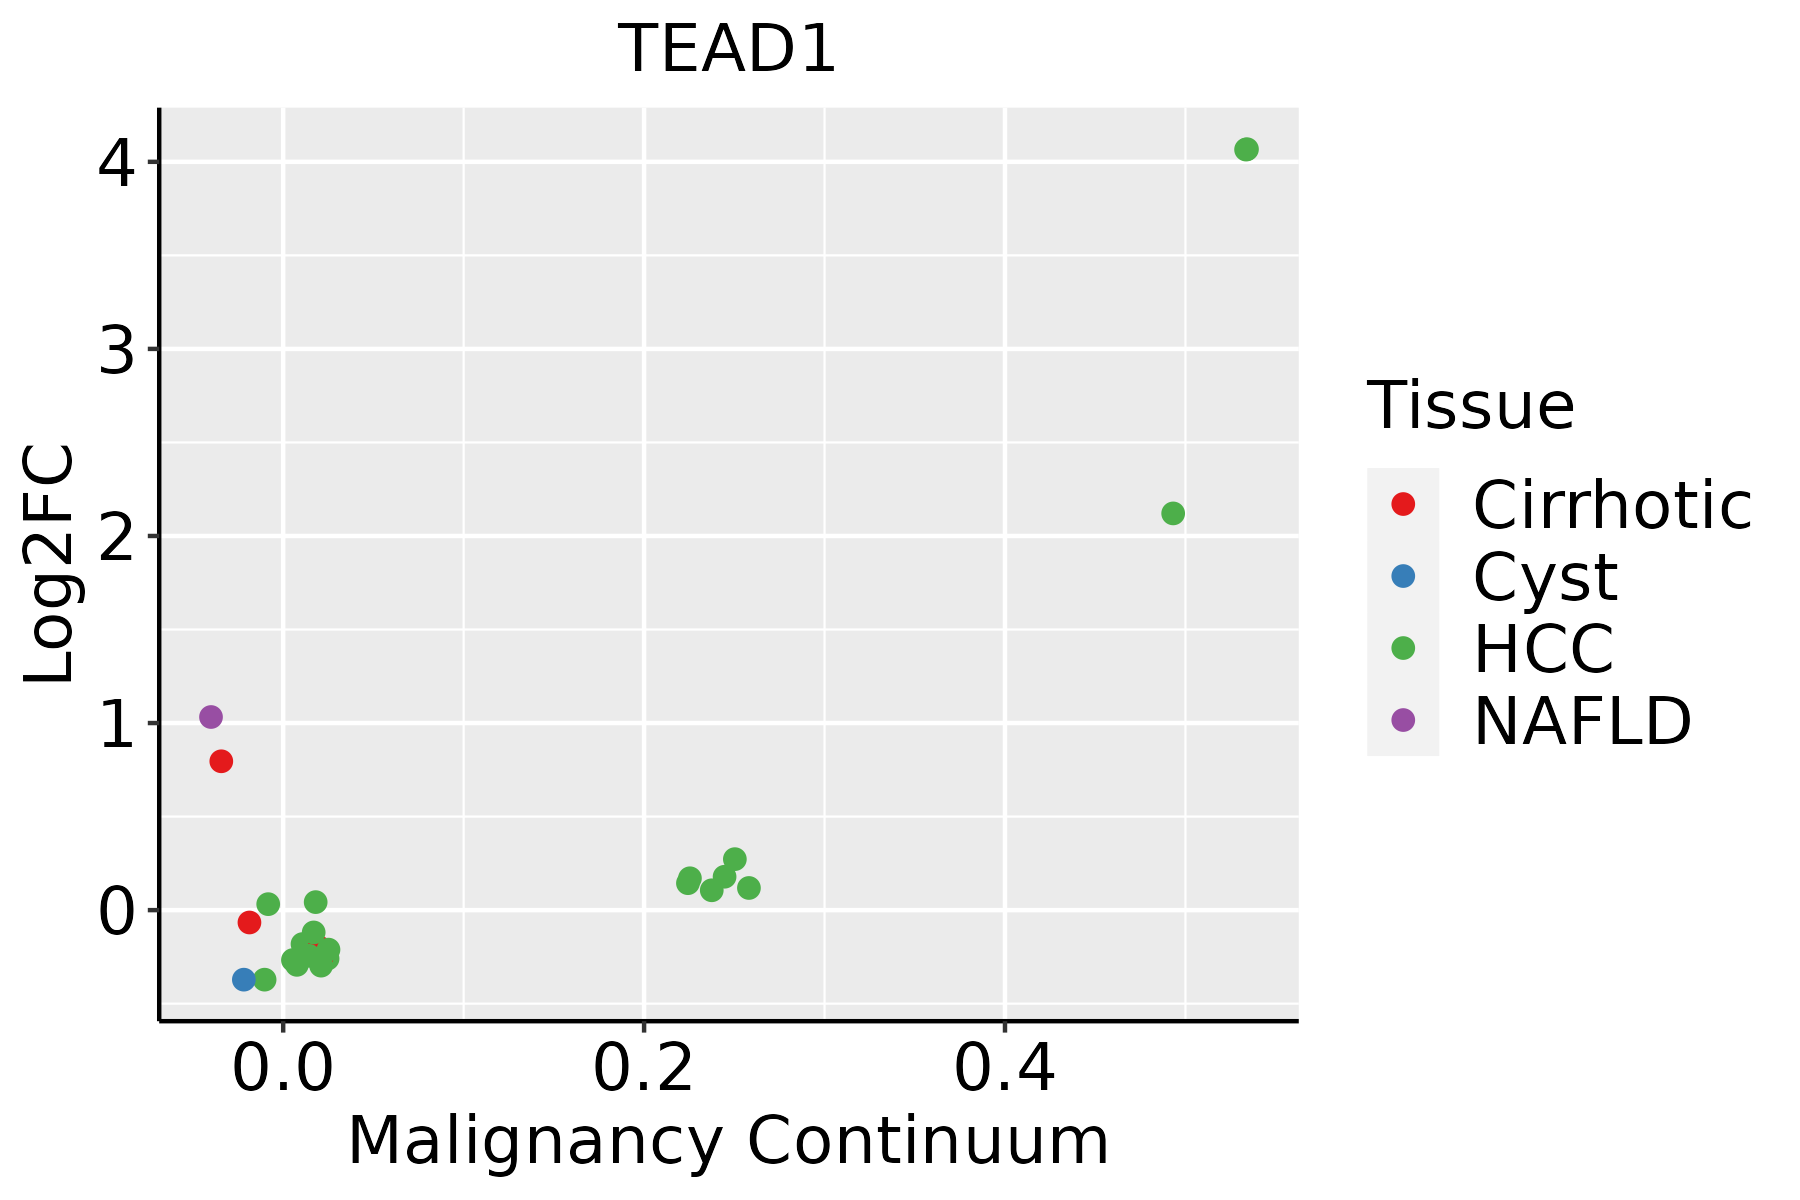 | HCC: Hepatocellular carcinoma |
| NAFLD: Non-alcoholic fatty liver disease | ||
| Lung |  | AAH: Atypical adenomatous hyperplasia |
| AIS: Adenocarcinoma in situ | ||
| IAC: Invasive lung adenocarcinoma | ||
| MIA: Minimally invasive adenocarcinoma | ||
| Prostate |  | BPH: Benign Prostatic Hyperplasia |
| Thyroid | 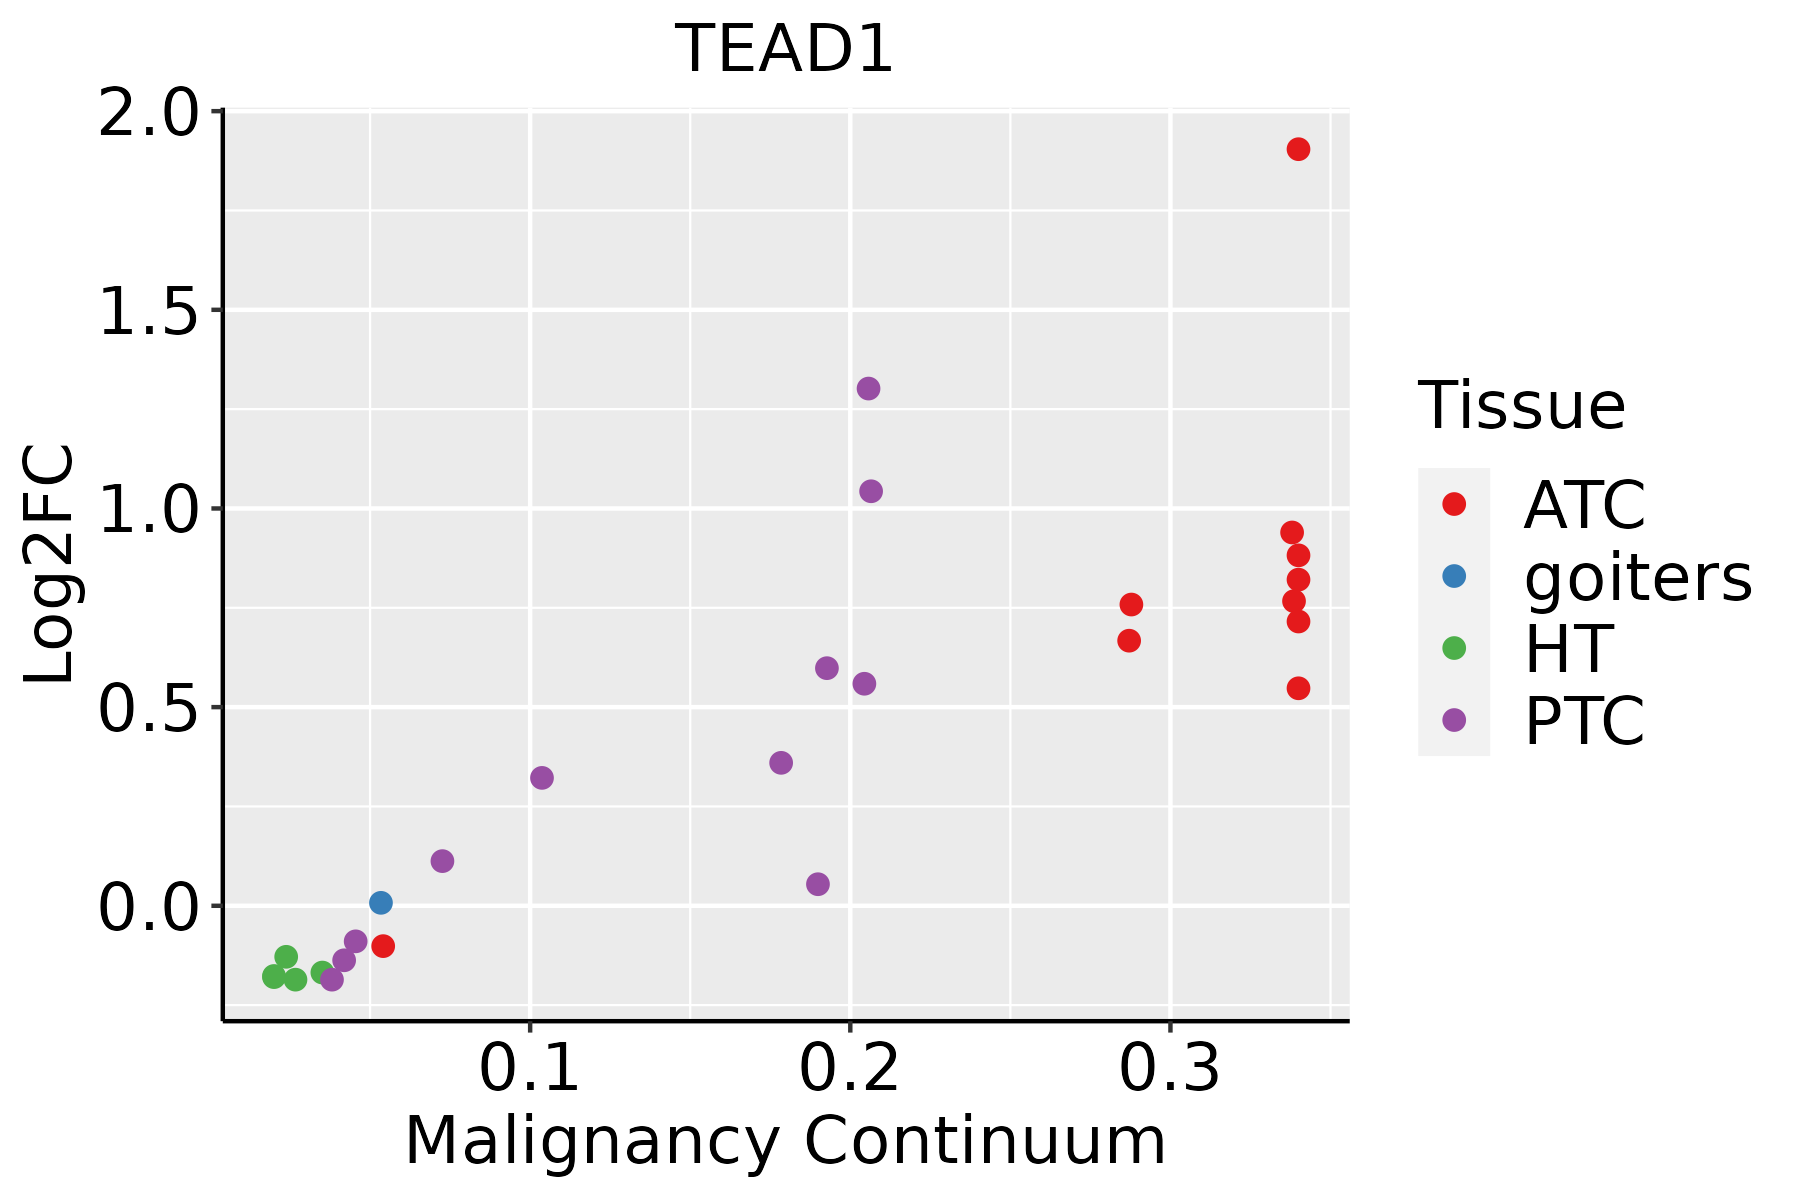 | ATC: Anaplastic thyroid cancer |
| HT: Hashimoto's thyroiditis | ||
| PTC: Papillary thyroid cancer |
| ∗log2FC in expression of this searched gene in stem-like cells from each diseased tissue sample relative to stem-like cells in normal samples in each tissue plotted against the malignancy continuum. Samples are colored based on if they are from different disease stage. |
Top |
Malignant transformation related pathway analysis |
| Find out the enriched GO biological processes and KEGG pathways involved in transition from healthy to precancer to cancer |
| Tissue | Disease Stage | Enriched GO biological Processes |
| Colorectum | AD |  |
| Colorectum | SER |  |
| Colorectum | MSS |  |
| Colorectum | MSI-H |  |
| Colorectum | FAP |  |
| ∗Top 15 enriched GO BP terms are showed in the bar plot of each disease state in each tissue. Each row represents a significant GO biological process which is colored according to the -log10(p.adjust). |
| Page: 1 2 3 4 5 6 7 8 9 |
| GO ID | Tissue | Disease Stage | Description | Gene Ratio | Bg Ratio | pvalue | p.adjust | Count |
| GO:00616148 | Cervix | CC | pri-miRNA transcription by RNA polymerase II | 20/2311 | 55/18723 | 4.22e-06 | 1.09e-04 | 20 |
| GO:19028938 | Cervix | CC | regulation of pri-miRNA transcription by RNA polymerase II | 19/2311 | 54/18723 | 1.27e-05 | 2.60e-04 | 19 |
| GO:19028955 | Cervix | CC | positive regulation of pri-miRNA transcription by RNA polymerase II | 15/2311 | 42/18723 | 8.42e-05 | 1.13e-03 | 15 |
| GO:00353294 | Cervix | CC | hippo signaling | 12/2311 | 40/18723 | 2.44e-03 | 1.71e-02 | 12 |
| GO:190289513 | Cervix | HSIL_HPV | positive regulation of pri-miRNA transcription by RNA polymerase II | 7/737 | 42/18723 | 1.15e-03 | 1.38e-02 | 7 |
| GO:006161414 | Cervix | HSIL_HPV | pri-miRNA transcription by RNA polymerase II | 8/737 | 55/18723 | 1.31e-03 | 1.51e-02 | 8 |
| GO:190289314 | Cervix | HSIL_HPV | regulation of pri-miRNA transcription by RNA polymerase II | 7/737 | 54/18723 | 5.04e-03 | 4.12e-02 | 7 |
| GO:0061614 | Colorectum | AD | pri-miRNA transcription by RNA polymerase II | 24/3918 | 55/18723 | 1.22e-04 | 1.78e-03 | 24 |
| GO:1902893 | Colorectum | AD | regulation of pri-miRNA transcription by RNA polymerase II | 23/3918 | 54/18723 | 2.60e-04 | 3.25e-03 | 23 |
| GO:1902895 | Colorectum | AD | positive regulation of pri-miRNA transcription by RNA polymerase II | 17/3918 | 42/18723 | 3.10e-03 | 2.30e-02 | 17 |
| GO:0048568 | Colorectum | AD | embryonic organ development | 112/3918 | 427/18723 | 4.60e-03 | 3.14e-02 | 112 |
| GO:00616141 | Colorectum | SER | pri-miRNA transcription by RNA polymerase II | 18/2897 | 55/18723 | 1.11e-03 | 1.28e-02 | 18 |
| GO:19028931 | Colorectum | SER | regulation of pri-miRNA transcription by RNA polymerase II | 17/2897 | 54/18723 | 2.42e-03 | 2.30e-02 | 17 |
| GO:00616142 | Colorectum | MSS | pri-miRNA transcription by RNA polymerase II | 19/3467 | 55/18723 | 3.47e-03 | 2.59e-02 | 19 |
| GO:00485681 | Colorectum | MSS | embryonic organ development | 100/3467 | 427/18723 | 6.00e-03 | 4.03e-02 | 100 |
| GO:19028932 | Colorectum | MSS | regulation of pri-miRNA transcription by RNA polymerase II | 18/3467 | 54/18723 | 6.70e-03 | 4.38e-02 | 18 |
| GO:00616143 | Colorectum | FAP | pri-miRNA transcription by RNA polymerase II | 21/2622 | 55/18723 | 7.50e-06 | 2.25e-04 | 21 |
| GO:19028933 | Colorectum | FAP | regulation of pri-miRNA transcription by RNA polymerase II | 20/2622 | 54/18723 | 2.09e-05 | 5.05e-04 | 20 |
| GO:19028951 | Colorectum | FAP | positive regulation of pri-miRNA transcription by RNA polymerase II | 14/2622 | 42/18723 | 1.20e-03 | 1.14e-02 | 14 |
| GO:00485682 | Colorectum | FAP | embryonic organ development | 79/2622 | 427/18723 | 5.32e-03 | 3.49e-02 | 79 |
| Page: 1 2 3 4 |
| Pathway ID | Tissue | Disease Stage | Description | Gene Ratio | Bg Ratio | pvalue | p.adjust | qvalue | Count |
| hsa043908 | Cervix | CC | Hippo signaling pathway | 40/1267 | 157/8465 | 3.64e-04 | 1.82e-03 | 1.07e-03 | 40 |
| hsa0439013 | Cervix | CC | Hippo signaling pathway | 40/1267 | 157/8465 | 3.64e-04 | 1.82e-03 | 1.07e-03 | 40 |
| hsa04390 | Colorectum | MSS | Hippo signaling pathway | 48/1875 | 157/8465 | 8.32e-03 | 3.10e-02 | 1.90e-02 | 48 |
| hsa043901 | Colorectum | MSS | Hippo signaling pathway | 48/1875 | 157/8465 | 8.32e-03 | 3.10e-02 | 1.90e-02 | 48 |
| hsa043902 | Colorectum | FAP | Hippo signaling pathway | 41/1404 | 157/8465 | 1.49e-03 | 7.91e-03 | 4.81e-03 | 41 |
| hsa043903 | Colorectum | FAP | Hippo signaling pathway | 41/1404 | 157/8465 | 1.49e-03 | 7.91e-03 | 4.81e-03 | 41 |
| hsa043904 | Colorectum | CRC | Hippo signaling pathway | 32/1091 | 157/8465 | 5.17e-03 | 2.72e-02 | 1.84e-02 | 32 |
| hsa043905 | Colorectum | CRC | Hippo signaling pathway | 32/1091 | 157/8465 | 5.17e-03 | 2.72e-02 | 1.84e-02 | 32 |
| hsa043909 | Endometrium | AEH | Hippo signaling pathway | 38/1197 | 157/8465 | 4.79e-04 | 3.38e-03 | 2.47e-03 | 38 |
| hsa0439014 | Endometrium | AEH | Hippo signaling pathway | 38/1197 | 157/8465 | 4.79e-04 | 3.38e-03 | 2.47e-03 | 38 |
| hsa0439023 | Endometrium | EEC | Hippo signaling pathway | 39/1237 | 157/8465 | 4.54e-04 | 3.47e-03 | 2.59e-03 | 39 |
| hsa0439033 | Endometrium | EEC | Hippo signaling pathway | 39/1237 | 157/8465 | 4.54e-04 | 3.47e-03 | 2.59e-03 | 39 |
| hsa0439018 | Esophagus | ESCC | Hippo signaling pathway | 92/4205 | 157/8465 | 1.46e-02 | 3.31e-02 | 1.69e-02 | 92 |
| hsa0439019 | Esophagus | ESCC | Hippo signaling pathway | 92/4205 | 157/8465 | 1.46e-02 | 3.31e-02 | 1.69e-02 | 92 |
| hsa043907 | Lung | IAC | Hippo signaling pathway | 35/1053 | 157/8465 | 3.60e-04 | 3.45e-03 | 2.29e-03 | 35 |
| hsa0439012 | Lung | IAC | Hippo signaling pathway | 35/1053 | 157/8465 | 3.60e-04 | 3.45e-03 | 2.29e-03 | 35 |
| hsa0439022 | Lung | AIS | Hippo signaling pathway | 34/961 | 157/8465 | 1.36e-04 | 1.63e-03 | 1.05e-03 | 34 |
| hsa0439032 | Lung | AIS | Hippo signaling pathway | 34/961 | 157/8465 | 1.36e-04 | 1.63e-03 | 1.05e-03 | 34 |
| hsa0439041 | Lung | MIAC | Hippo signaling pathway | 21/507 | 157/8465 | 4.20e-04 | 7.19e-03 | 5.20e-03 | 21 |
| hsa0439051 | Lung | MIAC | Hippo signaling pathway | 21/507 | 157/8465 | 4.20e-04 | 7.19e-03 | 5.20e-03 | 21 |
| Page: 1 2 |
Top |
Cell-cell communication analysis |
| Identification of potential cell-cell interactions between two cell types and their ligand-receptor pairs for different disease states |
| Ligand | Receptor | LRpair | Pathway | Tissue | Disease Stage |
| Page: 1 |
Top |
Single-cell gene regulatory network inference analysis |
| Find out the significant the regulons (TFs) and the target genes of each regulon across cell types for different disease states |
| TF | Cell Type | Tissue | Disease Stage | Target Gene | RSS | Regulon Activity |
| TEAD1 | MYOFIB | Cervix | ADJ | MAP3K20,MALAT1,PDE8B, etc. | 3.97e-01 |  |
| TEAD1 | STM | Colorectum | ADJ | EPB41L2,MET,MACC1, etc. | 7.53e-02 |  |
| TEAD1 | STM | Colorectum | FAP | EPB41L2,MET,MACC1, etc. | 1.97e-01 |  |
| TEAD1 | ASC | Colorectum | FAP | EPB41L2,MET,MACC1, etc. | 2.80e-01 | |
| TEAD1 | CT | Colorectum | MSI-H | ABCA13,PLEKHM3,CDH18, etc. | 3.07e-02 |  |
| TEAD1 | TUF | Colorectum | MSI-H | ABCA13,PLEKHM3,CDH18, etc. | 3.49e-02 | |
| TEAD1 | TUF | Colorectum | MSS | ABCA13,PLEKHM3,CDH18, etc. | 2.11e-02 |  |
| TEAD1 | INMON | Esophagus | ADJ | RP11-98D18.3,ZNF48,BDKRB2, etc. | 3.09e-02 |  |
| TEAD1 | INCAF | Esophagus | ESCC | GAS6,PCDH7,MYH10, etc. | 2.87e-01 |  |
| TEAD1 | MYOFIB | Esophagus | ESCC | GAS6,PCDH7,MYH10, etc. | 2.76e-01 | |
| ∗The dot plots of a searched regulon are shown for all cell subpopulations in each disease state of each tissue based on the regulon specific score inferred using pySCENIC and by calculating the average expression. |
| Page: 1 2 |
Top |
Somatic mutation of malignant transformation related genes |
| Annotation of somatic variants for genes involved in malignant transformation |
| Hugo Symbol | Variant Class | Variant Classification | dbSNP RS | HGVSc | HGVSp | HGVSp Short | SWISSPROT | BIOTYPE | SIFT | PolyPhen | Tumor Sample Barcode | Tissue | Histology | Sex | Age | Stage | Therapy Types | Drugs | Outcome |
| TEAD1 | SNV | Missense_Mutation | c.413N>T | p.Asn138Ile | p.N138I | protein_coding | tolerated(0.08) | benign(0.37) | TCGA-BH-A18G-01 | Breast | breast invasive carcinoma | Female | >=65 | I/II | Unknown | Unknown | SD | ||
| TEAD1 | SNV | Missense_Mutation | novel | c.605C>T | p.Ser202Leu | p.S202L | protein_coding | tolerated(0.15) | benign(0.087) | TCGA-OL-A66L-01 | Breast | breast invasive carcinoma | Female | >=65 | I/II | Unknown | Unknown | SD | |
| TEAD1 | deletion | Frame_Shift_Del | c.485delN | p.Thr163GlnfsTer111 | p.T163Qfs*111 | protein_coding | TCGA-A7-A26E-01 | Breast | breast invasive carcinoma | Female | >=65 | III/IV | Chemotherapy | cytoxan | SD | ||||
| TEAD1 | SNV | Missense_Mutation | c.307N>T | p.Arg103Cys | p.R103C | protein_coding | deleterious(0) | probably_damaging(0.999) | TCGA-C5-A1BL-01 | Cervix | cervical & endocervical cancer | Female | <65 | I/II | Unknown | Unknown | SD | ||
| TEAD1 | SNV | Missense_Mutation | novel | c.1033N>C | p.Glu345Gln | p.E345Q | protein_coding | deleterious(0) | possibly_damaging(0.738) | TCGA-HM-A4S6-01 | Cervix | cervical & endocervical cancer | Female | <65 | III/IV | Chemotherapy | cisplatin | CR | |
| TEAD1 | SNV | Missense_Mutation | c.795N>C | p.Lys265Asn | p.K265N | protein_coding | deleterious(0) | probably_damaging(1) | TCGA-AA-A010-01 | Colorectum | colon adenocarcinoma | Female | <65 | I/II | Chemotherapy | folinic | CR | ||
| TEAD1 | SNV | Missense_Mutation | c.370N>A | p.Ala124Thr | p.A124T | protein_coding | tolerated(0.5) | benign(0.003) | TCGA-AD-A5EJ-01 | Colorectum | colon adenocarcinoma | Female | >=65 | I/II | Unknown | Unknown | SD | ||
| TEAD1 | SNV | Missense_Mutation | rs867734243 | c.251N>T | p.Thr84Met | p.T84M | protein_coding | deleterious(0) | probably_damaging(1) | TCGA-AZ-6598-01 | Colorectum | colon adenocarcinoma | Female | >=65 | I/II | Unknown | Unknown | SD | |
| TEAD1 | SNV | Missense_Mutation | c.404N>T | p.Ala135Val | p.A135V | protein_coding | tolerated(0.54) | benign(0.366) | TCGA-F4-6856-01 | Colorectum | colon adenocarcinoma | Male | <65 | I/II | Ancillary | leucovorin | CR | ||
| TEAD1 | deletion | Frame_Shift_Del | c.916delT | p.Tyr306MetfsTer3 | p.Y306Mfs*3 | protein_coding | TCGA-AA-A02R-01 | Colorectum | colon adenocarcinoma | Female | >=65 | I/II | Unknown | Unknown | PD |
| Page: 1 2 3 4 |
Top |
Related drugs of malignant transformation related genes |
| Identification of chemicals and drugs interact with genes involved in malignant transfromation |
| (DGIdb 4.0) |
| Entrez ID | Symbol | Category | Interaction Types | Drug Claim Name | Drug Name | PMIDs |
| 7003 | TEAD1 | TRANSCRIPTION FACTOR, KINASE, TRANSCRIPTION FACTOR COMPLEX | DEXAMETHASONE | DEXAMETHASONE | 12207913 |
| Page: 1 |

Copyright 2023-Present -The University of Texas Health Science Center at Houston |