
|
|||||
|
 | |
| |
| |
| |
| |
| |
|
Gene: TDP2 |
Gene summary for TDP2 |
| Gene information | Species | Human | Gene symbol | TDP2 | Gene ID | 51567 |
| Gene name | tyrosyl-DNA phosphodiesterase 2 | |
| Gene Alias | AD022 | |
| Cytomap | 6p22.3 | |
| Gene Type | protein-coding | GO ID | GO:0006139 | UniProtAcc | O95551 |
Top |
Malignant transformation analysis |
| Identification of the aberrant gene expression in precancerous and cancerous lesions by comparing the gene expression of stem-like cells in diseased tissues with normal stem cells |
| Entrez ID | Symbol | Replicates | Species | Organ | Tissue | Adj P-value | Log2FC | Malignancy |
| 51567 | TDP2 | LZE4T | Human | Esophagus | ESCC | 7.15e-24 | 8.84e-01 | 0.0811 |
| 51567 | TDP2 | LZE5T | Human | Esophagus | ESCC | 1.04e-05 | 2.58e-01 | 0.0514 |
| 51567 | TDP2 | LZE7T | Human | Esophagus | ESCC | 1.04e-07 | 5.15e-01 | 0.0667 |
| 51567 | TDP2 | LZE20T | Human | Esophagus | ESCC | 3.14e-07 | 1.77e-01 | 0.0662 |
| 51567 | TDP2 | LZE22T | Human | Esophagus | ESCC | 1.81e-05 | 4.57e-01 | 0.068 |
| 51567 | TDP2 | LZE24T | Human | Esophagus | ESCC | 1.60e-17 | 4.57e-01 | 0.0596 |
| 51567 | TDP2 | LZE21T | Human | Esophagus | ESCC | 1.59e-03 | 2.17e-01 | 0.0655 |
| 51567 | TDP2 | P1T-E | Human | Esophagus | ESCC | 1.17e-03 | 2.43e-01 | 0.0875 |
| 51567 | TDP2 | P2T-E | Human | Esophagus | ESCC | 4.20e-21 | 2.89e-01 | 0.1177 |
| 51567 | TDP2 | P4T-E | Human | Esophagus | ESCC | 5.86e-26 | 5.91e-01 | 0.1323 |
| 51567 | TDP2 | P5T-E | Human | Esophagus | ESCC | 1.33e-08 | 2.88e-02 | 0.1327 |
| 51567 | TDP2 | P8T-E | Human | Esophagus | ESCC | 1.15e-18 | 3.20e-01 | 0.0889 |
| 51567 | TDP2 | P9T-E | Human | Esophagus | ESCC | 5.69e-24 | 6.16e-01 | 0.1131 |
| 51567 | TDP2 | P10T-E | Human | Esophagus | ESCC | 2.49e-22 | 2.54e-01 | 0.116 |
| 51567 | TDP2 | P11T-E | Human | Esophagus | ESCC | 1.53e-08 | 3.86e-01 | 0.1426 |
| 51567 | TDP2 | P12T-E | Human | Esophagus | ESCC | 6.40e-20 | 3.44e-01 | 0.1122 |
| 51567 | TDP2 | P15T-E | Human | Esophagus | ESCC | 4.18e-13 | 2.81e-01 | 0.1149 |
| 51567 | TDP2 | P16T-E | Human | Esophagus | ESCC | 4.47e-16 | 1.97e-01 | 0.1153 |
| 51567 | TDP2 | P17T-E | Human | Esophagus | ESCC | 2.38e-03 | 2.25e-01 | 0.1278 |
| 51567 | TDP2 | P19T-E | Human | Esophagus | ESCC | 4.60e-05 | 4.41e-01 | 0.1662 |
| Page: 1 2 3 4 5 |
| Tissue | Expression Dynamics | Abbreviation |
| Esophagus |  | ESCC: Esophageal squamous cell carcinoma |
| HGIN: High-grade intraepithelial neoplasias | ||
| LGIN: Low-grade intraepithelial neoplasias | ||
| Liver | 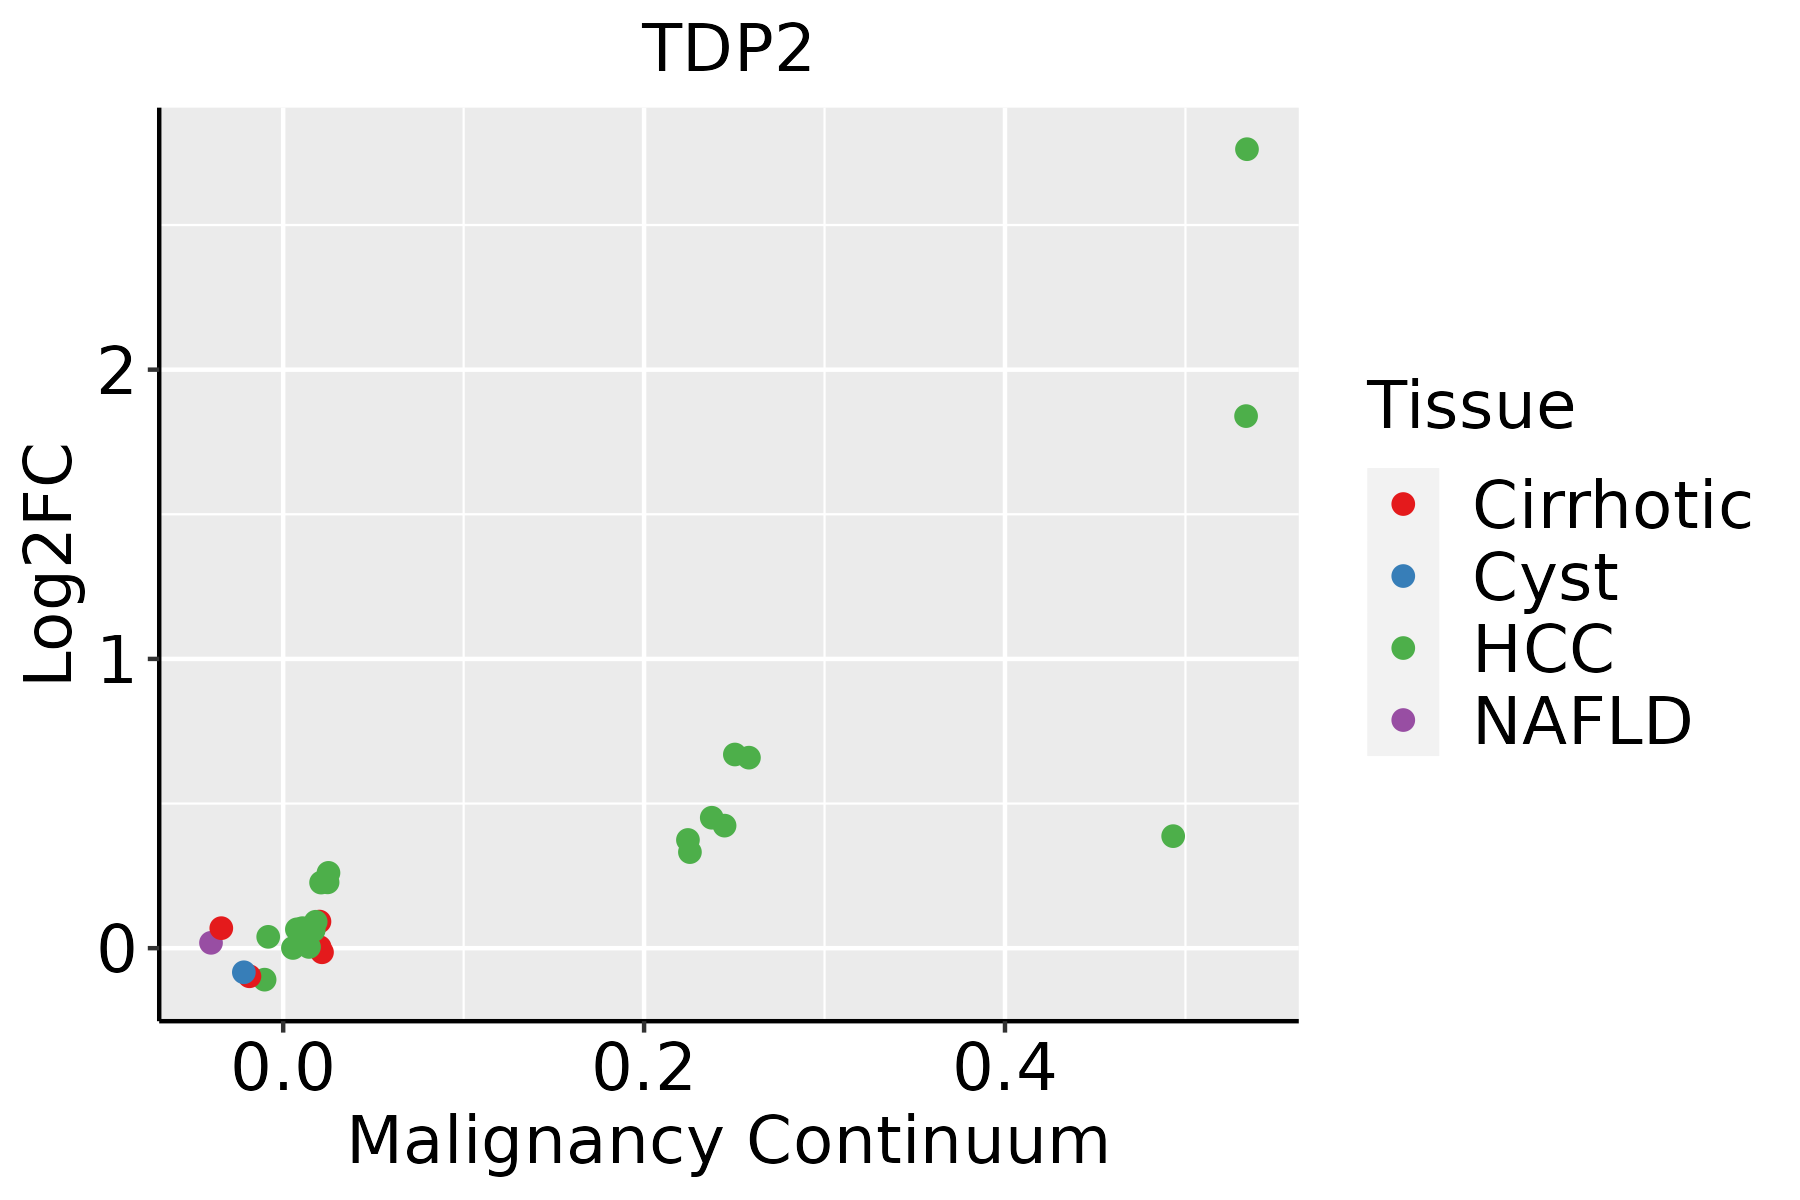 | HCC: Hepatocellular carcinoma |
| NAFLD: Non-alcoholic fatty liver disease | ||
| Oral Cavity | 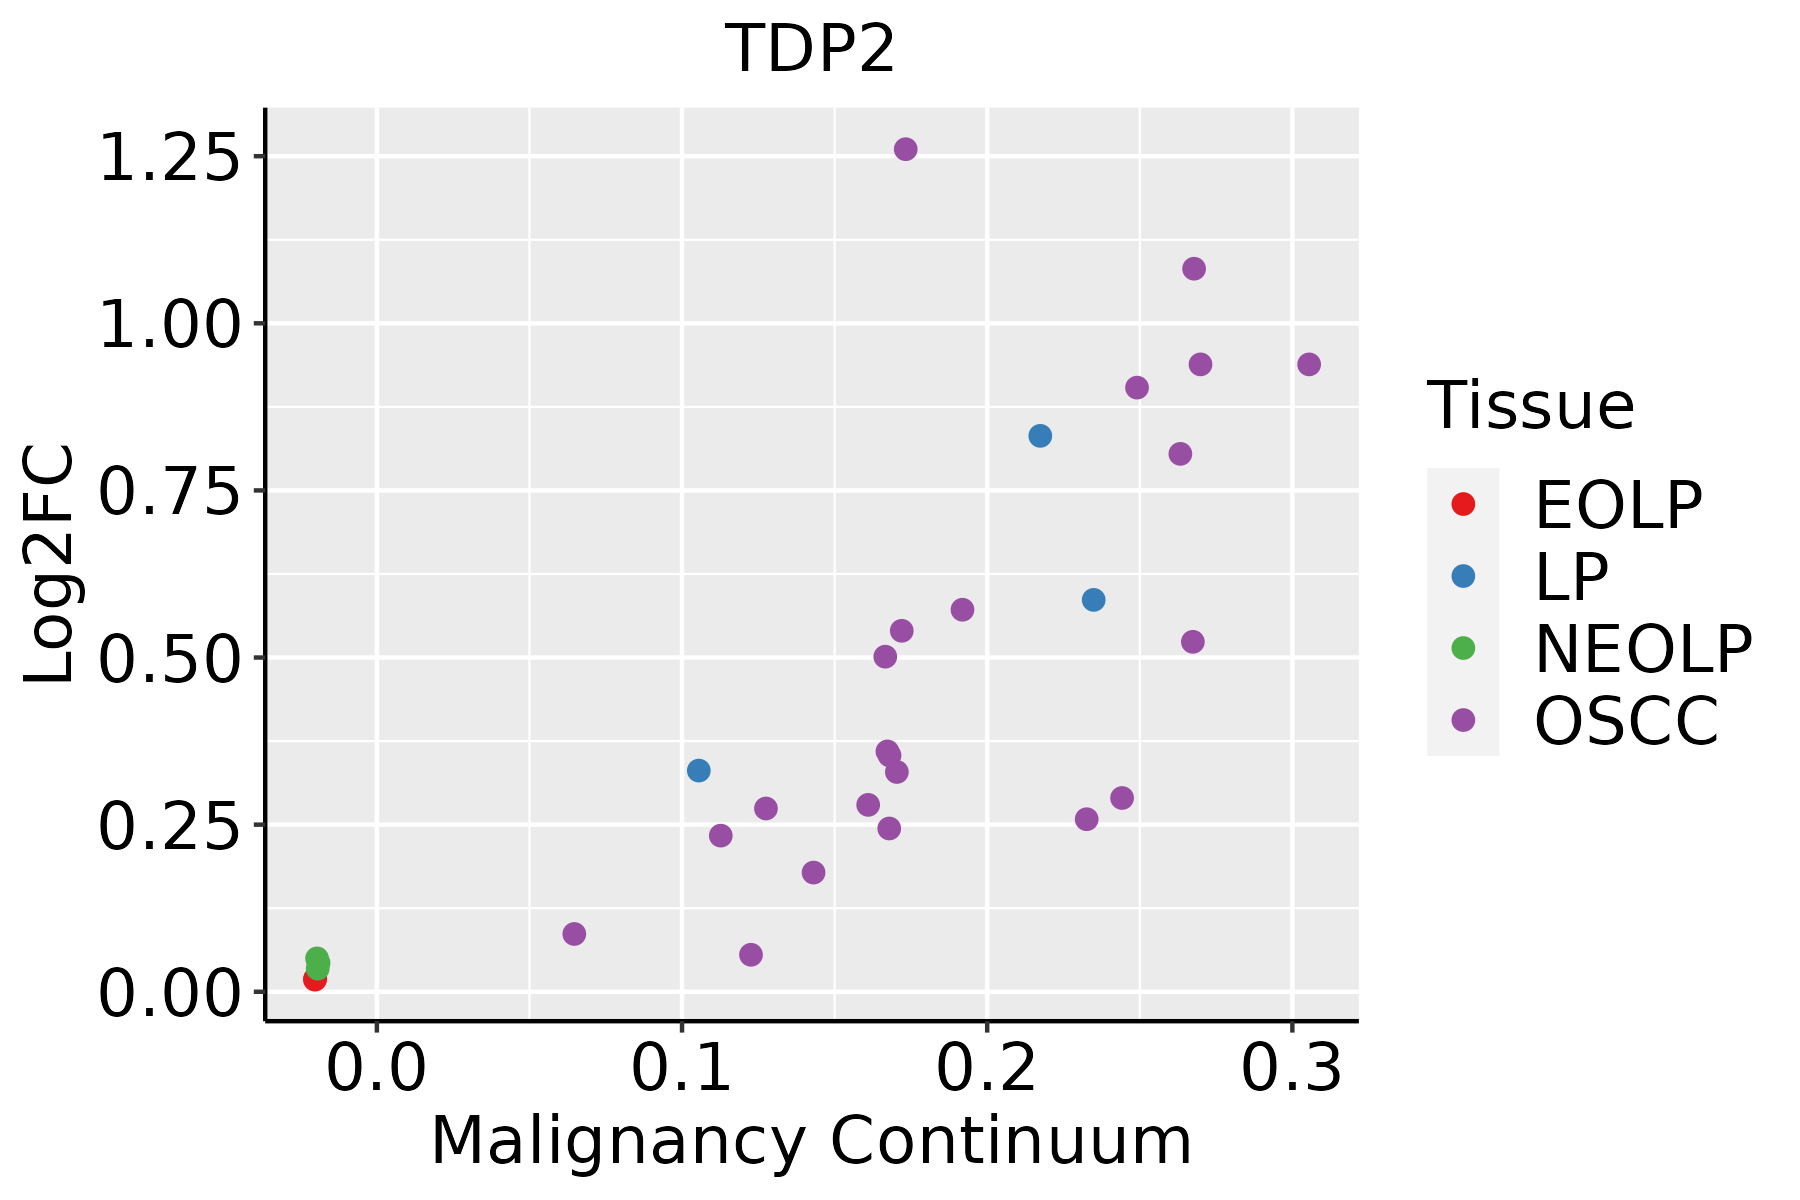 | EOLP: Erosive Oral lichen planus |
| LP: leukoplakia | ||
| NEOLP: Non-erosive oral lichen planus | ||
| OSCC: Oral squamous cell carcinoma | ||
| Skin | 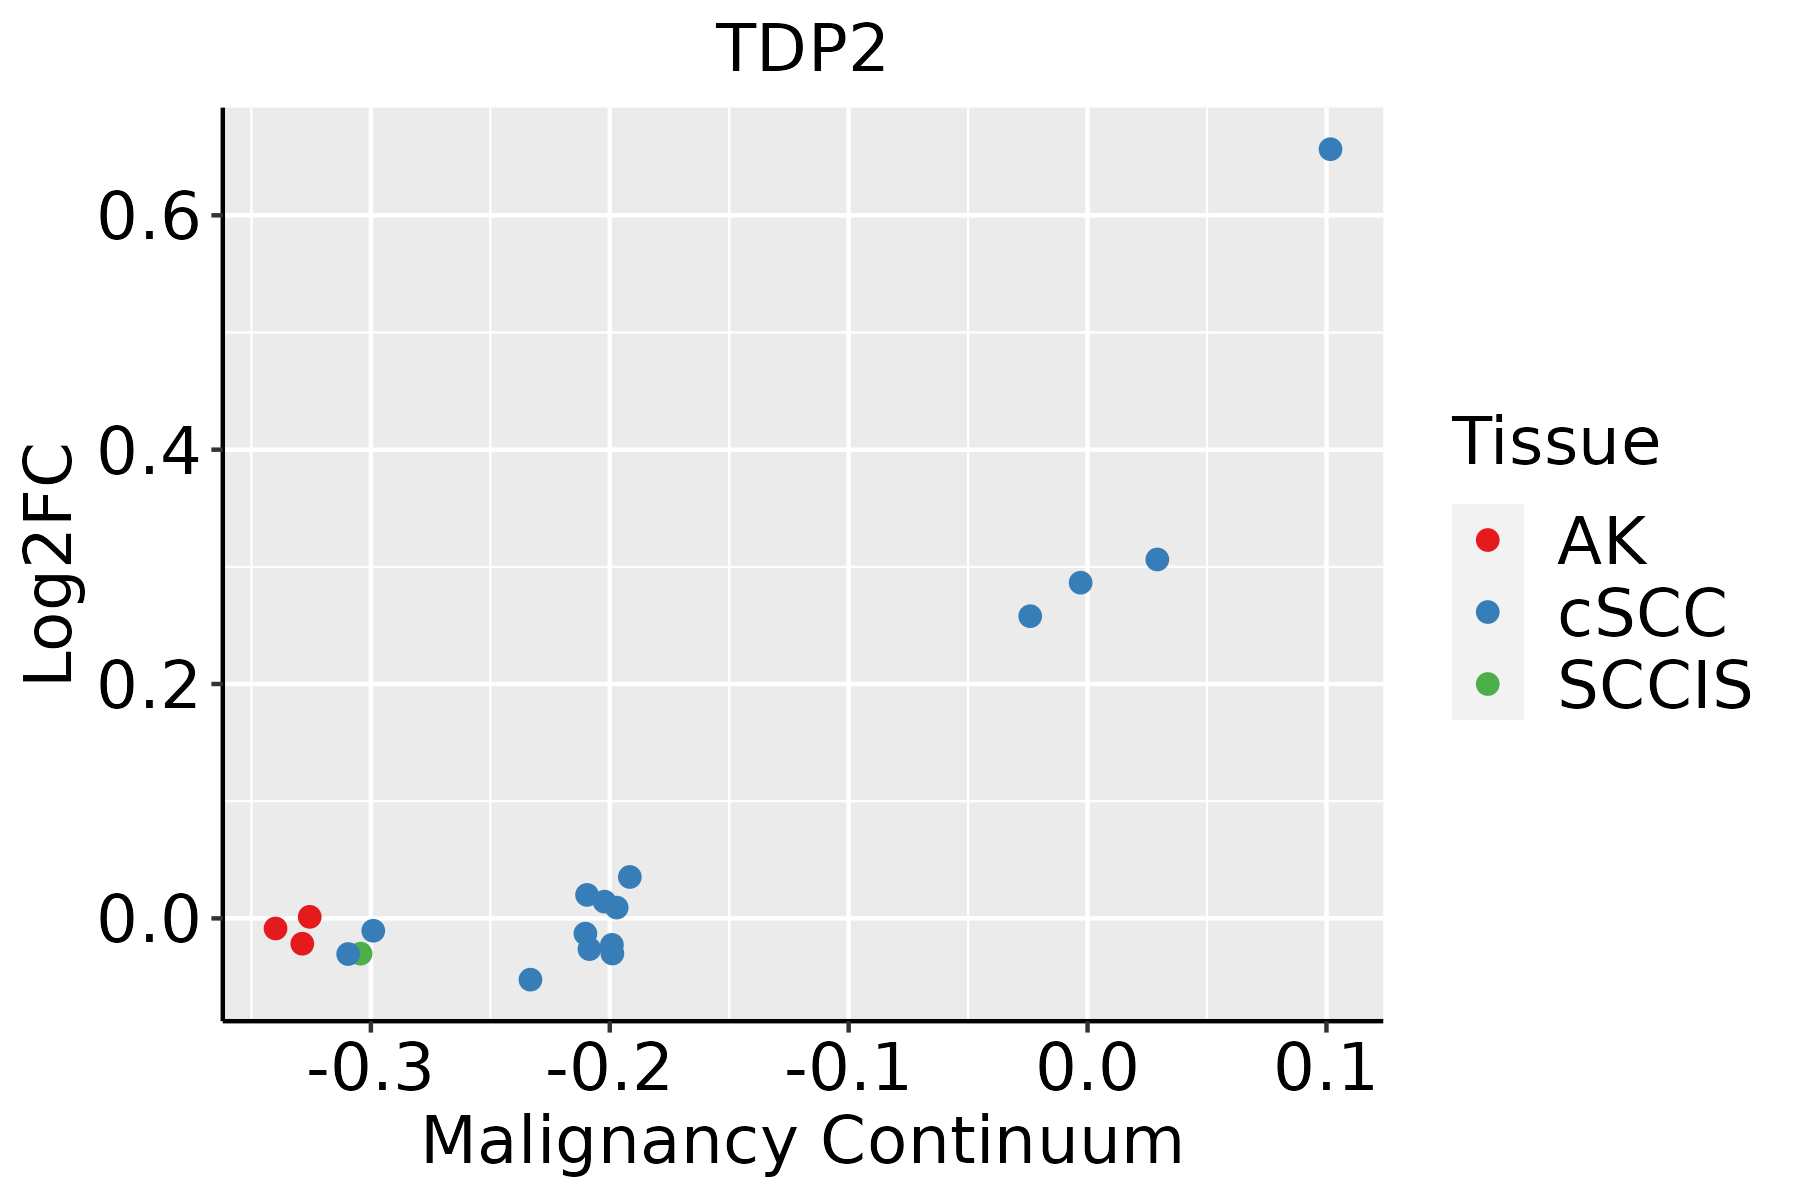 | AK: Actinic keratosis |
| cSCC: Cutaneous squamous cell carcinoma | ||
| SCCIS:squamous cell carcinoma in situ |
| ∗log2FC in expression of this searched gene in stem-like cells from each diseased tissue sample relative to stem-like cells in normal samples in each tissue plotted against the malignancy continuum. Samples are colored based on if they are from different disease stage. |
Top |
Malignant transformation related pathway analysis |
| Find out the enriched GO biological processes and KEGG pathways involved in transition from healthy to precancer to cancer |
| Tissue | Disease Stage | Enriched GO biological Processes |
| Colorectum | AD |  |
| Colorectum | SER |  |
| Colorectum | MSS |  |
| Colorectum | MSI-H |  |
| Colorectum | FAP |  |
| ∗Top 15 enriched GO BP terms are showed in the bar plot of each disease state in each tissue. Each row represents a significant GO biological process which is colored according to the -log10(p.adjust). |
| Page: 1 2 3 4 5 6 7 8 9 |
| GO ID | Tissue | Disease Stage | Description | Gene Ratio | Bg Ratio | pvalue | p.adjust | Count |
| GO:00903053 | Esophagus | ESCC | nucleic acid phosphodiester bond hydrolysis | 163/8552 | 261/18723 | 3.07e-08 | 5.73e-07 | 163 |
| GO:00063024 | Esophagus | ESCC | double-strand break repair | 152/8552 | 251/18723 | 1.33e-06 | 1.62e-05 | 152 |
| GO:0090305 | Liver | HCC | nucleic acid phosphodiester bond hydrolysis | 152/7958 | 261/18723 | 1.90e-07 | 3.46e-06 | 152 |
| GO:00063021 | Liver | HCC | double-strand break repair | 131/7958 | 251/18723 | 1.17e-03 | 6.54e-03 | 131 |
| GO:00903052 | Oral cavity | OSCC | nucleic acid phosphodiester bond hydrolysis | 142/7305 | 261/18723 | 2.90e-07 | 4.43e-06 | 142 |
| GO:00063023 | Oral cavity | OSCC | double-strand break repair | 132/7305 | 251/18723 | 7.93e-06 | 8.52e-05 | 132 |
| GO:00903051 | Oral cavity | LP | nucleic acid phosphodiester bond hydrolysis | 92/4623 | 261/18723 | 8.07e-05 | 1.04e-03 | 92 |
| GO:000630211 | Oral cavity | LP | double-strand break repair | 80/4623 | 251/18723 | 5.81e-03 | 3.46e-02 | 80 |
| GO:00903054 | Skin | cSCC | nucleic acid phosphodiester bond hydrolysis | 97/4864 | 261/18723 | 4.08e-05 | 4.34e-04 | 97 |
| GO:00063025 | Skin | cSCC | double-strand break repair | 89/4864 | 251/18723 | 5.23e-04 | 3.92e-03 | 89 |
| Page: 1 |
| Pathway ID | Tissue | Disease Stage | Description | Gene Ratio | Bg Ratio | pvalue | p.adjust | qvalue | Count |
| Page: 1 |
Top |
Cell-cell communication analysis |
| Identification of potential cell-cell interactions between two cell types and their ligand-receptor pairs for different disease states |
| Ligand | Receptor | LRpair | Pathway | Tissue | Disease Stage |
| Page: 1 |
Top |
Single-cell gene regulatory network inference analysis |
| Find out the significant the regulons (TFs) and the target genes of each regulon across cell types for different disease states |
| TF | Cell Type | Tissue | Disease Stage | Target Gene | RSS | Regulon Activity |
| ∗The dot plots of a searched regulon are shown for all cell subpopulations in each disease state of each tissue based on the regulon specific score inferred using pySCENIC and by calculating the average expression. |
| Page: 1 |
Top |
Somatic mutation of malignant transformation related genes |
| Annotation of somatic variants for genes involved in malignant transformation |
| Hugo Symbol | Variant Class | Variant Classification | dbSNP RS | HGVSc | HGVSp | HGVSp Short | SWISSPROT | BIOTYPE | SIFT | PolyPhen | Tumor Sample Barcode | Tissue | Histology | Sex | Age | Stage | Therapy Types | Drugs | Outcome |
| TDP2 | SNV | Missense_Mutation | c.655N>C | p.Glu219Gln | p.E219Q | O95551 | protein_coding | tolerated(0.05) | benign(0.439) | TCGA-C5-A8YQ-01 | Cervix | cervical & endocervical cancer | Female | >=65 | I/II | Chemotherapy | cisplatin | PD | |
| TDP2 | SNV | Missense_Mutation | c.272A>C | p.Glu91Ala | p.E91A | O95551 | protein_coding | tolerated(0.55) | benign(0.007) | TCGA-AA-A00N-01 | Colorectum | colon adenocarcinoma | Male | >=65 | I/II | Unknown | Unknown | PD | |
| TDP2 | SNV | Missense_Mutation | c.710N>A | p.Arg237Gln | p.R237Q | O95551 | protein_coding | deleterious(0.03) | probably_damaging(1) | TCGA-CK-4951-01 | Colorectum | colon adenocarcinoma | Female | >=65 | I/II | Unknown | Unknown | PD | |
| TDP2 | SNV | Missense_Mutation | novel | c.995G>A | p.Arg332Gln | p.R332Q | O95551 | protein_coding | tolerated(1) | benign(0.007) | TCGA-F5-6814-01 | Colorectum | rectum adenocarcinoma | Male | <65 | I/II | Unknown | Unknown | SD |
| TDP2 | SNV | Missense_Mutation | novel | c.491G>T | p.Arg164Ile | p.R164I | O95551 | protein_coding | deleterious(0.04) | benign(0.392) | TCGA-F5-6814-01 | Colorectum | rectum adenocarcinoma | Male | <65 | I/II | Unknown | Unknown | SD |
| TDP2 | SNV | Missense_Mutation | c.85T>A | p.Cys29Ser | p.C29S | O95551 | protein_coding | deleterious(0.02) | benign(0.197) | TCGA-G5-6641-01 | Colorectum | rectum adenocarcinoma | Male | >=65 | III/IV | Chemotherapy | oxaliplatin | SD | |
| TDP2 | deletion | Frame_Shift_Del | c.71delN | p.Lys24SerfsTer35 | p.K24Sfs*35 | O95551 | protein_coding | TCGA-AA-A01P-01 | Colorectum | colon adenocarcinoma | Female | >=65 | III/IV | Unknown | Unknown | PD | |||
| TDP2 | SNV | Missense_Mutation | c.710N>T | p.Arg237Leu | p.R237L | O95551 | protein_coding | deleterious(0) | probably_damaging(1) | TCGA-A5-A2K5-01 | Endometrium | uterine corpus endometrioid carcinoma | Female | >=65 | I/II | Unknown | Unknown | SD | |
| TDP2 | SNV | Missense_Mutation | c.796A>G | p.Arg266Gly | p.R266G | O95551 | protein_coding | deleterious(0) | probably_damaging(0.925) | TCGA-AP-A054-01 | Endometrium | uterine corpus endometrioid carcinoma | Female | <65 | III/IV | Chemotherapy | carboplatin | PD | |
| TDP2 | SNV | Missense_Mutation | rs745911675 | c.940N>T | p.Arg314Cys | p.R314C | O95551 | protein_coding | deleterious(0) | probably_damaging(1) | TCGA-AP-A0LM-01 | Endometrium | uterine corpus endometrioid carcinoma | Female | <65 | III/IV | Chemotherapy | cisplatin | SD |
| Page: 1 2 3 4 |
Top |
Related drugs of malignant transformation related genes |
| Identification of chemicals and drugs interact with genes involved in malignant transfromation |
| (DGIdb 4.0) |
| Entrez ID | Symbol | Category | Interaction Types | Drug Claim Name | Drug Name | PMIDs |
| 51567 | TDP2 | ENZYME, TRANSCRIPTION FACTOR, DRUGGABLE GENOME | 9,10-PHENANTHRENEQUINONE | 9,10-PHENANTHRENEQUINONE | ||
| 51567 | TDP2 | ENZYME, TRANSCRIPTION FACTOR, DRUGGABLE GENOME | GNF-PF-4418 | CHEMBL604321 | ||
| 51567 | TDP2 | ENZYME, TRANSCRIPTION FACTOR, DRUGGABLE GENOME | (-)-DICENTRINE | CHEMBL478754 |
| Page: 1 |

Copyright 2023-Present -The University of Texas Health Science Center at Houston |