
|
|||||
|
 | |
| |
| |
| |
| |
| |
|
Gene: TDO2 |
Gene summary for TDO2 |
| Gene information | Species | Human | Gene symbol | TDO2 | Gene ID | 6999 |
| Gene name | tryptophan 2,3-dioxygenase | |
| Gene Alias | HYPTRP | |
| Cytomap | 4q32.1 | |
| Gene Type | protein-coding | GO ID | GO:0006082 | UniProtAcc | P48775 |
Top |
Malignant transformation analysis |
| Identification of the aberrant gene expression in precancerous and cancerous lesions by comparing the gene expression of stem-like cells in diseased tissues with normal stem cells |
| Entrez ID | Symbol | Replicates | Species | Organ | Tissue | Adj P-value | Log2FC | Malignancy |
| 6999 | TDO2 | NAFLD1 | Human | Liver | NAFLD | 3.55e-13 | 1.27e+00 | -0.04 |
| 6999 | TDO2 | S43 | Human | Liver | Cirrhotic | 8.17e-05 | -8.10e-02 | -0.0187 |
| 6999 | TDO2 | HCC1_Meng | Human | Liver | HCC | 7.01e-81 | 2.53e-01 | 0.0246 |
| 6999 | TDO2 | HCC2_Meng | Human | Liver | HCC | 4.58e-11 | -3.58e-01 | 0.0107 |
| 6999 | TDO2 | cirrhotic1 | Human | Liver | Cirrhotic | 9.12e-04 | -2.70e-01 | 0.0202 |
| 6999 | TDO2 | cirrhotic2 | Human | Liver | Cirrhotic | 1.69e-07 | -2.70e-01 | 0.0201 |
| 6999 | TDO2 | HCC2 | Human | Liver | HCC | 1.20e-27 | 4.78e+00 | 0.5341 |
| 6999 | TDO2 | Pt13.a | Human | Liver | HCC | 3.39e-08 | 1.75e-02 | 0.021 |
| 6999 | TDO2 | Pt13.b | Human | Liver | HCC | 3.26e-16 | 2.47e-02 | 0.0251 |
| 6999 | TDO2 | Pt14.d | Human | Liver | HCC | 6.48e-10 | -3.48e-01 | 0.0143 |
| 6999 | TDO2 | S016 | Human | Liver | HCC | 5.25e-03 | -3.54e-01 | 0.2243 |
| Page: 1 |
| Tissue | Expression Dynamics | Abbreviation |
| Liver | 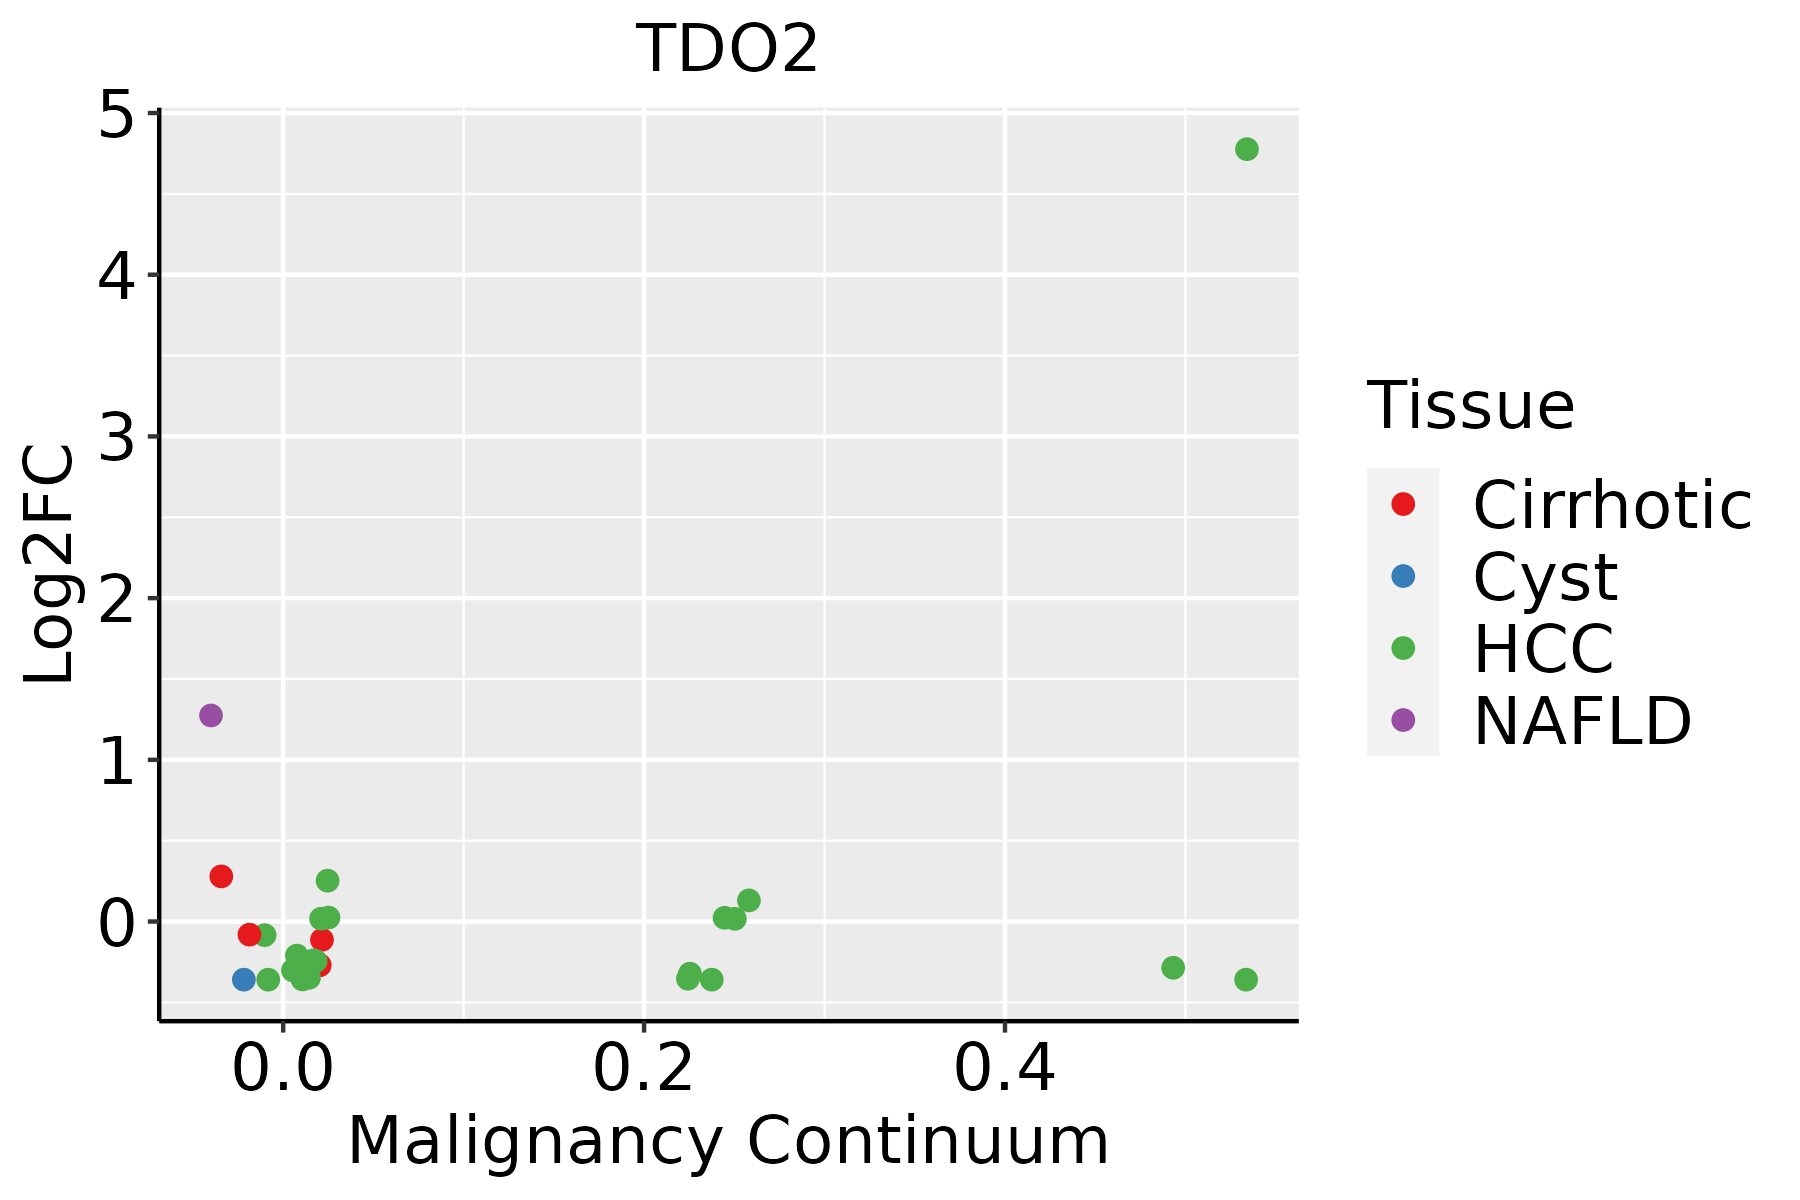 | HCC: Hepatocellular carcinoma |
| NAFLD: Non-alcoholic fatty liver disease |
| ∗log2FC in expression of this searched gene in stem-like cells from each diseased tissue sample relative to stem-like cells in normal samples in each tissue plotted against the malignancy continuum. Samples are colored based on if they are from different disease stage. |
Top |
Malignant transformation related pathway analysis |
| Find out the enriched GO biological processes and KEGG pathways involved in transition from healthy to precancer to cancer |
| Tissue | Disease Stage | Enriched GO biological Processes |
| Colorectum | AD |  |
| Colorectum | SER |  |
| Colorectum | MSS |  |
| Colorectum | MSI-H |  |
| Colorectum | FAP |  |
| ∗Top 15 enriched GO BP terms are showed in the bar plot of each disease state in each tissue. Each row represents a significant GO biological process which is colored according to the -log10(p.adjust). |
| Page: 1 2 3 4 5 6 7 8 9 |
| GO ID | Tissue | Disease Stage | Description | Gene Ratio | Bg Ratio | pvalue | p.adjust | Count |
| GO:00463953 | Liver | NAFLD | carboxylic acid catabolic process | 73/1882 | 236/18723 | 4.16e-19 | 1.22e-15 | 73 |
| GO:00160544 | Liver | NAFLD | organic acid catabolic process | 73/1882 | 240/18723 | 1.20e-18 | 2.34e-15 | 73 |
| GO:00442825 | Liver | NAFLD | small molecule catabolic process | 91/1882 | 376/18723 | 8.96e-16 | 1.31e-12 | 91 |
| GO:00194396 | Liver | NAFLD | aromatic compound catabolic process | 102/1882 | 467/18723 | 2.29e-14 | 1.91e-11 | 102 |
| GO:19013616 | Liver | NAFLD | organic cyclic compound catabolic process | 105/1882 | 495/18723 | 7.04e-14 | 5.15e-11 | 105 |
| GO:00442707 | Liver | NAFLD | cellular nitrogen compound catabolic process | 93/1882 | 451/18723 | 1.04e-11 | 4.34e-09 | 93 |
| GO:00467006 | Liver | NAFLD | heterocycle catabolic process | 92/1882 | 445/18723 | 1.16e-11 | 4.52e-09 | 92 |
| GO:0009063 | Liver | NAFLD | cellular amino acid catabolic process | 36/1882 | 110/18723 | 6.56e-11 | 1.99e-08 | 36 |
| GO:00065203 | Liver | NAFLD | cellular amino acid metabolic process | 63/1882 | 284/18723 | 1.14e-09 | 2.17e-07 | 63 |
| GO:19016053 | Liver | NAFLD | alpha-amino acid metabolic process | 46/1882 | 195/18723 | 2.74e-08 | 2.86e-06 | 46 |
| GO:00092596 | Liver | NAFLD | ribonucleotide metabolic process | 72/1882 | 385/18723 | 1.51e-07 | 1.09e-05 | 72 |
| GO:00196936 | Liver | NAFLD | ribose phosphate metabolic process | 73/1882 | 396/18723 | 2.23e-07 | 1.53e-05 | 73 |
| GO:00091177 | Liver | NAFLD | nucleotide metabolic process | 85/1882 | 489/18723 | 3.31e-07 | 2.18e-05 | 85 |
| GO:00067537 | Liver | NAFLD | nucleoside phosphate metabolic process | 85/1882 | 497/18723 | 6.69e-07 | 3.83e-05 | 85 |
| GO:00725217 | Liver | NAFLD | purine-containing compound metabolic process | 74/1882 | 416/18723 | 7.73e-07 | 4.27e-05 | 74 |
| GO:1901606 | Liver | NAFLD | alpha-amino acid catabolic process | 25/1882 | 87/18723 | 8.67e-07 | 4.60e-05 | 25 |
| GO:00091507 | Liver | NAFLD | purine ribonucleotide metabolic process | 67/1882 | 368/18723 | 1.10e-06 | 5.44e-05 | 67 |
| GO:00061637 | Liver | NAFLD | purine nucleotide metabolic process | 70/1882 | 396/18723 | 1.93e-06 | 8.23e-05 | 70 |
| GO:00067904 | Liver | NAFLD | sulfur compound metabolic process | 58/1882 | 339/18723 | 3.79e-05 | 9.38e-04 | 58 |
| GO:00338653 | Liver | NAFLD | nucleoside bisphosphate metabolic process | 28/1882 | 128/18723 | 5.89e-05 | 1.30e-03 | 28 |
| Page: 1 2 3 4 5 |
| Pathway ID | Tissue | Disease Stage | Description | Gene Ratio | Bg Ratio | pvalue | p.adjust | qvalue | Count |
| hsa01240 | Liver | Cirrhotic | Biosynthesis of cofactors | 66/2530 | 153/8465 | 3.11e-04 | 1.99e-03 | 1.23e-03 | 66 |
| hsa003802 | Liver | Cirrhotic | Tryptophan metabolism | 22/2530 | 42/8465 | 1.85e-03 | 8.37e-03 | 5.16e-03 | 22 |
| hsa012401 | Liver | Cirrhotic | Biosynthesis of cofactors | 66/2530 | 153/8465 | 3.11e-04 | 1.99e-03 | 1.23e-03 | 66 |
| hsa0038011 | Liver | Cirrhotic | Tryptophan metabolism | 22/2530 | 42/8465 | 1.85e-03 | 8.37e-03 | 5.16e-03 | 22 |
| hsa012402 | Liver | HCC | Biosynthesis of cofactors | 103/4020 | 153/8465 | 4.67e-07 | 5.05e-06 | 2.81e-06 | 103 |
| hsa012403 | Liver | HCC | Biosynthesis of cofactors | 103/4020 | 153/8465 | 4.67e-07 | 5.05e-06 | 2.81e-06 | 103 |
| Page: 1 |
Top |
Cell-cell communication analysis |
| Identification of potential cell-cell interactions between two cell types and their ligand-receptor pairs for different disease states |
| Ligand | Receptor | LRpair | Pathway | Tissue | Disease Stage |
| Page: 1 |
Top |
Single-cell gene regulatory network inference analysis |
| Find out the significant the regulons (TFs) and the target genes of each regulon across cell types for different disease states |
| TF | Cell Type | Tissue | Disease Stage | Target Gene | RSS | Regulon Activity |
| ∗The dot plots of a searched regulon are shown for all cell subpopulations in each disease state of each tissue based on the regulon specific score inferred using pySCENIC and by calculating the average expression. |
| Page: 1 |
Top |
Somatic mutation of malignant transformation related genes |
| Annotation of somatic variants for genes involved in malignant transformation |
| Hugo Symbol | Variant Class | Variant Classification | dbSNP RS | HGVSc | HGVSp | HGVSp Short | SWISSPROT | BIOTYPE | SIFT | PolyPhen | Tumor Sample Barcode | Tissue | Histology | Sex | Age | Stage | Therapy Types | Drugs | Outcome |
| TDO2 | SNV | Missense_Mutation | c.73N>C | p.Glu25Gln | p.E25Q | P48775 | protein_coding | tolerated(0.17) | benign(0.203) | TCGA-B6-A0RS-01 | Breast | breast invasive carcinoma | Female | <65 | I/II | Unknown | Unknown | PD | |
| TDO2 | SNV | Missense_Mutation | novel | c.76G>C | p.Asp26His | p.D26H | P48775 | protein_coding | deleterious(0.02) | probably_damaging(0.979) | TCGA-BH-A2L8-01 | Breast | breast invasive carcinoma | Female | <65 | I/II | Chemotherapy | cytoxan | CR |
| TDO2 | SNV | Missense_Mutation | novel | c.88N>G | p.Thr30Ala | p.T30A | P48775 | protein_coding | tolerated(0.75) | benign(0) | TCGA-E9-A1NA-01 | Breast | breast invasive carcinoma | Female | <65 | I/II | Chemotherapy | cyclophosphamide | SD |
| TDO2 | SNV | Missense_Mutation | c.1093T>G | p.Leu365Val | p.L365V | P48775 | protein_coding | deleterious(0) | probably_damaging(0.996) | TCGA-AA-3510-01 | Colorectum | colon adenocarcinoma | Male | >=65 | I/II | Unknown | Unknown | SD | |
| TDO2 | SNV | Missense_Mutation | c.810N>T | p.Glu270Asp | p.E270D | P48775 | protein_coding | tolerated(0.18) | benign(0.038) | TCGA-AA-A010-01 | Colorectum | colon adenocarcinoma | Female | <65 | I/II | Chemotherapy | folinic | CR | |
| TDO2 | SNV | Missense_Mutation | c.161N>T | p.Ala54Val | p.A54V | P48775 | protein_coding | deleterious(0.01) | possibly_damaging(0.622) | TCGA-AA-A022-01 | Colorectum | colon adenocarcinoma | Female | >=65 | I/II | Unknown | Unknown | SD | |
| TDO2 | SNV | Missense_Mutation | c.513G>A | p.Met171Ile | p.M171I | P48775 | protein_coding | tolerated(0.48) | benign(0) | TCGA-AD-6889-01 | Colorectum | colon adenocarcinoma | Male | >=65 | I/II | Chemotherapy | xeloda | PD | |
| TDO2 | SNV | Missense_Mutation | novel | c.211N>A | p.Leu71Ile | p.L71I | P48775 | protein_coding | deleterious(0) | probably_damaging(0.999) | TCGA-AZ-4315-01 | Colorectum | colon adenocarcinoma | Male | <65 | I/II | Unknown | Unknown | SD |
| TDO2 | SNV | Missense_Mutation | c.81A>T | p.Lys27Asn | p.K27N | P48775 | protein_coding | tolerated(0.41) | benign(0) | TCGA-CA-6718-01 | Colorectum | colon adenocarcinoma | Male | <65 | I/II | Unknown | Unknown | PD | |
| TDO2 | SNV | Missense_Mutation | novel | c.770T>C | p.Phe257Ser | p.F257S | P48775 | protein_coding | tolerated(0.22) | benign(0.106) | TCGA-CA-6718-01 | Colorectum | colon adenocarcinoma | Male | <65 | I/II | Unknown | Unknown | PD |
| Page: 1 2 3 4 5 6 |
Top |
Related drugs of malignant transformation related genes |
| Identification of chemicals and drugs interact with genes involved in malignant transfromation |
| (DGIdb 4.0) |
| Entrez ID | Symbol | Category | Interaction Types | Drug Claim Name | Drug Name | PMIDs |
| 6999 | TDO2 | ENZYME, DRUGGABLE GENOME | DEXAMETHASONE | DEXAMETHASONE | 6136271 | |
| 6999 | TDO2 | ENZYME, DRUGGABLE GENOME | inhibitor | 315661101 | ||
| 6999 | TDO2 | ENZYME, DRUGGABLE GENOME | 2,3-diamino-benzo[b]thiophene derivative 4 | |||
| 6999 | TDO2 | ENZYME, DRUGGABLE GENOME | PMID29473428-Compound-76 | |||
| 6999 | TDO2 | ENZYME, DRUGGABLE GENOME | TCDD | 7716779 | ||
| 6999 | TDO2 | ENZYME, DRUGGABLE GENOME | HYDROGEN PEROXIDE | 17212352 | ||
| 6999 | TDO2 | ENZYME, DRUGGABLE GENOME | 2,3-diamino-benzo[b]thiophene derivative 2 | |||
| 6999 | TDO2 | ENZYME, DRUGGABLE GENOME | PMID27172114-Compound-30 | |||
| 6999 | TDO2 | ENZYME, DRUGGABLE GENOME | 2,3-diamino-benzo[b]thiophene derivative 5 | |||
| 6999 | TDO2 | ENZYME, DRUGGABLE GENOME | Indazole derivative 3 |
| Page: 1 2 |

Copyright 2023-Present -The University of Texas Health Science Center at Houston |