
|
|||||
|
 | |
| |
| |
| |
| |
| |
|
Gene: TDG |
Gene summary for TDG |
| Gene information | Species | Human | Gene symbol | TDG | Gene ID | 6996 |
| Gene name | thymine DNA glycosylase | |
| Gene Alias | hTDG | |
| Cytomap | 12q23.3 | |
| Gene Type | protein-coding | GO ID | GO:0000122 | UniProtAcc | B4E127 |
Top |
Malignant transformation analysis |
| Identification of the aberrant gene expression in precancerous and cancerous lesions by comparing the gene expression of stem-like cells in diseased tissues with normal stem cells |
| Entrez ID | Symbol | Replicates | Species | Organ | Tissue | Adj P-value | Log2FC | Malignancy |
| 6996 | TDG | LZE4T | Human | Esophagus | ESCC | 1.09e-11 | 2.89e-01 | 0.0811 |
| 6996 | TDG | LZE7T | Human | Esophagus | ESCC | 1.02e-09 | 8.92e-01 | 0.0667 |
| 6996 | TDG | LZE8T | Human | Esophagus | ESCC | 3.36e-09 | 2.34e-01 | 0.067 |
| 6996 | TDG | LZE20T | Human | Esophagus | ESCC | 4.97e-07 | 9.51e-03 | 0.0662 |
| 6996 | TDG | LZE21D1 | Human | Esophagus | HGIN | 1.50e-02 | 1.21e-01 | 0.0632 |
| 6996 | TDG | LZE22T | Human | Esophagus | ESCC | 8.95e-10 | 5.07e-01 | 0.068 |
| 6996 | TDG | LZE24T | Human | Esophagus | ESCC | 2.54e-15 | 5.04e-01 | 0.0596 |
| 6996 | TDG | LZE21T | Human | Esophagus | ESCC | 8.07e-05 | 4.12e-01 | 0.0655 |
| 6996 | TDG | P1T-E | Human | Esophagus | ESCC | 7.31e-11 | 6.89e-01 | 0.0875 |
| 6996 | TDG | P2T-E | Human | Esophagus | ESCC | 4.64e-57 | 1.06e+00 | 0.1177 |
| 6996 | TDG | P4T-E | Human | Esophagus | ESCC | 1.29e-30 | 7.68e-01 | 0.1323 |
| 6996 | TDG | P5T-E | Human | Esophagus | ESCC | 1.47e-23 | 4.91e-01 | 0.1327 |
| 6996 | TDG | P8T-E | Human | Esophagus | ESCC | 8.47e-27 | 6.72e-01 | 0.0889 |
| 6996 | TDG | P9T-E | Human | Esophagus | ESCC | 1.36e-16 | 3.43e-01 | 0.1131 |
| 6996 | TDG | P10T-E | Human | Esophagus | ESCC | 4.48e-58 | 9.55e-01 | 0.116 |
| 6996 | TDG | P11T-E | Human | Esophagus | ESCC | 6.48e-13 | 8.74e-01 | 0.1426 |
| 6996 | TDG | P12T-E | Human | Esophagus | ESCC | 3.39e-31 | 4.99e-01 | 0.1122 |
| 6996 | TDG | P15T-E | Human | Esophagus | ESCC | 7.90e-17 | 4.03e-01 | 0.1149 |
| 6996 | TDG | P16T-E | Human | Esophagus | ESCC | 1.07e-24 | 4.33e-01 | 0.1153 |
| 6996 | TDG | P17T-E | Human | Esophagus | ESCC | 4.11e-07 | 3.88e-01 | 0.1278 |
| Page: 1 2 3 4 5 6 |
| Tissue | Expression Dynamics | Abbreviation |
| Esophagus | 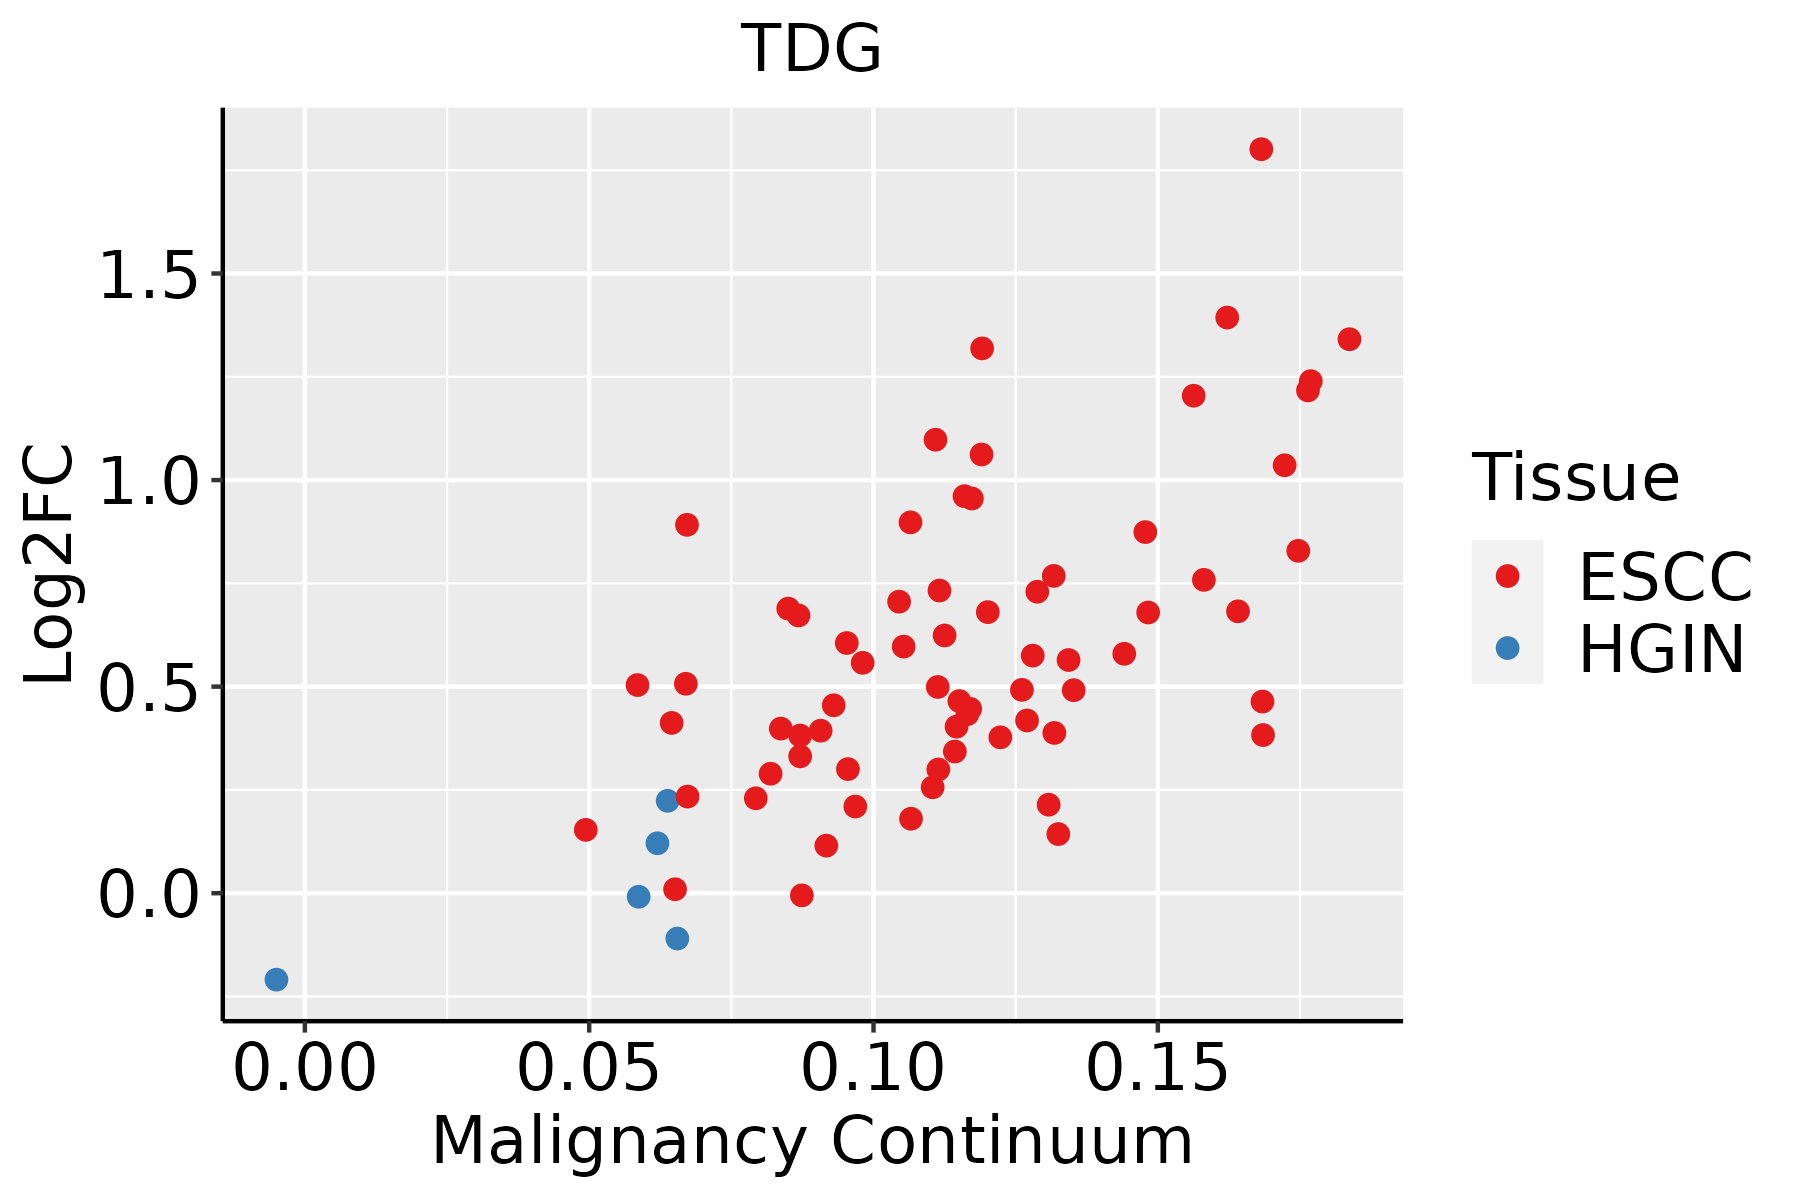 | ESCC: Esophageal squamous cell carcinoma |
| HGIN: High-grade intraepithelial neoplasias | ||
| LGIN: Low-grade intraepithelial neoplasias | ||
| Liver | 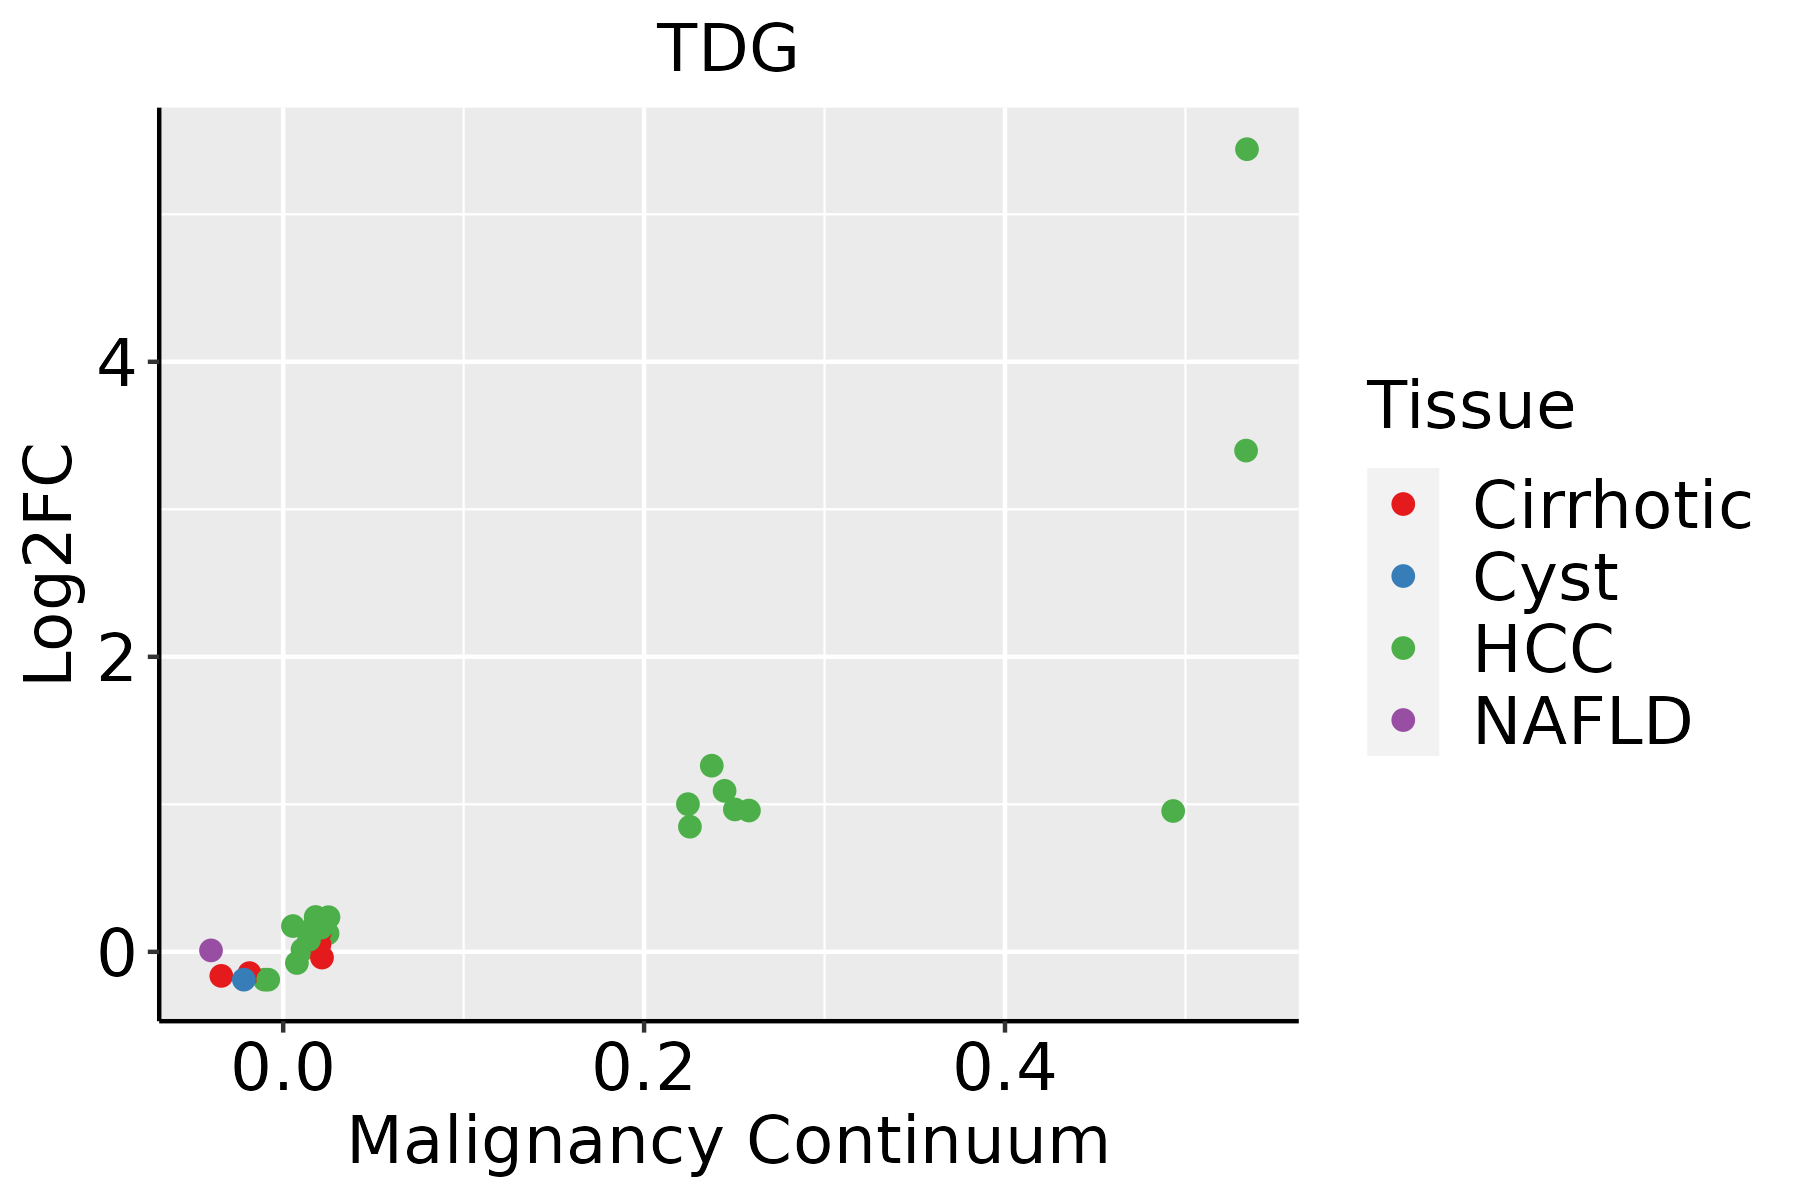 | HCC: Hepatocellular carcinoma |
| NAFLD: Non-alcoholic fatty liver disease | ||
| Oral Cavity | 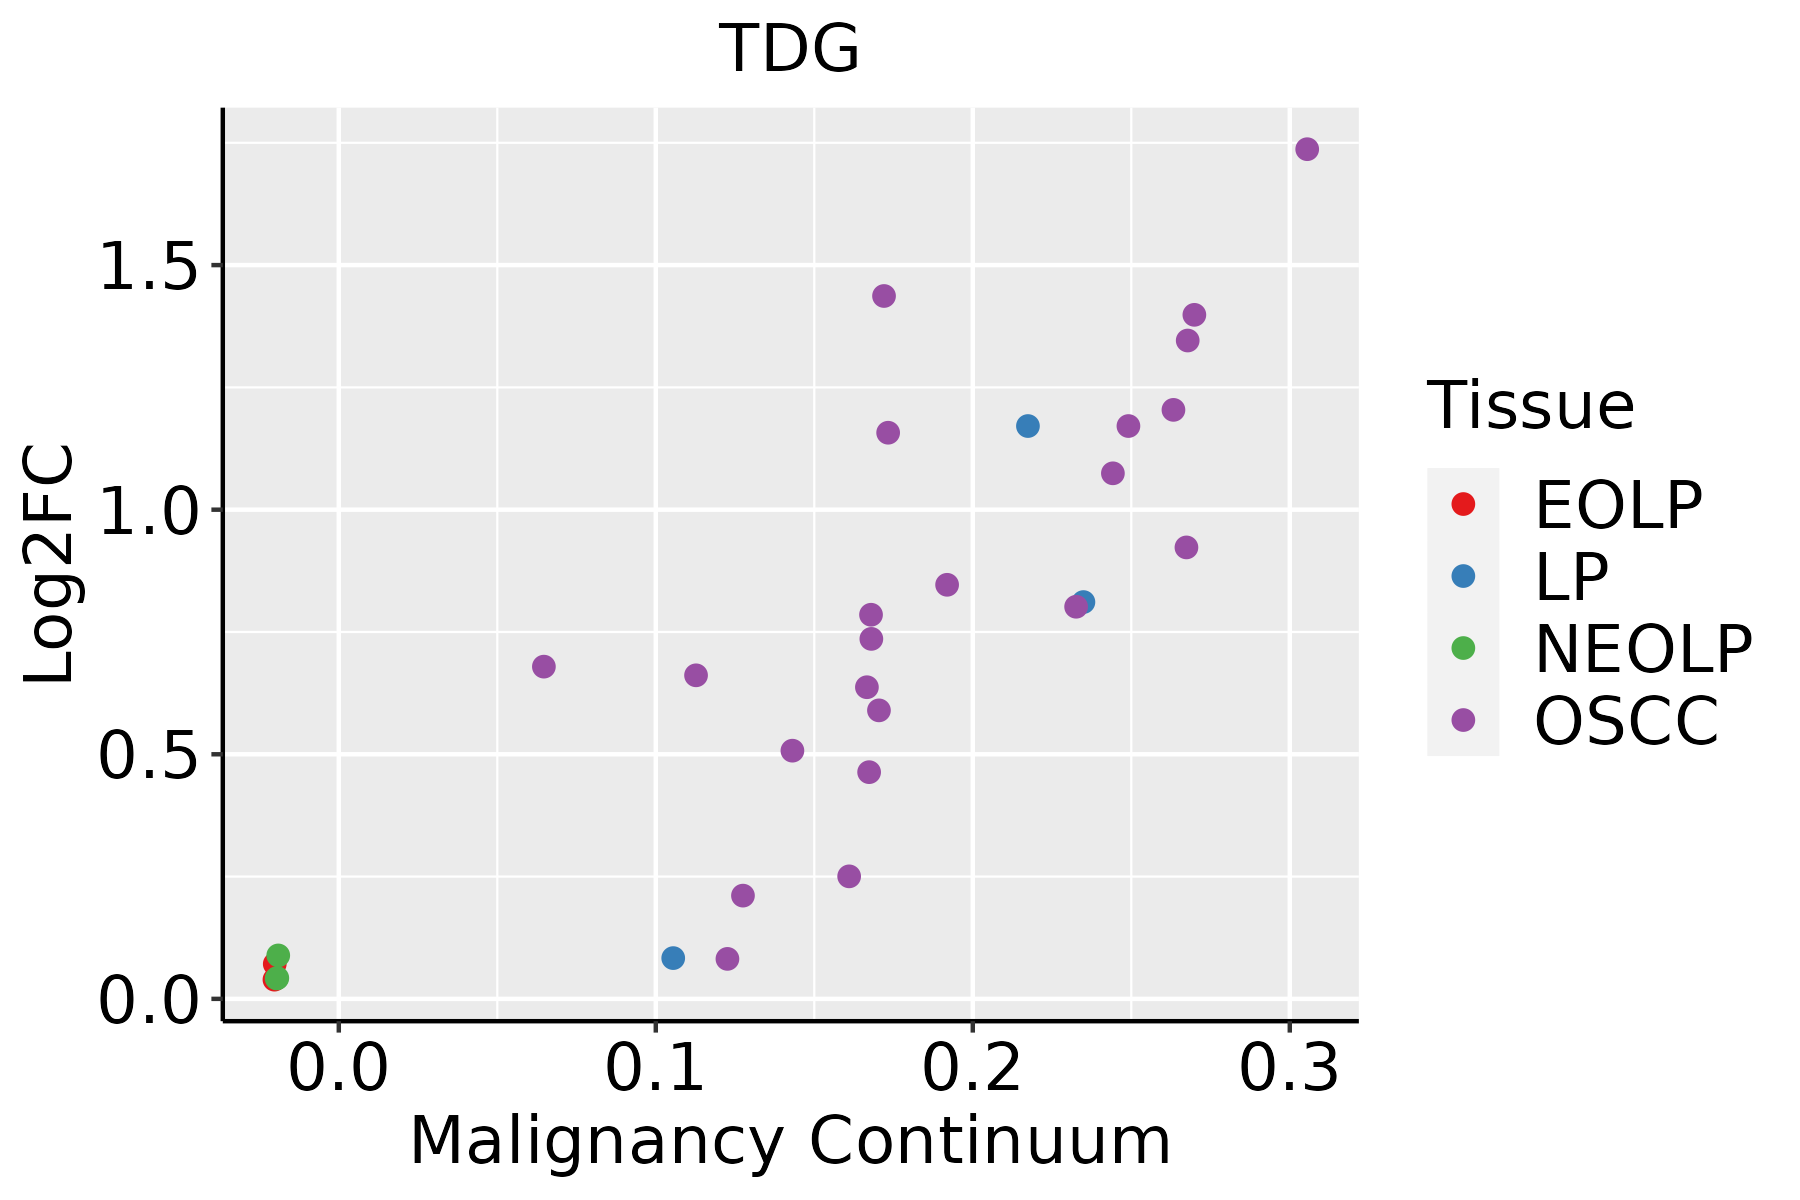 | EOLP: Erosive Oral lichen planus |
| LP: leukoplakia | ||
| NEOLP: Non-erosive oral lichen planus | ||
| OSCC: Oral squamous cell carcinoma | ||
| Skin | 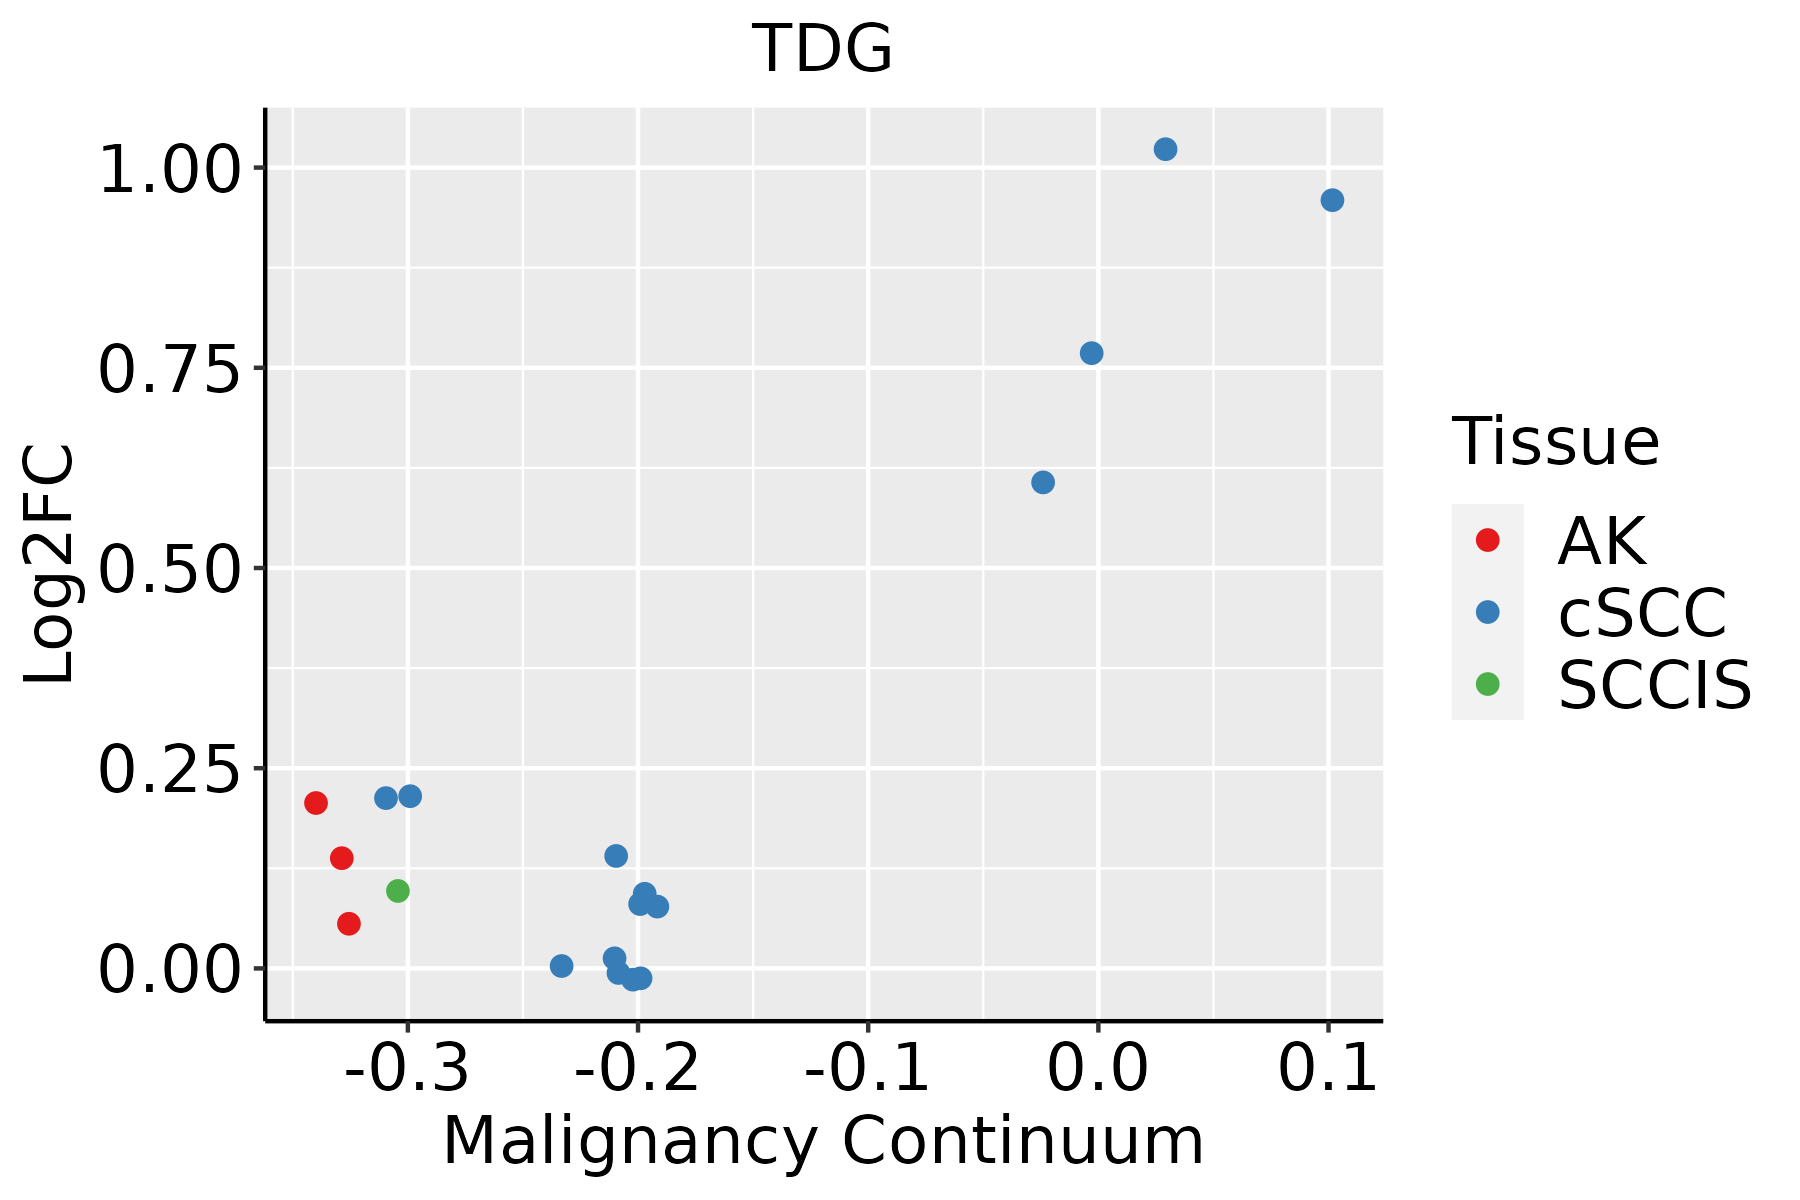 | AK: Actinic keratosis |
| cSCC: Cutaneous squamous cell carcinoma | ||
| SCCIS:squamous cell carcinoma in situ | ||
| Thyroid |  | ATC: Anaplastic thyroid cancer |
| HT: Hashimoto's thyroiditis | ||
| PTC: Papillary thyroid cancer |
| ∗log2FC in expression of this searched gene in stem-like cells from each diseased tissue sample relative to stem-like cells in normal samples in each tissue plotted against the malignancy continuum. Samples are colored based on if they are from different disease stage. |
Top |
Malignant transformation related pathway analysis |
| Find out the enriched GO biological processes and KEGG pathways involved in transition from healthy to precancer to cancer |
| Tissue | Disease Stage | Enriched GO biological Processes |
| Colorectum | AD |  |
| Colorectum | SER |  |
| Colorectum | MSS |  |
| Colorectum | MSI-H |  |
| Colorectum | FAP |  |
| ∗Top 15 enriched GO BP terms are showed in the bar plot of each disease state in each tissue. Each row represents a significant GO biological process which is colored according to the -log10(p.adjust). |
| Page: 1 2 3 4 5 6 7 8 9 |
| GO ID | Tissue | Disease Stage | Description | Gene Ratio | Bg Ratio | pvalue | p.adjust | Count |
| GO:003465519 | Esophagus | HGIN | nucleobase-containing compound catabolic process | 98/2587 | 407/18723 | 1.44e-08 | 8.94e-07 | 98 |
| GO:004670017 | Esophagus | HGIN | heterocycle catabolic process | 103/2587 | 445/18723 | 5.44e-08 | 2.99e-06 | 103 |
| GO:004427018 | Esophagus | HGIN | cellular nitrogen compound catabolic process | 103/2587 | 451/18723 | 1.10e-07 | 5.56e-06 | 103 |
| GO:001943917 | Esophagus | HGIN | aromatic compound catabolic process | 105/2587 | 467/18723 | 1.89e-07 | 9.31e-06 | 105 |
| GO:000632516 | Esophagus | HGIN | chromatin organization | 92/2587 | 409/18723 | 1.05e-06 | 4.16e-05 | 92 |
| GO:190136117 | Esophagus | HGIN | organic cyclic compound catabolic process | 106/2587 | 495/18723 | 1.94e-06 | 7.13e-05 | 106 |
| GO:00196924 | Esophagus | HGIN | deoxyribose phosphate metabolic process | 16/2587 | 42/18723 | 7.90e-05 | 1.76e-03 | 16 |
| GO:00092624 | Esophagus | HGIN | deoxyribonucleotide metabolic process | 16/2587 | 44/18723 | 1.51e-04 | 2.97e-03 | 16 |
| GO:00093944 | Esophagus | HGIN | 2'-deoxyribonucleotide metabolic process | 15/2587 | 40/18723 | 1.62e-04 | 3.16e-03 | 15 |
| GO:00092643 | Esophagus | HGIN | deoxyribonucleotide catabolic process | 12/2587 | 30/18723 | 3.62e-04 | 5.68e-03 | 12 |
| GO:00463863 | Esophagus | HGIN | deoxyribose phosphate catabolic process | 12/2587 | 31/18723 | 5.17e-04 | 7.46e-03 | 12 |
| GO:000911720 | Esophagus | HGIN | nucleotide metabolic process | 92/2587 | 489/18723 | 1.11e-03 | 1.36e-02 | 92 |
| GO:000675320 | Esophagus | HGIN | nucleoside phosphate metabolic process | 93/2587 | 497/18723 | 1.25e-03 | 1.49e-02 | 93 |
| GO:00092233 | Esophagus | HGIN | pyrimidine deoxyribonucleotide catabolic process | 8/2587 | 19/18723 | 2.40e-03 | 2.41e-02 | 8 |
| GO:0006285 | Esophagus | HGIN | base-excision repair, AP site formation | 6/2587 | 12/18723 | 3.03e-03 | 2.88e-02 | 6 |
| GO:00092193 | Esophagus | HGIN | pyrimidine deoxyribonucleotide metabolic process | 9/2587 | 24/18723 | 3.33e-03 | 3.12e-02 | 9 |
| GO:00062442 | Esophagus | HGIN | pyrimidine nucleotide catabolic process | 8/2587 | 21/18723 | 5.00e-03 | 4.19e-02 | 8 |
| GO:0034655110 | Esophagus | ESCC | nucleobase-containing compound catabolic process | 272/8552 | 407/18723 | 2.92e-18 | 2.90e-16 | 272 |
| GO:004670018 | Esophagus | ESCC | heterocycle catabolic process | 286/8552 | 445/18723 | 1.12e-15 | 7.47e-14 | 286 |
| GO:004427019 | Esophagus | ESCC | cellular nitrogen compound catabolic process | 288/8552 | 451/18723 | 3.03e-15 | 1.79e-13 | 288 |
| Page: 1 2 3 4 5 6 7 8 9 |
| Pathway ID | Tissue | Disease Stage | Description | Gene Ratio | Bg Ratio | pvalue | p.adjust | qvalue | Count |
| hsa034104 | Esophagus | ESCC | Base excision repair | 38/4205 | 44/8465 | 3.59e-07 | 2.62e-06 | 1.34e-06 | 38 |
| hsa0341011 | Esophagus | ESCC | Base excision repair | 38/4205 | 44/8465 | 3.59e-07 | 2.62e-06 | 1.34e-06 | 38 |
| hsa03410 | Oral cavity | OSCC | Base excision repair | 32/3704 | 44/8465 | 9.11e-05 | 3.25e-04 | 1.65e-04 | 32 |
| hsa034101 | Oral cavity | OSCC | Base excision repair | 32/3704 | 44/8465 | 9.11e-05 | 3.25e-04 | 1.65e-04 | 32 |
| hsa034102 | Oral cavity | LP | Base excision repair | 23/2418 | 44/8465 | 7.66e-04 | 3.75e-03 | 2.42e-03 | 23 |
| hsa034103 | Oral cavity | LP | Base excision repair | 23/2418 | 44/8465 | 7.66e-04 | 3.75e-03 | 2.42e-03 | 23 |
| Page: 1 |
Top |
Cell-cell communication analysis |
| Identification of potential cell-cell interactions between two cell types and their ligand-receptor pairs for different disease states |
| Ligand | Receptor | LRpair | Pathway | Tissue | Disease Stage |
| Page: 1 |
Top |
Single-cell gene regulatory network inference analysis |
| Find out the significant the regulons (TFs) and the target genes of each regulon across cell types for different disease states |
| TF | Cell Type | Tissue | Disease Stage | Target Gene | RSS | Regulon Activity |
| ∗The dot plots of a searched regulon are shown for all cell subpopulations in each disease state of each tissue based on the regulon specific score inferred using pySCENIC and by calculating the average expression. |
| Page: 1 |
Top |
Somatic mutation of malignant transformation related genes |
| Annotation of somatic variants for genes involved in malignant transformation |
| Hugo Symbol | Variant Class | Variant Classification | dbSNP RS | HGVSc | HGVSp | HGVSp Short | SWISSPROT | BIOTYPE | SIFT | PolyPhen | Tumor Sample Barcode | Tissue | Histology | Sex | Age | Stage | Therapy Types | Drugs | Outcome |
| TDG | SNV | Missense_Mutation | novel | c.40N>C | p.Ala14Pro | p.A14P | Q13569 | protein_coding | tolerated_low_confidence(0.07) | benign(0.087) | TCGA-A8-A07W-01 | Breast | breast invasive carcinoma | Female | >=65 | III/IV | Hormone Therapy | exemestane | SD |
| TDG | SNV | Missense_Mutation | novel | c.422N>T | p.Pro141Leu | p.P141L | Q13569 | protein_coding | deleterious(0) | probably_damaging(1) | TCGA-A8-A0A7-01 | Breast | breast invasive carcinoma | Female | <65 | I/II | Unknown | Unknown | SD |
| TDG | SNV | Missense_Mutation | novel | c.1015N>C | p.Glu339Gln | p.E339Q | Q13569 | protein_coding | deleterious(0.05) | benign(0.282) | TCGA-BH-A0B6-01 | Breast | breast invasive carcinoma | Female | <65 | I/II | Unknown | Unknown | SD |
| TDG | SNV | Missense_Mutation | novel | c.253T>C | p.Ser85Pro | p.S85P | Q13569 | protein_coding | tolerated(0.31) | benign(0.216) | TCGA-A6-2675-01 | Colorectum | colon adenocarcinoma | Male | >=65 | I/II | Unknown | Unknown | SD |
| TDG | SNV | Missense_Mutation | c.1114N>A | p.Glu372Lys | p.E372K | Q13569 | protein_coding | tolerated_low_confidence(0.1) | benign(0.021) | TCGA-AA-A00N-01 | Colorectum | colon adenocarcinoma | Male | >=65 | I/II | Unknown | Unknown | PD | |
| TDG | SNV | Missense_Mutation | c.651N>T | p.Gln217His | p.Q217H | Q13569 | protein_coding | deleterious(0) | benign(0.394) | TCGA-AA-A010-01 | Colorectum | colon adenocarcinoma | Female | <65 | I/II | Chemotherapy | folinic | CR | |
| TDG | SNV | Missense_Mutation | c.553T>A | p.Tyr185Asn | p.Y185N | Q13569 | protein_coding | deleterious(0.01) | possibly_damaging(0.782) | TCGA-G4-6302-01 | Colorectum | colon adenocarcinoma | Female | >=65 | I/II | Unknown | Unknown | SD | |
| TDG | SNV | Missense_Mutation | novel | c.1158G>C | p.Gln386His | p.Q386H | Q13569 | protein_coding | deleterious_low_confidence(0.02) | probably_damaging(0.998) | TCGA-AG-A014-01 | Colorectum | rectum adenocarcinoma | Male | >=65 | I/II | Unknown | Unknown | SD |
| TDG | SNV | Missense_Mutation | novel | c.1018G>T | p.Ala340Ser | p.A340S | Q13569 | protein_coding | tolerated(0.17) | benign(0.135) | TCGA-EI-6917-01 | Colorectum | rectum adenocarcinoma | Male | <65 | III/IV | Chemotherapy | 5fluorouracil+oxaciplatina+l-folinian | SD |
| TDG | SNV | Missense_Mutation | novel | c.133C>T | p.Pro45Ser | p.P45S | Q13569 | protein_coding | deleterious_low_confidence(0.02) | benign(0.001) | TCGA-A5-A0G2-01 | Endometrium | uterine corpus endometrioid carcinoma | Female | <65 | III/IV | Unknown | Unknown | SD |
| Page: 1 2 3 4 5 |
Top |
Related drugs of malignant transformation related genes |
| Identification of chemicals and drugs interact with genes involved in malignant transfromation |
| (DGIdb 4.0) |
| Entrez ID | Symbol | Category | Interaction Types | Drug Claim Name | Drug Name | PMIDs |
| Page: 1 |

Copyright 2023-Present -The University of Texas Health Science Center at Houston |