
|
|||||
|
 | |
| |
| |
| |
| |
| |
|
Gene: TCTN3 |
Gene summary for TCTN3 |
| Gene information | Species | Human | Gene symbol | TCTN3 | Gene ID | 26123 |
| Gene name | tectonic family member 3 | |
| Gene Alias | C10orf61 | |
| Cytomap | 10q24.1 | |
| Gene Type | protein-coding | GO ID | GO:0006915 | UniProtAcc | Q6NUS6 |
Top |
Malignant transformation analysis |
| Identification of the aberrant gene expression in precancerous and cancerous lesions by comparing the gene expression of stem-like cells in diseased tissues with normal stem cells |
| Entrez ID | Symbol | Replicates | Species | Organ | Tissue | Adj P-value | Log2FC | Malignancy |
| 26123 | TCTN3 | LZE4T | Human | Esophagus | ESCC | 4.77e-05 | 2.98e-01 | 0.0811 |
| 26123 | TCTN3 | LZE7T | Human | Esophagus | ESCC | 3.00e-07 | 2.02e-01 | 0.0667 |
| 26123 | TCTN3 | LZE8T | Human | Esophagus | ESCC | 4.24e-11 | 1.83e-01 | 0.067 |
| 26123 | TCTN3 | LZE20T | Human | Esophagus | ESCC | 7.94e-05 | 1.15e-01 | 0.0662 |
| 26123 | TCTN3 | LZE22D1 | Human | Esophagus | HGIN | 2.39e-02 | 1.19e-01 | 0.0595 |
| 26123 | TCTN3 | LZE22T | Human | Esophagus | ESCC | 1.03e-03 | 2.53e-01 | 0.068 |
| 26123 | TCTN3 | LZE24T | Human | Esophagus | ESCC | 1.59e-15 | 2.91e-01 | 0.0596 |
| 26123 | TCTN3 | LZE6T | Human | Esophagus | ESCC | 1.81e-02 | 2.14e-01 | 0.0845 |
| 26123 | TCTN3 | P1T-E | Human | Esophagus | ESCC | 1.38e-04 | 3.16e-01 | 0.0875 |
| 26123 | TCTN3 | P2T-E | Human | Esophagus | ESCC | 1.06e-29 | 5.73e-01 | 0.1177 |
| 26123 | TCTN3 | P4T-E | Human | Esophagus | ESCC | 6.78e-38 | 6.18e-01 | 0.1323 |
| 26123 | TCTN3 | P5T-E | Human | Esophagus | ESCC | 1.55e-10 | 2.40e-01 | 0.1327 |
| 26123 | TCTN3 | P8T-E | Human | Esophagus | ESCC | 2.06e-21 | 3.55e-01 | 0.0889 |
| 26123 | TCTN3 | P9T-E | Human | Esophagus | ESCC | 1.44e-08 | 1.65e-01 | 0.1131 |
| 26123 | TCTN3 | P10T-E | Human | Esophagus | ESCC | 1.16e-09 | 2.15e-01 | 0.116 |
| 26123 | TCTN3 | P11T-E | Human | Esophagus | ESCC | 1.53e-27 | 6.44e-01 | 0.1426 |
| 26123 | TCTN3 | P12T-E | Human | Esophagus | ESCC | 6.64e-23 | 4.79e-01 | 0.1122 |
| 26123 | TCTN3 | P15T-E | Human | Esophagus | ESCC | 3.95e-19 | 3.33e-01 | 0.1149 |
| 26123 | TCTN3 | P16T-E | Human | Esophagus | ESCC | 1.25e-34 | 6.04e-01 | 0.1153 |
| 26123 | TCTN3 | P19T-E | Human | Esophagus | ESCC | 3.24e-06 | 3.81e-01 | 0.1662 |
| Page: 1 2 3 4 5 6 |
| Tissue | Expression Dynamics | Abbreviation |
| Esophagus | 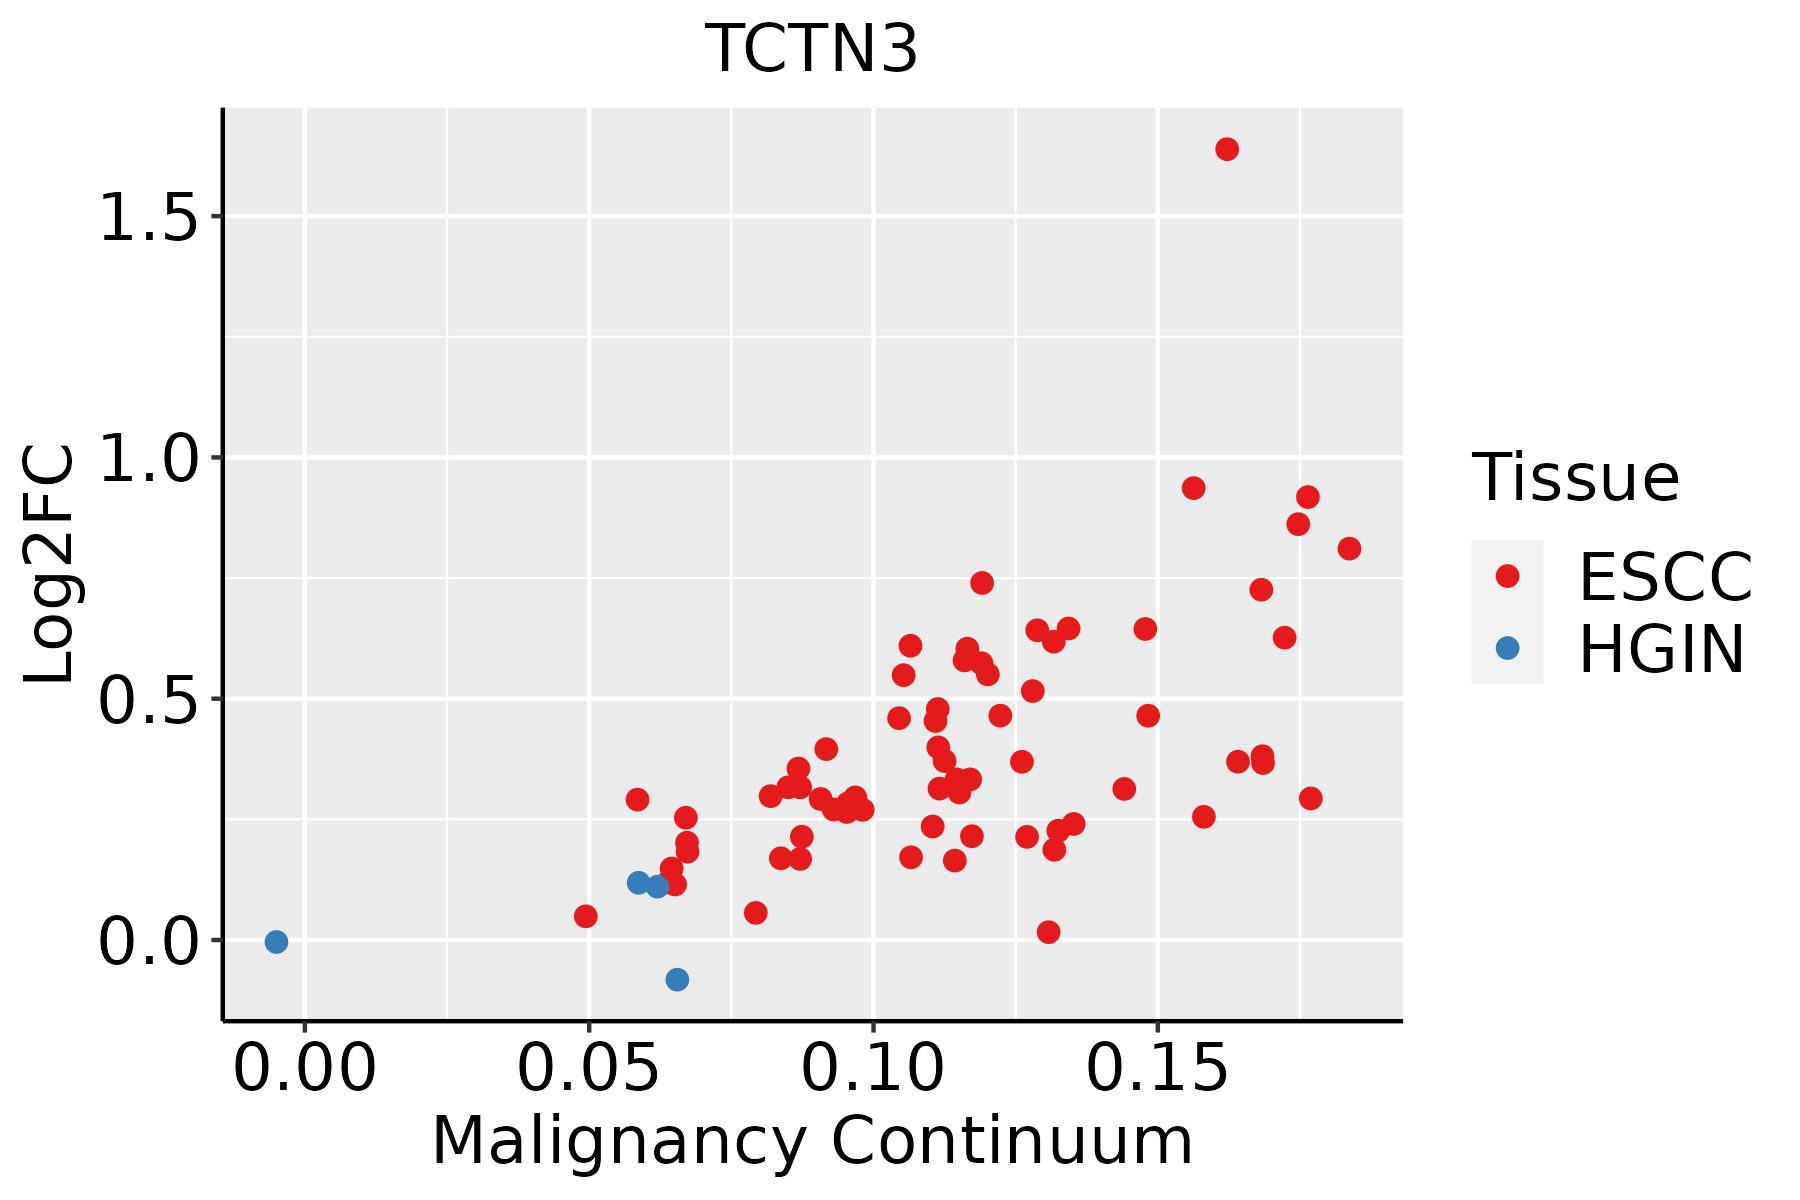 | ESCC: Esophageal squamous cell carcinoma |
| HGIN: High-grade intraepithelial neoplasias | ||
| LGIN: Low-grade intraepithelial neoplasias | ||
| Liver | 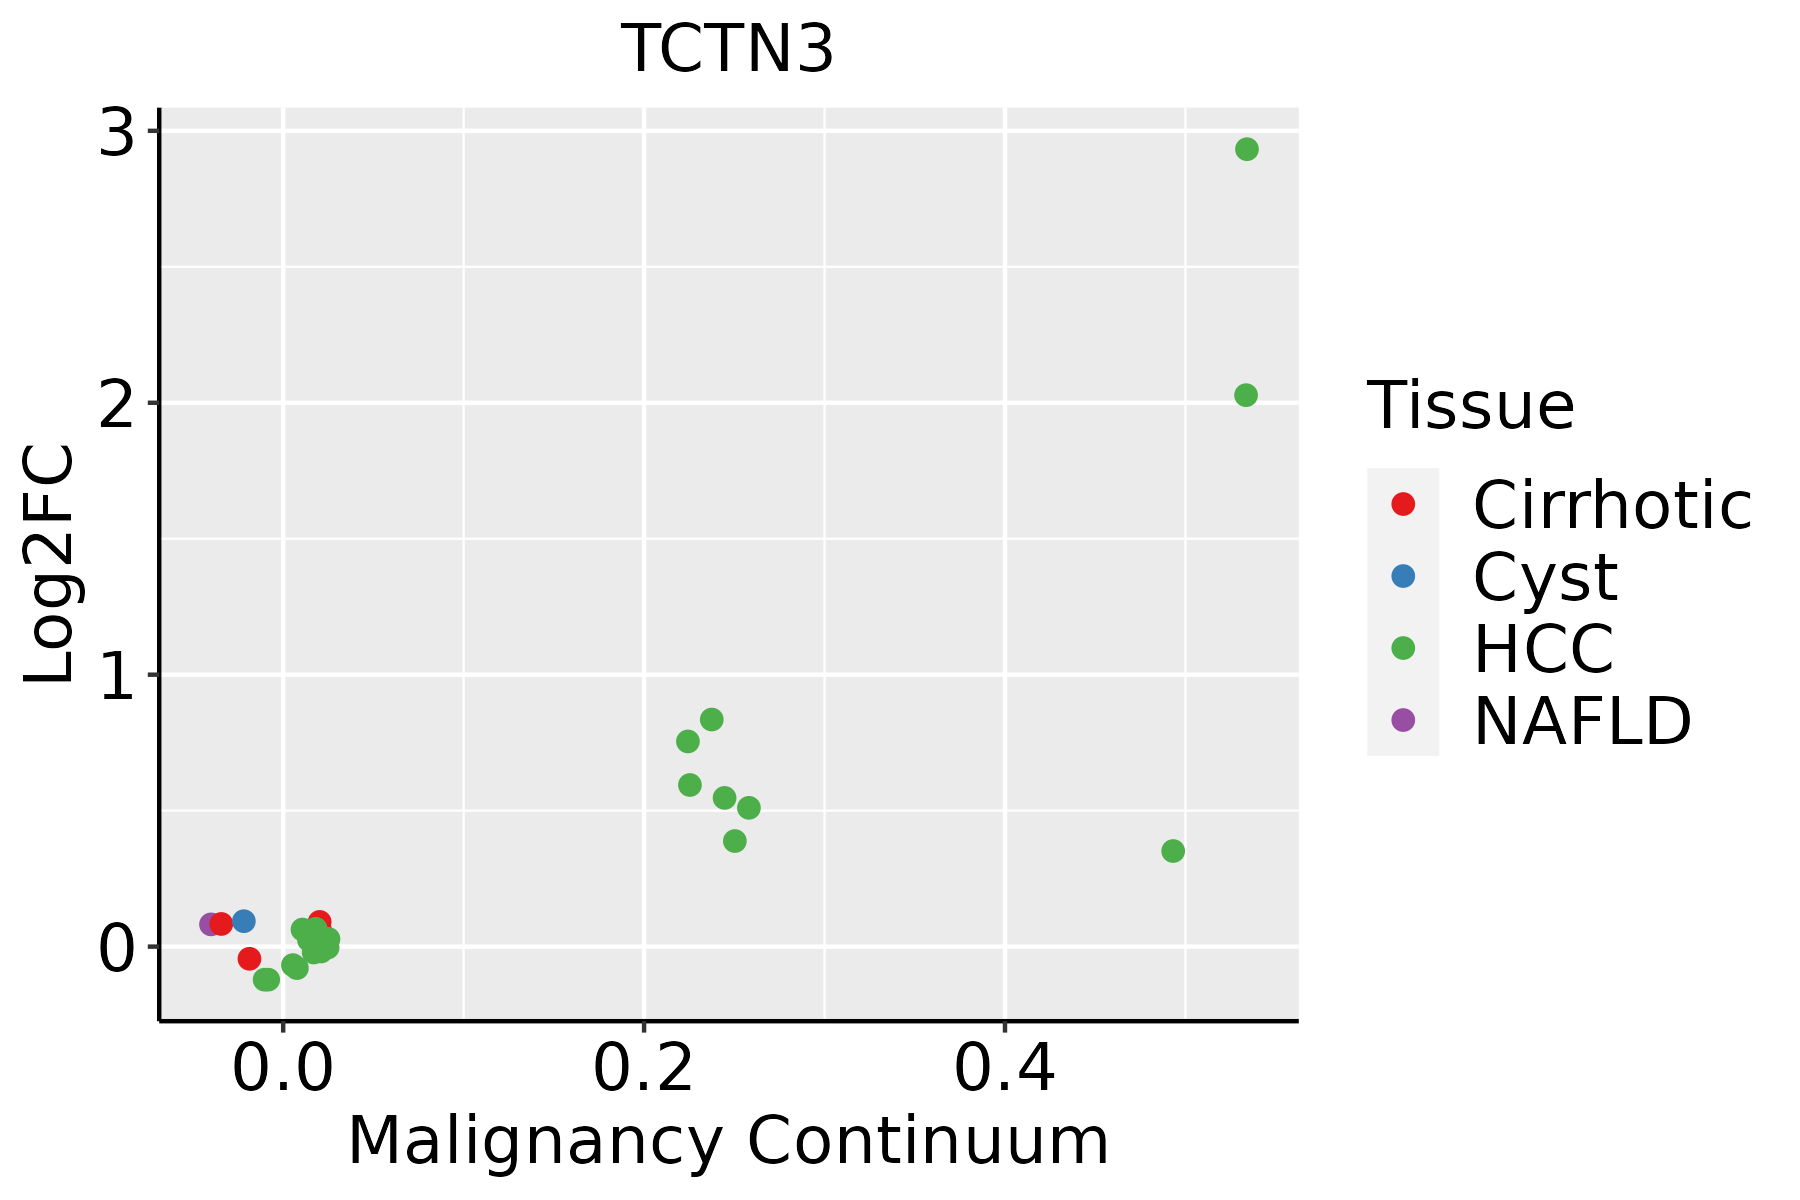 | HCC: Hepatocellular carcinoma |
| NAFLD: Non-alcoholic fatty liver disease | ||
| Oral Cavity | 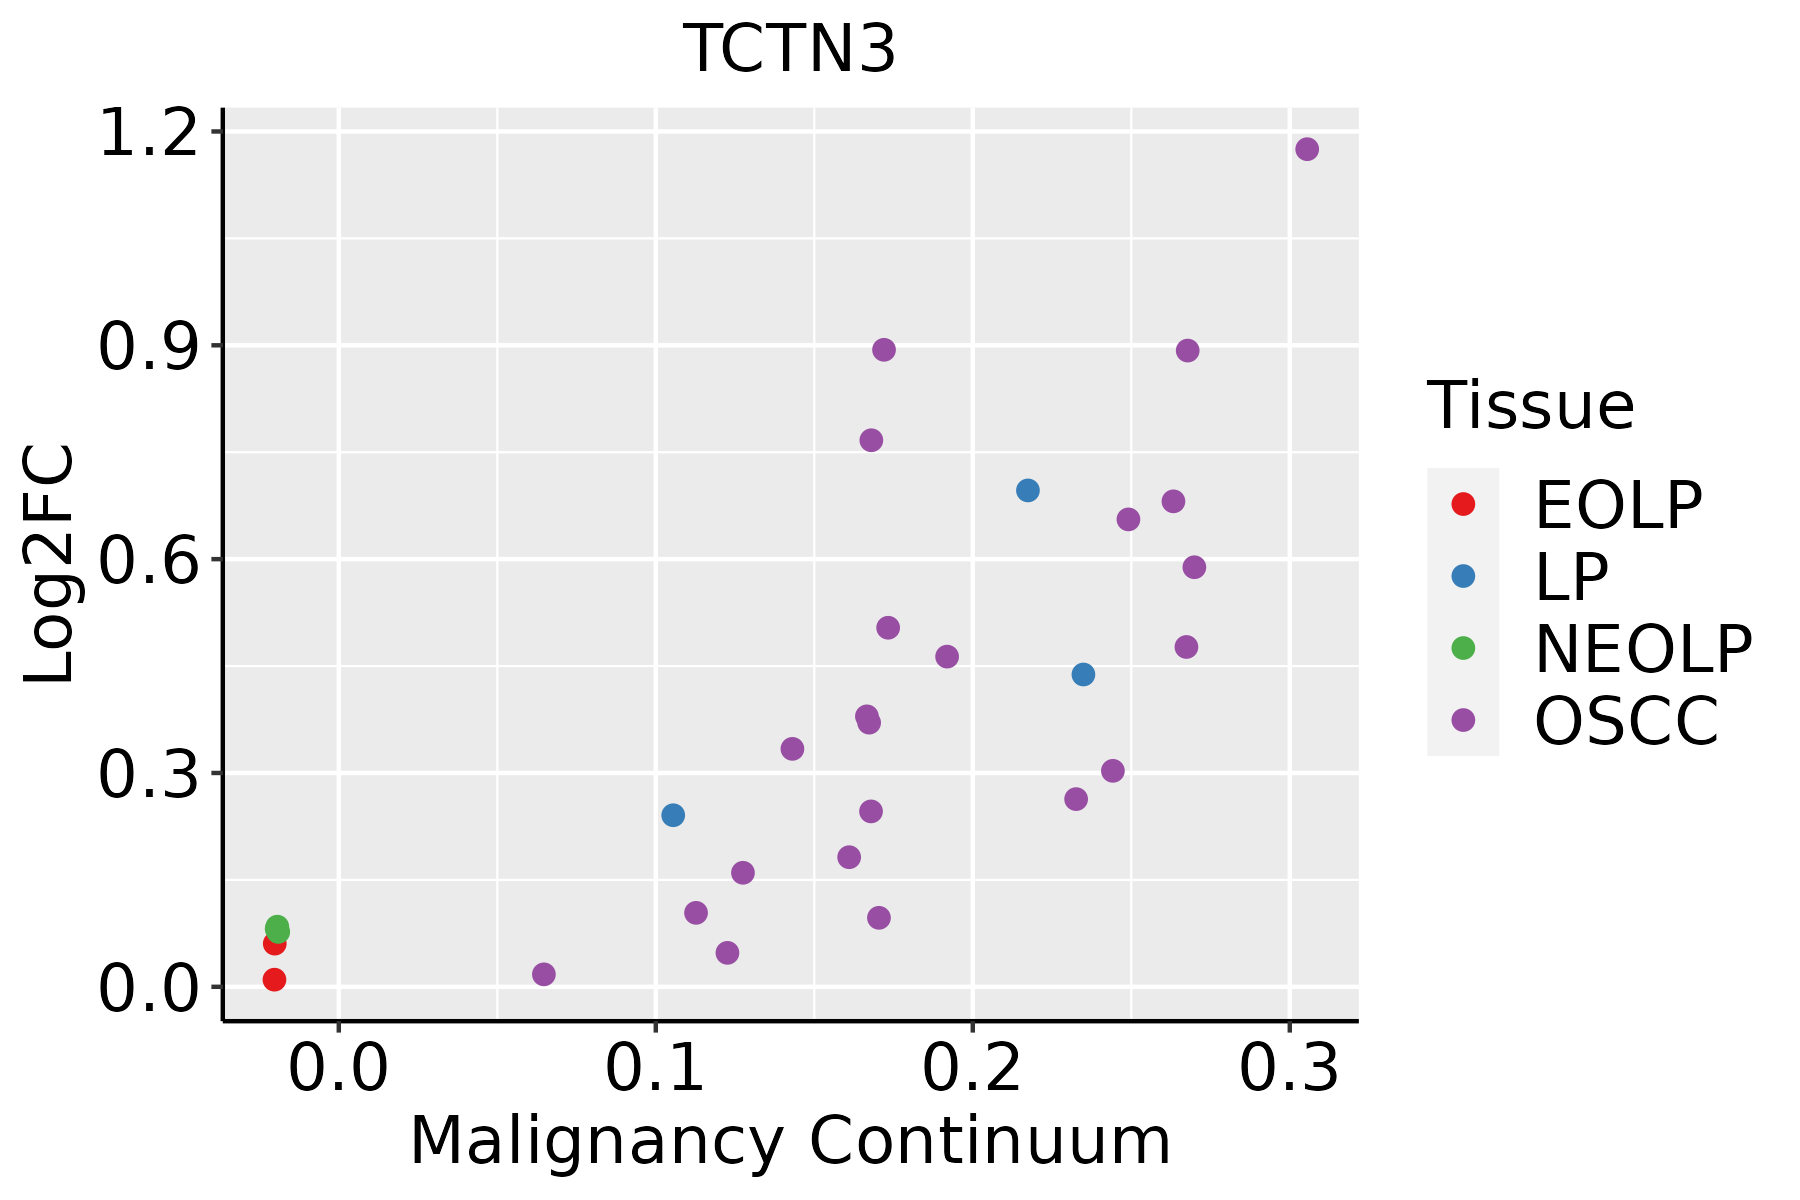 | EOLP: Erosive Oral lichen planus |
| LP: leukoplakia | ||
| NEOLP: Non-erosive oral lichen planus | ||
| OSCC: Oral squamous cell carcinoma | ||
| Skin | 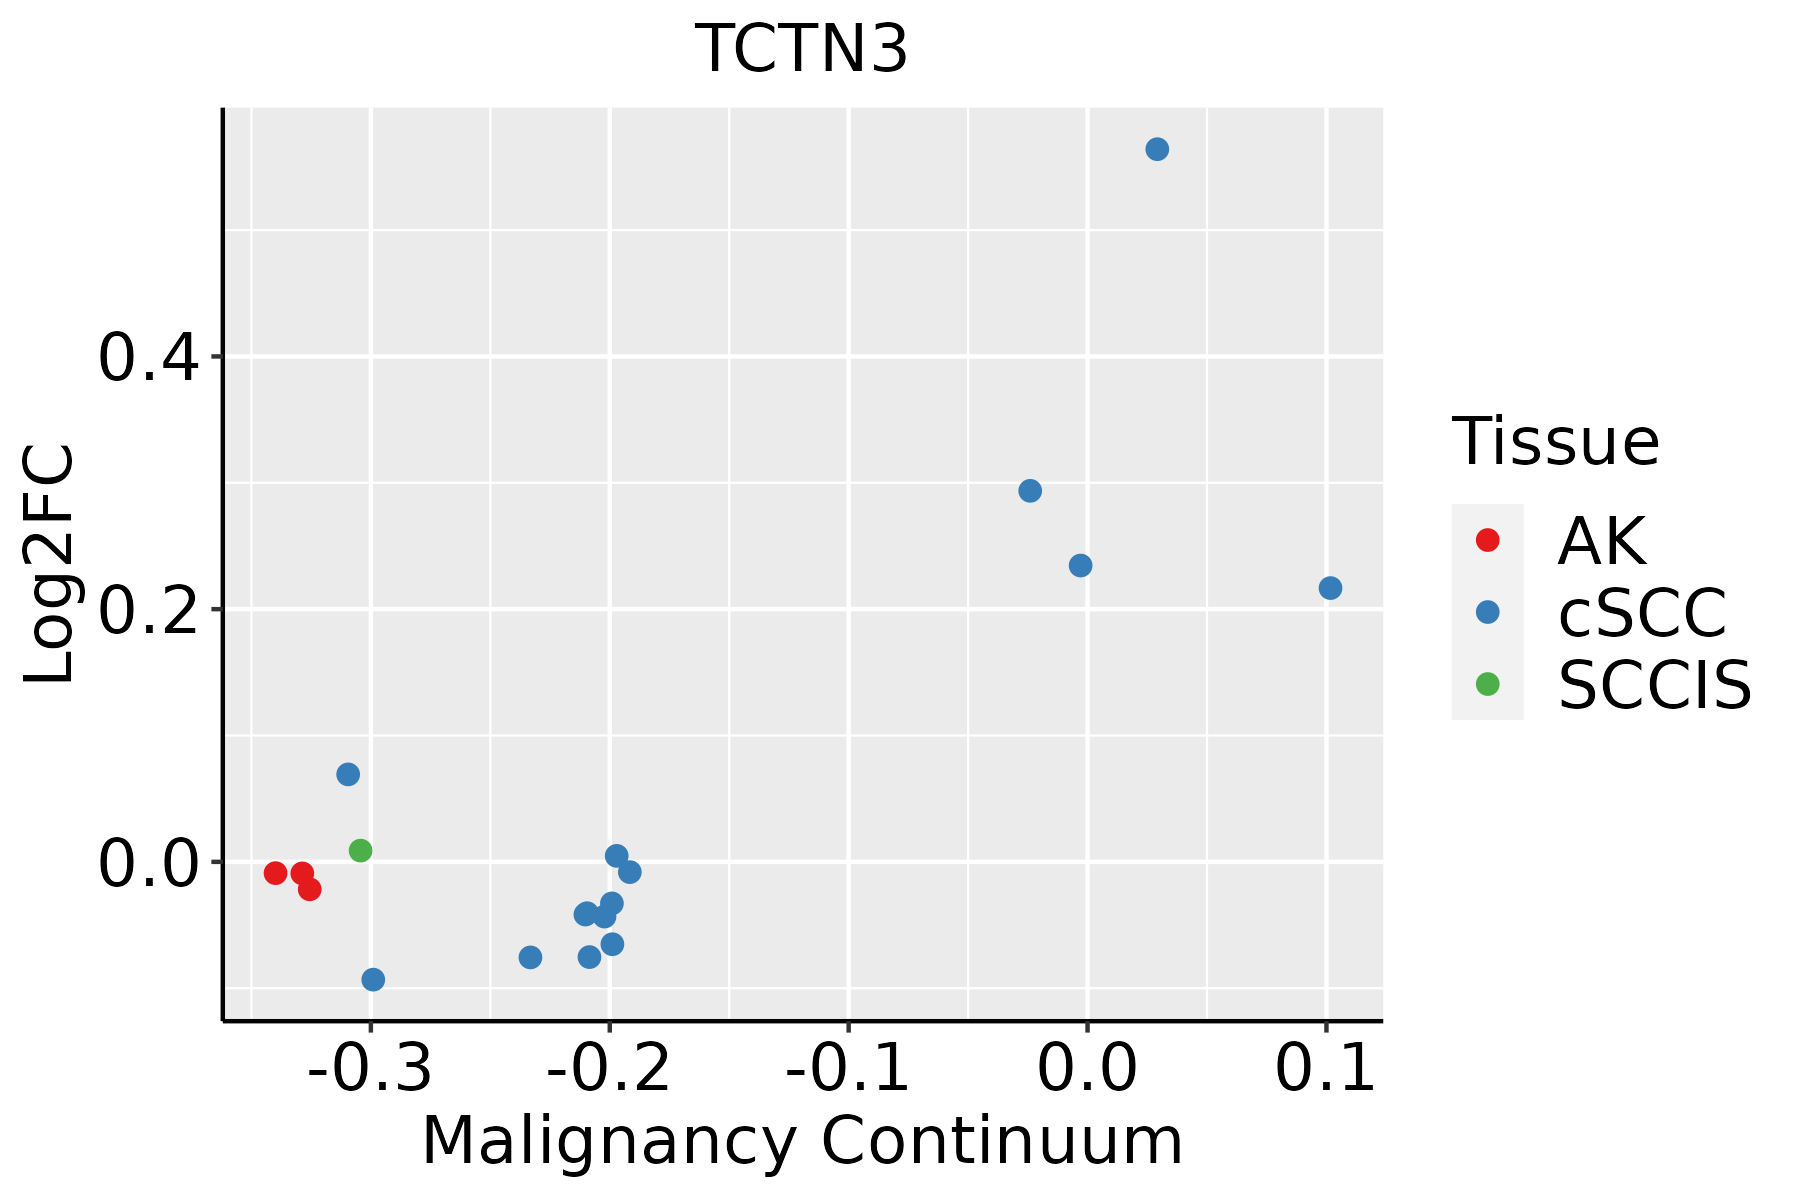 | AK: Actinic keratosis |
| cSCC: Cutaneous squamous cell carcinoma | ||
| SCCIS:squamous cell carcinoma in situ | ||
| Thyroid | 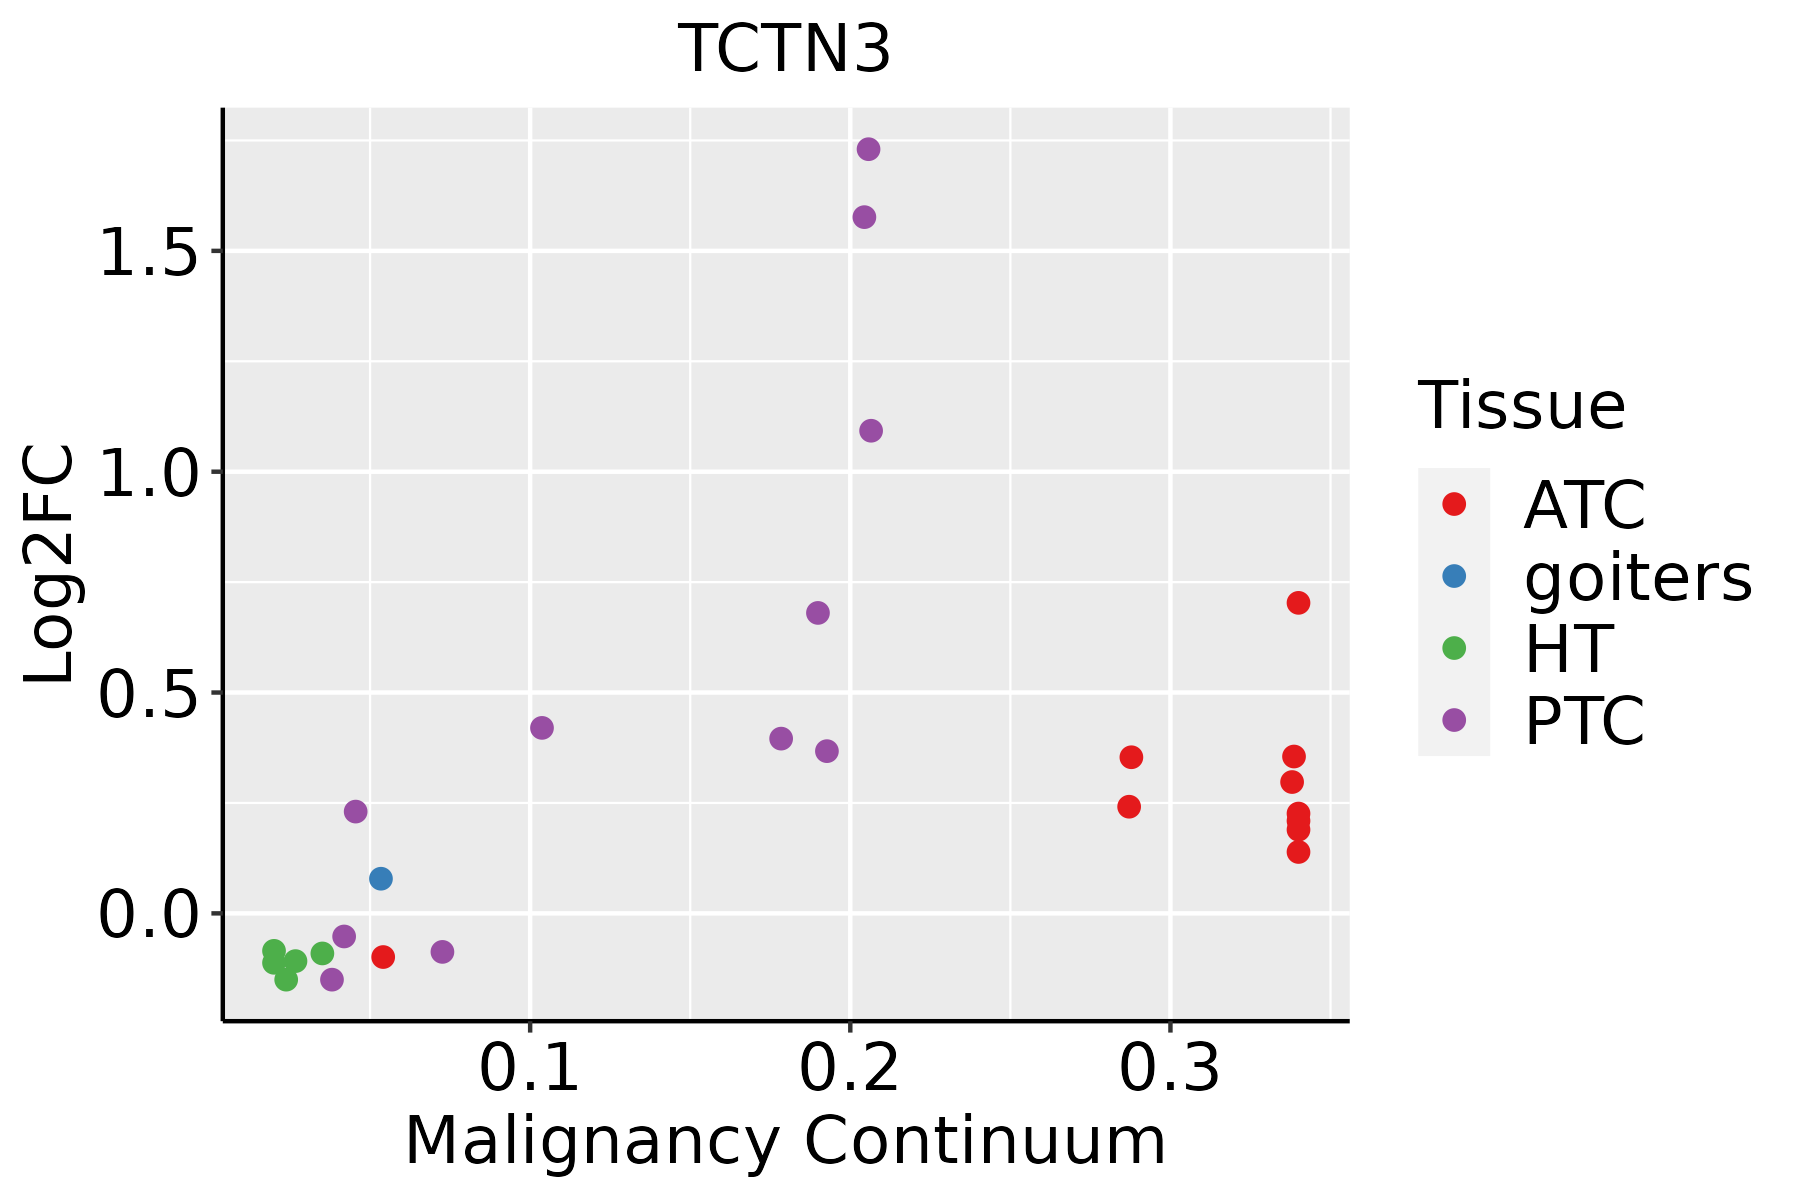 | ATC: Anaplastic thyroid cancer |
| HT: Hashimoto's thyroiditis | ||
| PTC: Papillary thyroid cancer |
| ∗log2FC in expression of this searched gene in stem-like cells from each diseased tissue sample relative to stem-like cells in normal samples in each tissue plotted against the malignancy continuum. Samples are colored based on if they are from different disease stage. |
Top |
Malignant transformation related pathway analysis |
| Find out the enriched GO biological processes and KEGG pathways involved in transition from healthy to precancer to cancer |
| Tissue | Disease Stage | Enriched GO biological Processes |
| Colorectum | AD |  |
| Colorectum | SER |  |
| Colorectum | MSS |  |
| Colorectum | MSI-H |  |
| Colorectum | FAP |  |
| ∗Top 15 enriched GO BP terms are showed in the bar plot of each disease state in each tissue. Each row represents a significant GO biological process which is colored according to the -log10(p.adjust). |
| Page: 1 2 3 4 5 6 7 8 9 |
| GO ID | Tissue | Disease Stage | Description | Gene Ratio | Bg Ratio | pvalue | p.adjust | Count |
| GO:0007224 | Thyroid | ATC | smoothened signaling pathway | 60/6293 | 138/18723 | 9.75e-03 | 3.57e-02 | 60 |
| Page: 1 |
| Pathway ID | Tissue | Disease Stage | Description | Gene Ratio | Bg Ratio | pvalue | p.adjust | qvalue | Count |
| Page: 1 |
Top |
Cell-cell communication analysis |
| Identification of potential cell-cell interactions between two cell types and their ligand-receptor pairs for different disease states |
| Ligand | Receptor | LRpair | Pathway | Tissue | Disease Stage |
| Page: 1 |
Top |
Single-cell gene regulatory network inference analysis |
| Find out the significant the regulons (TFs) and the target genes of each regulon across cell types for different disease states |
| TF | Cell Type | Tissue | Disease Stage | Target Gene | RSS | Regulon Activity |
| ∗The dot plots of a searched regulon are shown for all cell subpopulations in each disease state of each tissue based on the regulon specific score inferred using pySCENIC and by calculating the average expression. |
| Page: 1 |
Top |
Somatic mutation of malignant transformation related genes |
| Annotation of somatic variants for genes involved in malignant transformation |
| Hugo Symbol | Variant Class | Variant Classification | dbSNP RS | HGVSc | HGVSp | HGVSp Short | SWISSPROT | BIOTYPE | SIFT | PolyPhen | Tumor Sample Barcode | Tissue | Histology | Sex | Age | Stage | Therapy Types | Drugs | Outcome |
| TCTN3 | SNV | Missense_Mutation | novel | c.446G>C | p.Arg149Thr | p.R149T | Q6NUS6 | protein_coding | tolerated(0.2) | possibly_damaging(0.903) | TCGA-BH-A2L8-01 | Breast | breast invasive carcinoma | Female | <65 | I/II | Chemotherapy | cytoxan | CR |
| TCTN3 | SNV | Missense_Mutation | c.316N>A | p.Asp106Asn | p.D106N | Q6NUS6 | protein_coding | deleterious(0) | probably_damaging(0.999) | TCGA-D8-A1JA-01 | Breast | breast invasive carcinoma | Female | <65 | III/IV | Chemotherapy | adriamycin | PD | |
| TCTN3 | insertion | Frame_Shift_Ins | novel | c.505_506insGGAC | p.Leu169TrpfsTer74 | p.L169Wfs*74 | Q6NUS6 | protein_coding | TCGA-AC-A3QQ-01 | Breast | breast invasive carcinoma | Female | <65 | I/II | Unknown | Unknown | SD | ||
| TCTN3 | insertion | Frame_Shift_Ins | novel | c.62_63insAGTTAAAAACAACAACAAAAAAAAAGCAAAAAAAATGTCAAATGTT | p.Pro22ValfsTer73 | p.P22Vfs*73 | Q6NUS6 | protein_coding | TCGA-AO-A03T-01 | Breast | breast invasive carcinoma | Female | <65 | I/II | Chemotherapy | cyclophosphamide | SD | ||
| TCTN3 | SNV | Missense_Mutation | c.634N>A | p.Asp212Asn | p.D212N | Q6NUS6 | protein_coding | deleterious(0) | possibly_damaging(0.879) | TCGA-A6-5662-01 | Colorectum | colon adenocarcinoma | Male | <65 | I/II | Chemotherapy | oxaliplatin | PD | |
| TCTN3 | SNV | Missense_Mutation | c.458N>G | p.Asp153Gly | p.D153G | Q6NUS6 | protein_coding | tolerated(0.08) | possibly_damaging(0.76) | TCGA-AA-3977-01 | Colorectum | colon adenocarcinoma | Male | >=65 | I/II | Unknown | Unknown | SD | |
| TCTN3 | SNV | Missense_Mutation | c.158N>T | p.Ala53Val | p.A53V | Q6NUS6 | protein_coding | deleterious(0.04) | benign(0.028) | TCGA-AD-6889-01 | Colorectum | colon adenocarcinoma | Male | >=65 | I/II | Chemotherapy | xeloda | PD | |
| TCTN3 | SNV | Missense_Mutation | c.64N>T | p.Pro22Ser | p.P22S | Q6NUS6 | protein_coding | tolerated_low_confidence(0.17) | benign(0.018) | TCGA-AM-5821-01 | Colorectum | colon adenocarcinoma | Female | >=65 | I/II | Unknown | Unknown | SD | |
| TCTN3 | SNV | Missense_Mutation | novel | c.431C>T | p.Ser144Phe | p.S144F | Q6NUS6 | protein_coding | deleterious(0) | probably_damaging(0.985) | TCGA-AZ-4315-01 | Colorectum | colon adenocarcinoma | Male | <65 | I/II | Unknown | Unknown | SD |
| TCTN3 | SNV | Missense_Mutation | novel | c.664T>C | p.Ser222Pro | p.S222P | Q6NUS6 | protein_coding | deleterious(0) | probably_damaging(0.999) | TCGA-CM-5344-01 | Colorectum | colon adenocarcinoma | Female | <65 | III/IV | Chemotherapy | oxaliplatin | SD |
| Page: 1 2 3 4 |
Top |
Related drugs of malignant transformation related genes |
| Identification of chemicals and drugs interact with genes involved in malignant transfromation |
| (DGIdb 4.0) |
| Entrez ID | Symbol | Category | Interaction Types | Drug Claim Name | Drug Name | PMIDs |
| Page: 1 |

Copyright 2023-Present -The University of Texas Health Science Center at Houston |