
|
|||||
|
 | |
| |
| |
| |
| |
| |
|
Gene: TCTN1 |
Gene summary for TCTN1 |
| Gene information | Species | Human | Gene symbol | TCTN1 | Gene ID | 79600 |
| Gene name | tectonic family member 1 | |
| Gene Alias | JBTS13 | |
| Cytomap | 12q24.11 | |
| Gene Type | protein-coding | GO ID | GO:0000902 | UniProtAcc | B4DIB9 |
Top |
Malignant transformation analysis |
| Identification of the aberrant gene expression in precancerous and cancerous lesions by comparing the gene expression of stem-like cells in diseased tissues with normal stem cells |
| Entrez ID | Symbol | Replicates | Species | Organ | Tissue | Adj P-value | Log2FC | Malignancy |
| 79600 | TCTN1 | LZE7T | Human | Esophagus | ESCC | 3.97e-05 | 4.97e-01 | 0.0667 |
| 79600 | TCTN1 | LZE8T | Human | Esophagus | ESCC | 2.97e-03 | 2.36e-01 | 0.067 |
| 79600 | TCTN1 | LZE24T | Human | Esophagus | ESCC | 1.61e-07 | 2.98e-01 | 0.0596 |
| 79600 | TCTN1 | P1T-E | Human | Esophagus | ESCC | 1.83e-05 | 3.98e-01 | 0.0875 |
| 79600 | TCTN1 | P2T-E | Human | Esophagus | ESCC | 8.91e-87 | 1.50e+00 | 0.1177 |
| 79600 | TCTN1 | P4T-E | Human | Esophagus | ESCC | 5.84e-13 | 3.06e-01 | 0.1323 |
| 79600 | TCTN1 | P5T-E | Human | Esophagus | ESCC | 7.96e-07 | 3.28e-02 | 0.1327 |
| 79600 | TCTN1 | P8T-E | Human | Esophagus | ESCC | 1.52e-28 | 4.71e-01 | 0.0889 |
| 79600 | TCTN1 | P9T-E | Human | Esophagus | ESCC | 1.12e-13 | 1.34e-01 | 0.1131 |
| 79600 | TCTN1 | P10T-E | Human | Esophagus | ESCC | 2.88e-17 | 3.13e-01 | 0.116 |
| 79600 | TCTN1 | P11T-E | Human | Esophagus | ESCC | 1.97e-26 | 1.13e+00 | 0.1426 |
| 79600 | TCTN1 | P12T-E | Human | Esophagus | ESCC | 1.34e-21 | 2.28e-01 | 0.1122 |
| 79600 | TCTN1 | P15T-E | Human | Esophagus | ESCC | 5.04e-13 | 1.50e-01 | 0.1149 |
| 79600 | TCTN1 | P16T-E | Human | Esophagus | ESCC | 7.30e-66 | 1.10e+00 | 0.1153 |
| 79600 | TCTN1 | P17T-E | Human | Esophagus | ESCC | 3.79e-10 | 5.04e-01 | 0.1278 |
| 79600 | TCTN1 | P19T-E | Human | Esophagus | ESCC | 3.38e-05 | 6.17e-01 | 0.1662 |
| 79600 | TCTN1 | P20T-E | Human | Esophagus | ESCC | 2.59e-19 | 2.55e-01 | 0.1124 |
| 79600 | TCTN1 | P21T-E | Human | Esophagus | ESCC | 9.37e-23 | 3.73e-01 | 0.1617 |
| 79600 | TCTN1 | P22T-E | Human | Esophagus | ESCC | 1.03e-40 | 6.46e-01 | 0.1236 |
| 79600 | TCTN1 | P23T-E | Human | Esophagus | ESCC | 1.40e-15 | 2.30e-01 | 0.108 |
| Page: 1 2 3 4 5 |
| Tissue | Expression Dynamics | Abbreviation |
| Esophagus | 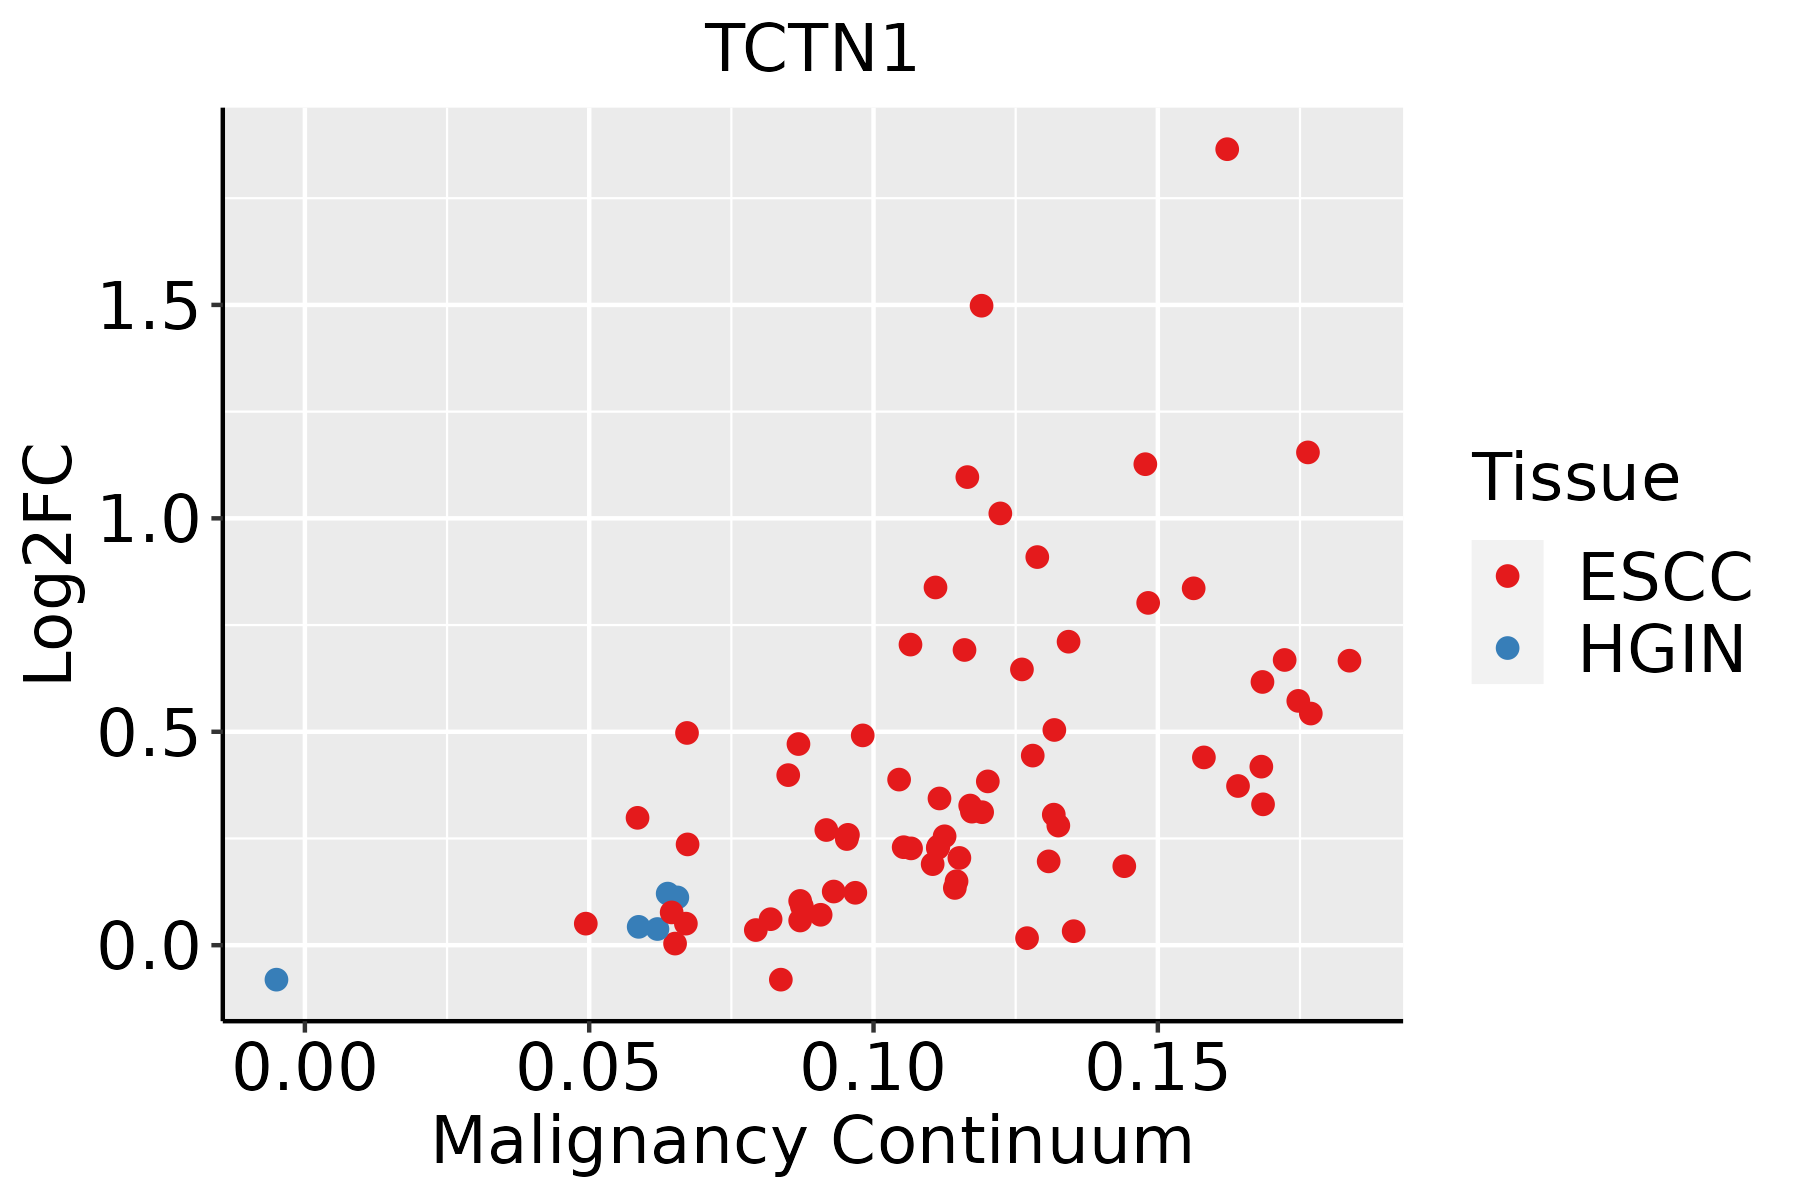 | ESCC: Esophageal squamous cell carcinoma |
| HGIN: High-grade intraepithelial neoplasias | ||
| LGIN: Low-grade intraepithelial neoplasias | ||
| Liver |  | HCC: Hepatocellular carcinoma |
| NAFLD: Non-alcoholic fatty liver disease | ||
| Oral Cavity |  | EOLP: Erosive Oral lichen planus |
| LP: leukoplakia | ||
| NEOLP: Non-erosive oral lichen planus | ||
| OSCC: Oral squamous cell carcinoma | ||
| Thyroid |  | ATC: Anaplastic thyroid cancer |
| HT: Hashimoto's thyroiditis | ||
| PTC: Papillary thyroid cancer |
| ∗log2FC in expression of this searched gene in stem-like cells from each diseased tissue sample relative to stem-like cells in normal samples in each tissue plotted against the malignancy continuum. Samples are colored based on if they are from different disease stage. |
Top |
Malignant transformation related pathway analysis |
| Find out the enriched GO biological processes and KEGG pathways involved in transition from healthy to precancer to cancer |
| Tissue | Disease Stage | Enriched GO biological Processes |
| Colorectum | AD |  |
| Colorectum | SER |  |
| Colorectum | MSS |  |
| Colorectum | MSI-H |  |
| Colorectum | FAP |  |
| ∗Top 15 enriched GO BP terms are showed in the bar plot of each disease state in each tissue. Each row represents a significant GO biological process which is colored according to the -log10(p.adjust). |
| Page: 1 2 3 4 5 6 7 8 9 |
| GO ID | Tissue | Disease Stage | Description | Gene Ratio | Bg Ratio | pvalue | p.adjust | Count |
| GO:000170119 | Esophagus | ESCC | in utero embryonic development | 243/8552 | 367/18723 | 1.00e-15 | 6.86e-14 | 243 |
| GO:000184115 | Esophagus | ESCC | neural tube formation | 75/8552 | 102/18723 | 9.68e-09 | 1.95e-07 | 75 |
| GO:00219159 | Esophagus | ESCC | neural tube development | 101/8552 | 152/18723 | 1.78e-07 | 2.79e-06 | 101 |
| GO:00163316 | Esophagus | ESCC | morphogenesis of embryonic epithelium | 98/8552 | 147/18723 | 2.12e-07 | 3.27e-06 | 98 |
| GO:000183814 | Esophagus | ESCC | embryonic epithelial tube formation | 83/8552 | 121/18723 | 2.78e-07 | 4.08e-06 | 83 |
| GO:003514815 | Esophagus | ESCC | tube formation | 96/8552 | 148/18723 | 1.86e-06 | 2.16e-05 | 96 |
| GO:00721759 | Esophagus | ESCC | epithelial tube formation | 86/8552 | 132/18723 | 4.81e-06 | 5.10e-05 | 86 |
| GO:006056210 | Esophagus | ESCC | epithelial tube morphogenesis | 187/8552 | 325/18723 | 9.95e-06 | 9.44e-05 | 187 |
| GO:006156415 | Esophagus | ESCC | axon development | 251/8552 | 467/18723 | 2.41e-04 | 1.49e-03 | 251 |
| GO:000740915 | Esophagus | ESCC | axonogenesis | 219/8552 | 418/18723 | 3.14e-03 | 1.31e-02 | 219 |
| GO:00017015 | Liver | Cirrhotic | in utero embryonic development | 134/4634 | 367/18723 | 2.78e-07 | 6.86e-06 | 134 |
| GO:000170111 | Liver | HCC | in utero embryonic development | 204/7958 | 367/18723 | 2.44e-07 | 4.30e-06 | 204 |
| GO:00018415 | Liver | HCC | neural tube formation | 62/7958 | 102/18723 | 1.47e-04 | 1.18e-03 | 62 |
| GO:00219154 | Liver | HCC | neural tube development | 82/7958 | 152/18723 | 2.83e-03 | 1.33e-02 | 82 |
| GO:00018384 | Liver | HCC | embryonic epithelial tube formation | 66/7958 | 121/18723 | 4.94e-03 | 2.07e-02 | 66 |
| GO:00721754 | Liver | HCC | epithelial tube formation | 70/7958 | 132/18723 | 9.29e-03 | 3.57e-02 | 70 |
| GO:00351484 | Liver | HCC | tube formation | 77/7958 | 148/18723 | 1.20e-02 | 4.39e-02 | 77 |
| GO:000170116 | Oral cavity | OSCC | in utero embryonic development | 207/7305 | 367/18723 | 7.92e-12 | 2.95e-10 | 207 |
| GO:000184110 | Oral cavity | OSCC | neural tube formation | 60/7305 | 102/18723 | 3.90e-05 | 3.43e-04 | 60 |
| GO:00018388 | Oral cavity | OSCC | embryonic epithelial tube formation | 66/7305 | 121/18723 | 3.70e-04 | 2.26e-03 | 66 |
| Page: 1 2 3 |
| Pathway ID | Tissue | Disease Stage | Description | Gene Ratio | Bg Ratio | pvalue | p.adjust | qvalue | Count |
| Page: 1 |
Top |
Cell-cell communication analysis |
| Identification of potential cell-cell interactions between two cell types and their ligand-receptor pairs for different disease states |
| Ligand | Receptor | LRpair | Pathway | Tissue | Disease Stage |
| Page: 1 |
Top |
Single-cell gene regulatory network inference analysis |
| Find out the significant the regulons (TFs) and the target genes of each regulon across cell types for different disease states |
| TF | Cell Type | Tissue | Disease Stage | Target Gene | RSS | Regulon Activity |
| ∗The dot plots of a searched regulon are shown for all cell subpopulations in each disease state of each tissue based on the regulon specific score inferred using pySCENIC and by calculating the average expression. |
| Page: 1 |
Top |
Somatic mutation of malignant transformation related genes |
| Annotation of somatic variants for genes involved in malignant transformation |
| Hugo Symbol | Variant Class | Variant Classification | dbSNP RS | HGVSc | HGVSp | HGVSp Short | SWISSPROT | BIOTYPE | SIFT | PolyPhen | Tumor Sample Barcode | Tissue | Histology | Sex | Age | Stage | Therapy Types | Drugs | Outcome |
| TCTN1 | SNV | Missense_Mutation | c.1391G>C | p.Gly464Ala | p.G464A | Q2MV58 | protein_coding | deleterious(0) | probably_damaging(1) | TCGA-AN-A0FW-01 | Breast | breast invasive carcinoma | Female | >=65 | III/IV | Unknown | Unknown | SD | |
| TCTN1 | SNV | Missense_Mutation | c.402N>A | p.Asn134Lys | p.N134K | Q2MV58 | protein_coding | deleterious(0.03) | benign(0.117) | TCGA-BH-A0BQ-01 | Breast | breast invasive carcinoma | Female | <65 | I/II | Unknown | Unknown | PD | |
| TCTN1 | SNV | Missense_Mutation | novel | c.1556N>A | p.Thr519Asn | p.T519N | Q2MV58 | protein_coding | deleterious(0) | probably_damaging(0.999) | TCGA-LL-A441-01 | Breast | breast invasive carcinoma | Female | <65 | I/II | Chemotherapy | taxotere | CR |
| TCTN1 | SNV | Missense_Mutation | rs753674051 | c.1411N>A | p.Val471Met | p.V471M | Q2MV58 | protein_coding | deleterious(0) | probably_damaging(0.982) | TCGA-OL-A5D6-01 | Breast | breast invasive carcinoma | Female | >=65 | I/II | Unknown | Unknown | SD |
| TCTN1 | SNV | Missense_Mutation | novel | c.820A>T | p.Arg274Trp | p.R274W | Q2MV58 | protein_coding | deleterious(0.01) | possibly_damaging(0.575) | TCGA-XX-A899-01 | Breast | breast invasive carcinoma | Female | <65 | III/IV | Chemotherapy | cytoxan | CR |
| TCTN1 | insertion | Frame_Shift_Ins | novel | c.686_687insCAGCCACCTAGTTCCTG | p.Leu230SerfsTer18 | p.L230Sfs*18 | Q2MV58 | protein_coding | TCGA-AN-A0FK-01 | Breast | breast invasive carcinoma | Female | >=65 | III/IV | Unknown | Unknown | SD | ||
| TCTN1 | SNV | Missense_Mutation | rs369266915 | c.1283N>A | p.Arg428Gln | p.R428Q | Q2MV58 | protein_coding | deleterious(0) | probably_damaging(0.999) | TCGA-C5-A902-01 | Cervix | cervical & endocervical cancer | Female | <65 | I/II | Chemotherapy | cisplatin | SD |
| TCTN1 | SNV | Missense_Mutation | rs780494395 | c.424N>T | p.Leu142Phe | p.L142F | Q2MV58 | protein_coding | deleterious(0.01) | possibly_damaging(0.89) | TCGA-VS-A8EC-01 | Cervix | cervical & endocervical cancer | Female | <65 | III/IV | Chemotherapy | carboplatin | CR |
| TCTN1 | SNV | Missense_Mutation | c.382T>C | p.Ser128Pro | p.S128P | Q2MV58 | protein_coding | deleterious(0) | probably_damaging(0.942) | TCGA-A6-A566-01 | Colorectum | colon adenocarcinoma | Female | <65 | III/IV | Chemotherapy | oxaliplatin | PD | |
| TCTN1 | SNV | Missense_Mutation | novel | c.1489N>T | p.Arg497Trp | p.R497W | Q2MV58 | protein_coding | deleterious(0.02) | possibly_damaging(0.598) | TCGA-AA-3821-01 | Colorectum | colon adenocarcinoma | Female | >=65 | I/II | Unknown | Unknown | SD |
| Page: 1 2 3 4 5 |
Top |
Related drugs of malignant transformation related genes |
| Identification of chemicals and drugs interact with genes involved in malignant transfromation |
| (DGIdb 4.0) |
| Entrez ID | Symbol | Category | Interaction Types | Drug Claim Name | Drug Name | PMIDs |
| Page: 1 |

Copyright 2023-Present -The University of Texas Health Science Center at Houston |