
|
|||||
|
 | |
| |
| |
| |
| |
| |
|
Gene: TCTEX1D2 |
Gene summary for TCTEX1D2 |
| Gene information | Species | Human | Gene symbol | TCTEX1D2 | Gene ID | 255758 |
| Gene name | dynein light chain Tctex-type 2B | |
| Gene Alias | SRTD17 | |
| Cytomap | 3q29 | |
| Gene Type | protein-coding | GO ID | GO:0006810 | UniProtAcc | Q8WW35 |
Top |
Malignant transformation analysis |
| Identification of the aberrant gene expression in precancerous and cancerous lesions by comparing the gene expression of stem-like cells in diseased tissues with normal stem cells |
| Entrez ID | Symbol | Replicates | Species | Organ | Tissue | Adj P-value | Log2FC | Malignancy |
| 255758 | TCTEX1D2 | GSM4909285 | Human | Breast | IDC | 5.83e-55 | 8.90e-01 | 0.21 |
| 255758 | TCTEX1D2 | GSM4909294 | Human | Breast | IDC | 4.68e-02 | 3.15e-01 | 0.2022 |
| 255758 | TCTEX1D2 | GSM4909308 | Human | Breast | IDC | 1.96e-02 | 1.93e-01 | 0.158 |
| 255758 | TCTEX1D2 | GSM4909315 | Human | Breast | IDC | 1.63e-03 | 3.13e-01 | 0.21 |
| 255758 | TCTEX1D2 | GSM4909316 | Human | Breast | IDC | 9.72e-03 | 4.48e-01 | 0.21 |
| 255758 | TCTEX1D2 | GSM4909319 | Human | Breast | IDC | 2.97e-03 | -4.56e-02 | 0.1563 |
| 255758 | TCTEX1D2 | P2 | Human | Breast | IDC | 3.08e-08 | 5.15e-01 | 0.21 |
| 255758 | TCTEX1D2 | DCIS2 | Human | Breast | DCIS | 9.33e-15 | 3.36e-02 | 0.0085 |
| 255758 | TCTEX1D2 | LZE2D | Human | Esophagus | HGIN | 4.00e-04 | 2.84e-01 | 0.0642 |
| 255758 | TCTEX1D2 | LZE2T | Human | Esophagus | ESCC | 9.30e-05 | 1.21e+00 | 0.082 |
| 255758 | TCTEX1D2 | LZE4T | Human | Esophagus | ESCC | 2.05e-08 | 4.52e-01 | 0.0811 |
| 255758 | TCTEX1D2 | LZE7T | Human | Esophagus | ESCC | 4.86e-16 | 1.05e+00 | 0.0667 |
| 255758 | TCTEX1D2 | LZE8T | Human | Esophagus | ESCC | 1.33e-05 | 4.04e-01 | 0.067 |
| 255758 | TCTEX1D2 | LZE20T | Human | Esophagus | ESCC | 1.36e-14 | 4.65e-01 | 0.0662 |
| 255758 | TCTEX1D2 | LZE22D1 | Human | Esophagus | HGIN | 3.14e-06 | 2.99e-01 | 0.0595 |
| 255758 | TCTEX1D2 | LZE22T | Human | Esophagus | ESCC | 1.78e-06 | 7.42e-01 | 0.068 |
| 255758 | TCTEX1D2 | LZE24T | Human | Esophagus | ESCC | 1.72e-09 | 5.99e-01 | 0.0596 |
| 255758 | TCTEX1D2 | LZE21T | Human | Esophagus | ESCC | 2.51e-10 | 1.08e+00 | 0.0655 |
| 255758 | TCTEX1D2 | LZE6T | Human | Esophagus | ESCC | 3.12e-08 | 6.79e-01 | 0.0845 |
| 255758 | TCTEX1D2 | P1T-E | Human | Esophagus | ESCC | 3.03e-19 | 5.89e-01 | 0.0875 |
| Page: 1 2 3 4 5 6 |
| Tissue | Expression Dynamics | Abbreviation |
| Breast | 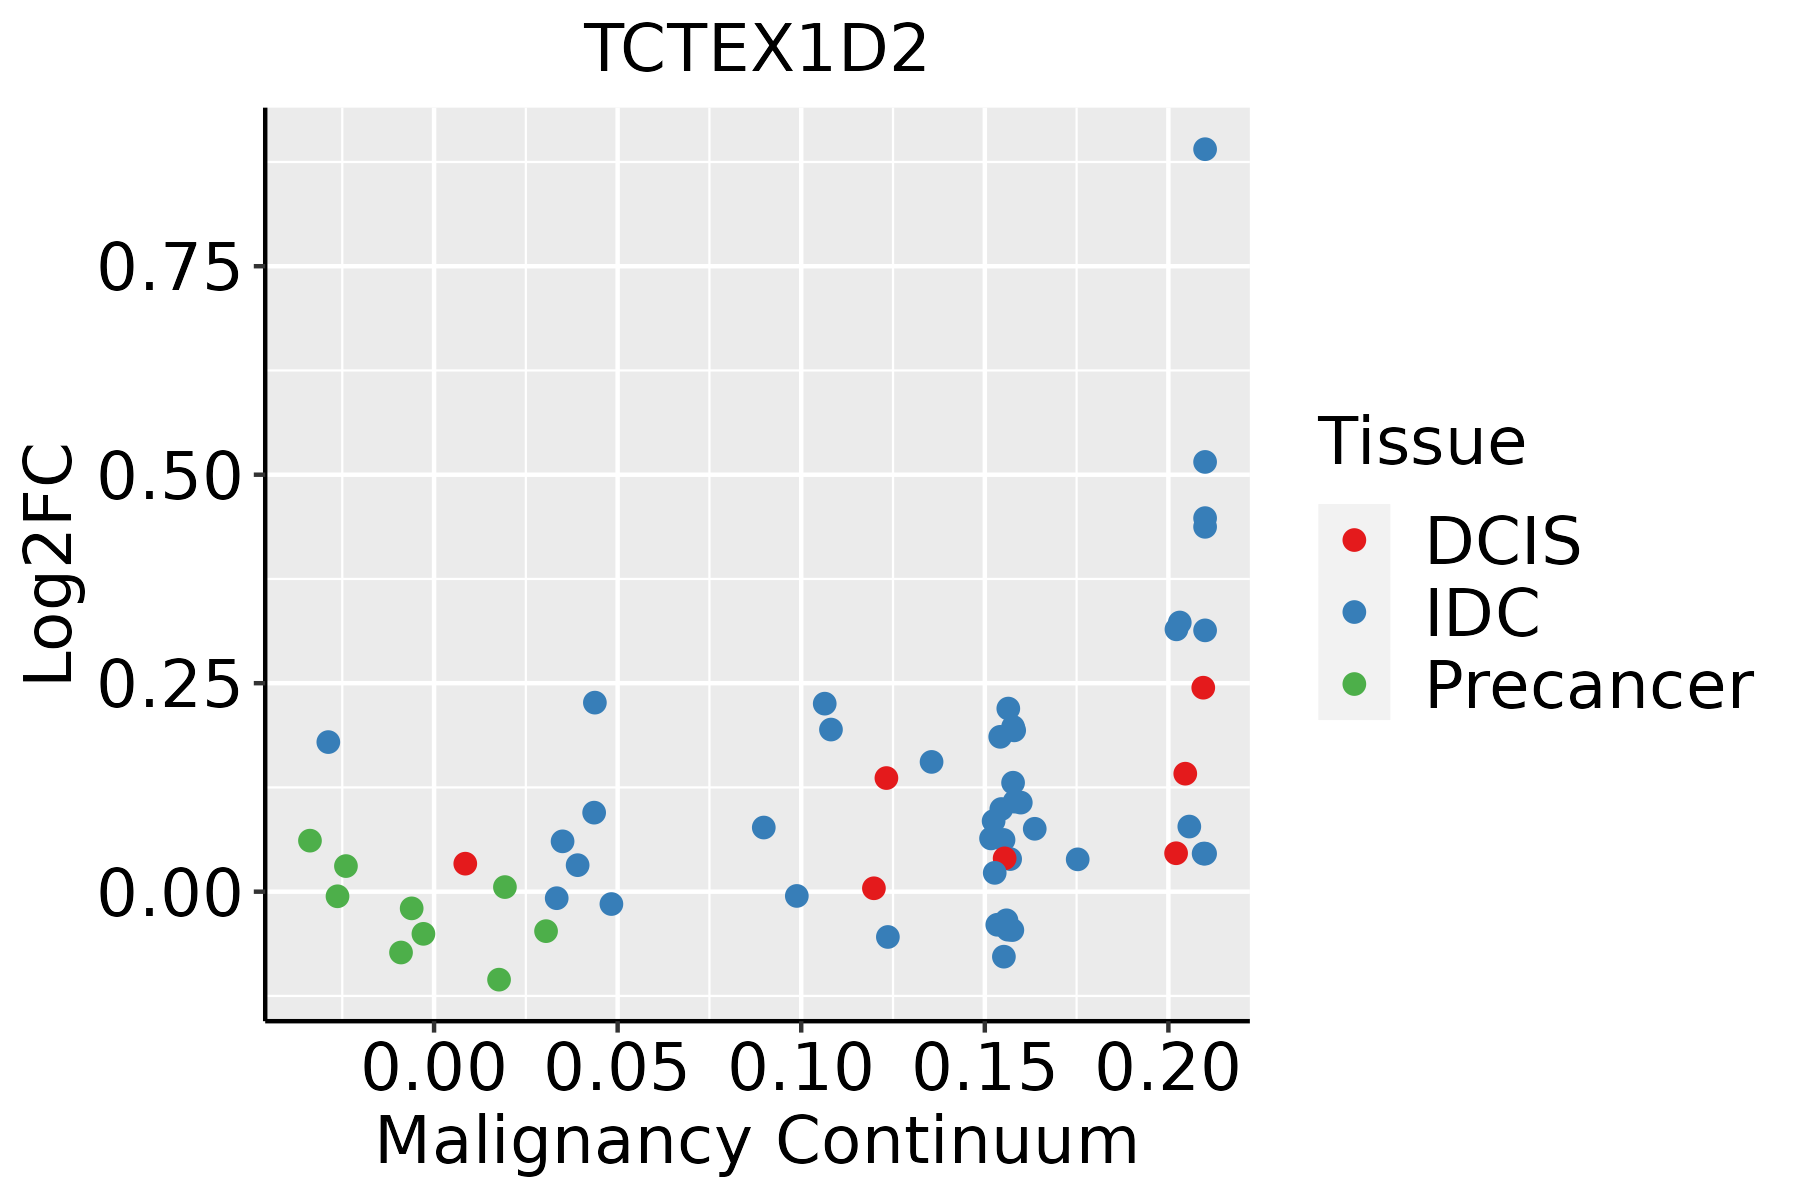 | IDC: Invasive ductal carcinoma |
| DCIS: Ductal carcinoma in situ | ||
| Precancer(BRCA1-mut): Precancerous lesion from BRCA1 mutation carriers | ||
| Esophagus |  | ESCC: Esophageal squamous cell carcinoma |
| HGIN: High-grade intraepithelial neoplasias | ||
| LGIN: Low-grade intraepithelial neoplasias | ||
| Oral Cavity | 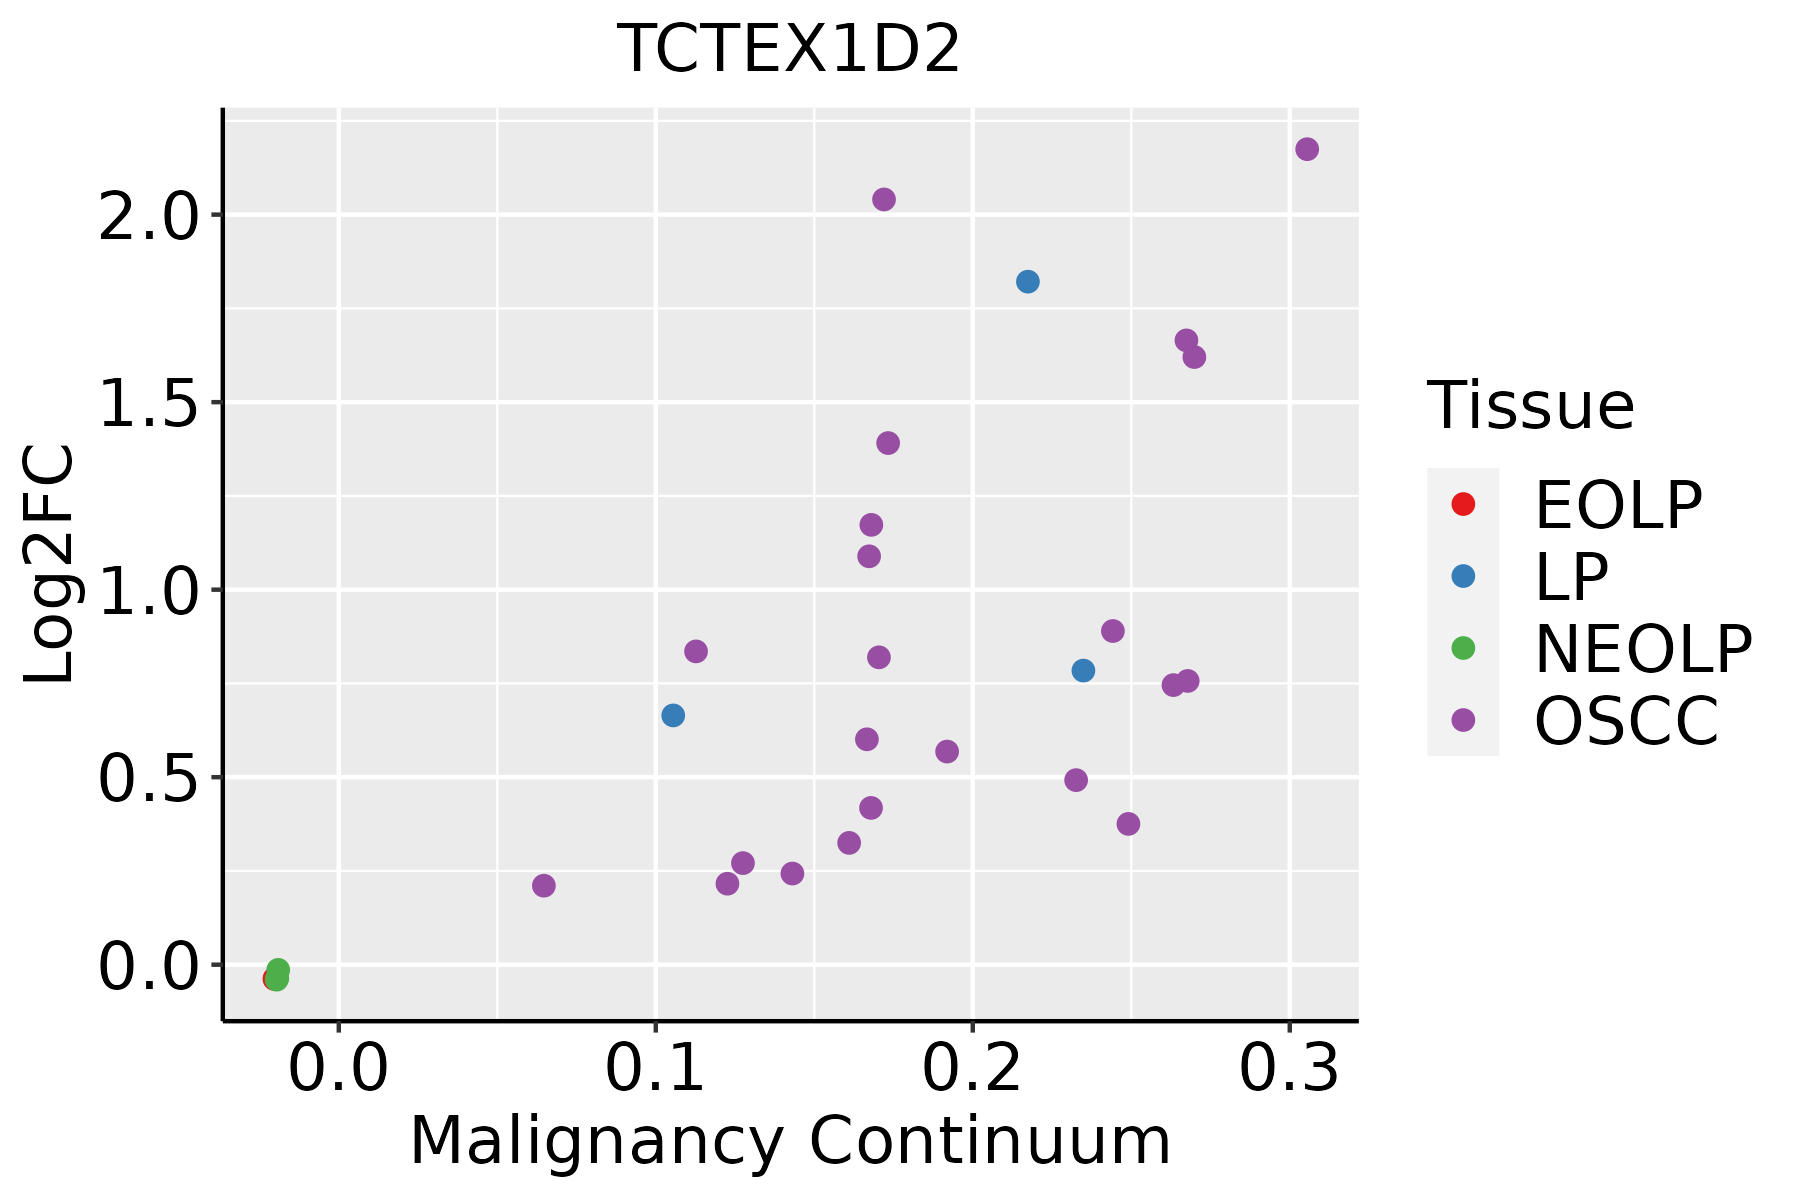 | EOLP: Erosive Oral lichen planus |
| LP: leukoplakia | ||
| NEOLP: Non-erosive oral lichen planus | ||
| OSCC: Oral squamous cell carcinoma | ||
| Skin |  | AK: Actinic keratosis |
| cSCC: Cutaneous squamous cell carcinoma | ||
| SCCIS:squamous cell carcinoma in situ |
| ∗log2FC in expression of this searched gene in stem-like cells from each diseased tissue sample relative to stem-like cells in normal samples in each tissue plotted against the malignancy continuum. Samples are colored based on if they are from different disease stage. |
Top |
Malignant transformation related pathway analysis |
| Find out the enriched GO biological processes and KEGG pathways involved in transition from healthy to precancer to cancer |
| Tissue | Disease Stage | Enriched GO biological Processes |
| Colorectum | AD |  |
| Colorectum | SER |  |
| Colorectum | MSS |  |
| Colorectum | MSI-H |  |
| Colorectum | FAP |  |
| ∗Top 15 enriched GO BP terms are showed in the bar plot of each disease state in each tissue. Each row represents a significant GO biological process which is colored according to the -log10(p.adjust). |
| Page: 1 2 3 4 5 6 7 8 9 |
| GO ID | Tissue | Disease Stage | Description | Gene Ratio | Bg Ratio | pvalue | p.adjust | Count |
| Page: 1 |
| Pathway ID | Tissue | Disease Stage | Description | Gene Ratio | Bg Ratio | pvalue | p.adjust | qvalue | Count |
| Page: 1 |
Top |
Cell-cell communication analysis |
| Identification of potential cell-cell interactions between two cell types and their ligand-receptor pairs for different disease states |
| Ligand | Receptor | LRpair | Pathway | Tissue | Disease Stage |
| Page: 1 |
Top |
Single-cell gene regulatory network inference analysis |
| Find out the significant the regulons (TFs) and the target genes of each regulon across cell types for different disease states |
| TF | Cell Type | Tissue | Disease Stage | Target Gene | RSS | Regulon Activity |
| ∗The dot plots of a searched regulon are shown for all cell subpopulations in each disease state of each tissue based on the regulon specific score inferred using pySCENIC and by calculating the average expression. |
| Page: 1 |
Top |
Somatic mutation of malignant transformation related genes |
| Annotation of somatic variants for genes involved in malignant transformation |
| Hugo Symbol | Variant Class | Variant Classification | dbSNP RS | HGVSc | HGVSp | HGVSp Short | SWISSPROT | BIOTYPE | SIFT | PolyPhen | Tumor Sample Barcode | Tissue | Histology | Sex | Age | Stage | Therapy Types | Drugs | Outcome |
| TCTEX1D2 | deletion | In_Frame_Del | c.52_57delGCTGAG | p.Ala18_Glu19del | p.A18_E19del | Q8WW35 | protein_coding | TCGA-A2-A25E-01 | Breast | breast invasive carcinoma | Female | <65 | III/IV | Chemotherapy | cytoxan | PD | |||
| TCTEX1D2 | SNV | Missense_Mutation | c.221N>T | p.Ser74Leu | p.S74L | Q8WW35 | protein_coding | deleterious(0) | possibly_damaging(0.688) | TCGA-EA-A3HU-01 | Cervix | cervical & endocervical cancer | Female | <65 | I/II | Unknown | Unknown | SD | |
| TCTEX1D2 | SNV | Missense_Mutation | novel | c.125N>T | p.Ser42Phe | p.S42F | Q8WW35 | protein_coding | deleterious(0.02) | possibly_damaging(0.889) | TCGA-EA-A3HU-01 | Cervix | cervical & endocervical cancer | Female | <65 | I/II | Unknown | Unknown | SD |
| TCTEX1D2 | SNV | Missense_Mutation | c.221C>T | p.Ser74Leu | p.S74L | Q8WW35 | protein_coding | deleterious(0) | possibly_damaging(0.688) | TCGA-IR-A3LB-01 | Cervix | cervical & endocervical cancer | Female | <65 | I/II | Chemotherapy | cisplatin | PD | |
| TCTEX1D2 | SNV | Missense_Mutation | c.185N>G | p.Ser62Cys | p.S62C | Q8WW35 | protein_coding | deleterious(0.05) | benign(0.021) | TCGA-JW-A5VL-01 | Cervix | cervical & endocervical cancer | Female | <65 | I/II | Unknown | Unknown | SD | |
| TCTEX1D2 | SNV | Missense_Mutation | c.49N>A | p.Glu17Lys | p.E17K | Q8WW35 | protein_coding | tolerated(0.05) | benign(0.081) | TCGA-JX-A3Q0-01 | Cervix | cervical & endocervical cancer | Female | <65 | III/IV | Unknown | Unknown | SD | |
| TCTEX1D2 | SNV | Missense_Mutation | novel | c.78N>T | p.Glu26Asp | p.E26D | Q8WW35 | protein_coding | tolerated(0.11) | benign(0.218) | TCGA-AA-A00N-01 | Colorectum | colon adenocarcinoma | Male | >=65 | I/II | Unknown | Unknown | PD |
| TCTEX1D2 | SNV | Missense_Mutation | novel | c.373N>G | p.Phe125Val | p.F125V | Q8WW35 | protein_coding | deleterious(0) | probably_damaging(0.99) | TCGA-CA-6717-01 | Colorectum | colon adenocarcinoma | Male | <65 | I/II | Chemotherapy | oxaliplatin | CR |
| TCTEX1D2 | SNV | Missense_Mutation | rs774457947 | c.329N>A | p.Arg110His | p.R110H | Q8WW35 | protein_coding | deleterious(0) | probably_damaging(0.997) | TCGA-A5-A0G2-01 | Endometrium | uterine corpus endometrioid carcinoma | Female | <65 | III/IV | Unknown | Unknown | SD |
| TCTEX1D2 | SNV | Missense_Mutation | c.367N>T | p.Asp123Tyr | p.D123Y | Q8WW35 | protein_coding | deleterious(0) | possibly_damaging(0.688) | TCGA-AX-A05Z-01 | Endometrium | uterine corpus endometrioid carcinoma | Female | <65 | III/IV | Chemotherapy | adriamycin | SD |
| Page: 1 2 |
Top |
Related drugs of malignant transformation related genes |
| Identification of chemicals and drugs interact with genes involved in malignant transfromation |
| (DGIdb 4.0) |
| Entrez ID | Symbol | Category | Interaction Types | Drug Claim Name | Drug Name | PMIDs |
| Page: 1 |

Copyright 2023-Present -The University of Texas Health Science Center at Houston |