Schematic overview of the cellular and molecular mechanisms involved in the cancer progression, including the proposed cellular and molecular mechanisms in cancer cells trajectory. AT1: alveolar type 1 cells; AT2: alveolar type 2 cells; AAH: atypical adenomatous hyperplasia; AIS: adenocarcinoma in situ; MIA: minimally invasive adenocarcinoma; IA: invasive adenocarcinoma; EMT: epithelial-mesenchymal transition

Home

Download

Statistics

Help

Contact

Center for Computational Systems Medicine
leaf

Gene summary

leaf

Malignant transformation analysis

leaf

Malignant transformation related pathway analysis

leaf

Cell-cell communication analysis

leaf

Single-cell gene regulatory network inference analysis

leaf

Somatic mutation of malignant transformation related genes

leaf

Related drugs of malignant transformation related genes

Gene: TCOF1

Gene summary for TCOF1

check button Gene summary.

Gene informationSpeciesHuman
Gene symbol

TCOF1

Gene ID

6949

Gene nametreacle ribosome biogenesis factor 1
Gene AliasMFD1
Cytomap5q32-q33.1
Gene Typeprotein-coding
GO ID

GO:0001501

UniProtAcc

Q13428


Top

Malignant transformation analysis

check button Identification of the aberrant gene expression in precancerous and cancerous lesions by comparing the gene expression of stem-like cells in diseased tissues with normal stem cells
check button Malignant transformation involving gene list.
Entrez IDSymbolReplicatesSpeciesOrganTissueAdj P-valueLog2FCMalignancy
6949TCOF1LZE4THumanEsophagusESCC1.18e-071.50e-010.0811
6949TCOF1LZE7THumanEsophagusESCC1.26e-053.23e-010.0667
6949TCOF1LZE8THumanEsophagusESCC9.63e-079.79e-020.067
6949TCOF1LZE20THumanEsophagusESCC3.65e-033.91e-020.0662
6949TCOF1LZE24THumanEsophagusESCC1.38e-093.35e-010.0596
6949TCOF1LZE21THumanEsophagusESCC5.31e-053.58e-010.0655
6949TCOF1P1T-EHumanEsophagusESCC9.59e-033.23e-010.0875
6949TCOF1P2T-EHumanEsophagusESCC2.29e-216.21e-010.1177
6949TCOF1P4T-EHumanEsophagusESCC1.19e-164.32e-010.1323
6949TCOF1P5T-EHumanEsophagusESCC4.06e-255.37e-010.1327
6949TCOF1P8T-EHumanEsophagusESCC4.83e-121.80e-010.0889
6949TCOF1P9T-EHumanEsophagusESCC6.41e-092.29e-010.1131
6949TCOF1P10T-EHumanEsophagusESCC5.16e-163.16e-010.116
6949TCOF1P11T-EHumanEsophagusESCC6.73e-103.74e-010.1426
6949TCOF1P12T-EHumanEsophagusESCC1.83e-174.46e-010.1122
6949TCOF1P15T-EHumanEsophagusESCC6.10e-164.21e-010.1149
6949TCOF1P16T-EHumanEsophagusESCC9.05e-163.02e-010.1153
6949TCOF1P17T-EHumanEsophagusESCC7.62e-117.21e-010.1278
6949TCOF1P19T-EHumanEsophagusESCC1.62e-024.54e-010.1662
6949TCOF1P20T-EHumanEsophagusESCC5.24e-112.39e-010.1124
Page: 1 2 3 4 5 6 

check button Transcriptomic changes along malignancy continuum.
TissueExpression DynamicsAbbreviation
EsophagusThe image shows the transcriptomic changes along malignancy continuum.log2FC in expression of this searched gene in stem-like cells from each diseased tissue sample relative to stem-like cells in normal samples in each tissue plotted against the malignancy continuum. Samples are colored based on if they are from different disease stage.ESCC: Esophageal squamous cell carcinoma
HGIN: High-grade intraepithelial neoplasias
LGIN: Low-grade intraepithelial neoplasias
LiverThe image shows the transcriptomic changes along malignancy continuum.log2FC in expression of this searched gene in stem-like cells from each diseased tissue sample relative to stem-like cells in normal samples in each tissue plotted against the malignancy continuum. Samples are colored based on if they are from different disease stage.HCC: Hepatocellular carcinoma
NAFLD: Non-alcoholic fatty liver disease
Oral CavityThe image shows the transcriptomic changes along malignancy continuum.log2FC in expression of this searched gene in stem-like cells from each diseased tissue sample relative to stem-like cells in normal samples in each tissue plotted against the malignancy continuum. Samples are colored based on if they are from different disease stage.
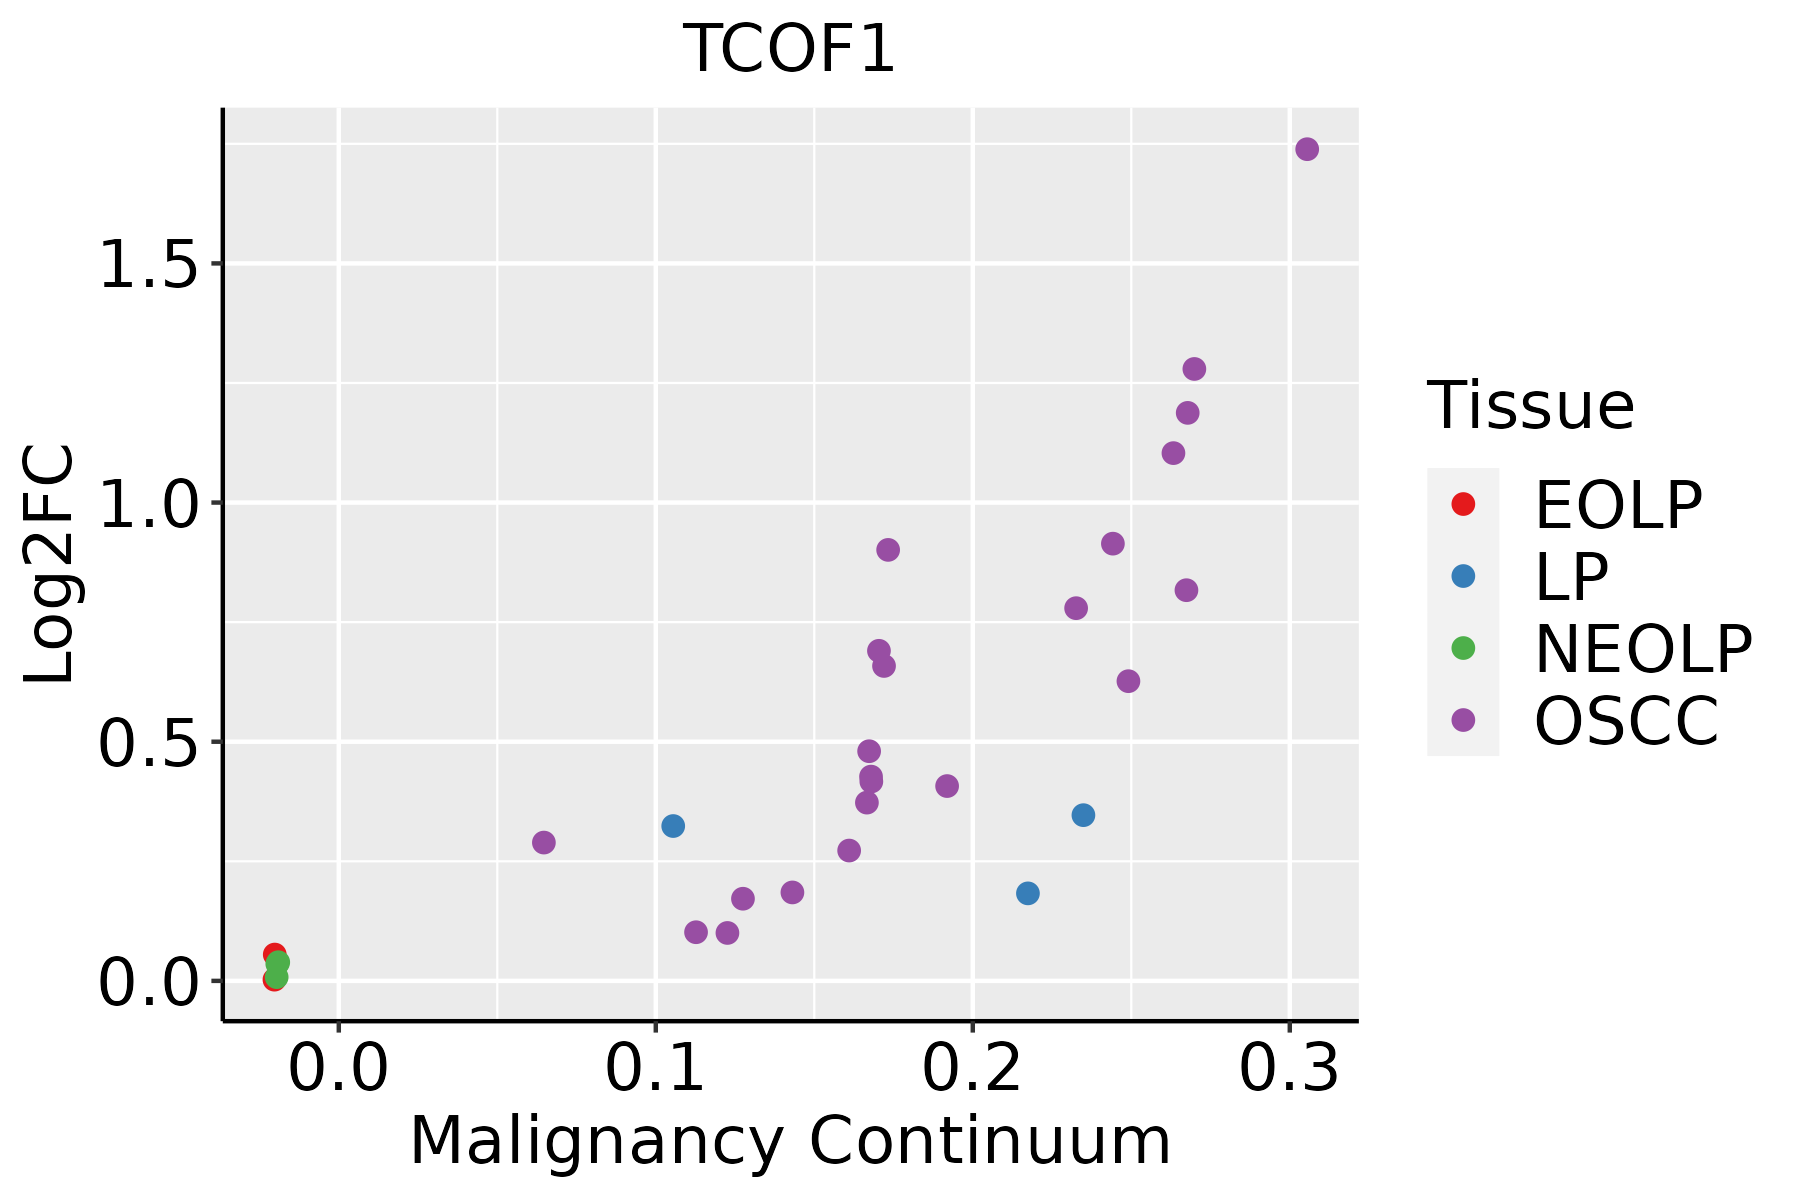
EOLP: Erosive Oral lichen planus
LP: leukoplakia
NEOLP: Non-erosive oral lichen planus
OSCC: Oral squamous cell carcinoma
SkinThe image shows the transcriptomic changes along malignancy continuum.log2FC in expression of this searched gene in stem-like cells from each diseased tissue sample relative to stem-like cells in normal samples in each tissue plotted against the malignancy continuum. Samples are colored based on if they are from different disease stage.AK: Actinic keratosis
cSCC: Cutaneous squamous cell carcinoma
SCCIS:squamous cell carcinoma in situ
ThyroidThe image shows the transcriptomic changes along malignancy continuum.log2FC in expression of this searched gene in stem-like cells from each diseased tissue sample relative to stem-like cells in normal samples in each tissue plotted against the malignancy continuum. Samples are colored based on if they are from different disease stage.ATC: Anaplastic thyroid cancer
HT: Hashimoto's thyroiditis
PTC: Papillary thyroid cancer
∗log2FC in expression of this searched gene in stem-like cells from each diseased tissue sample relative to stem-like cells in normal samples in each tissue plotted against the malignancy continuum. Samples are colored based on if they are from different disease stage.

Top

Malignant transformation related pathway analysis

check buttonFind out the enriched GO biological processes and KEGG pathways involved in transition from healthy to precancer to cancer
check button Figure of enriched GO biological processes.
TissueDisease StageEnriched GO biological Processes
ColorectumADGO analysis - Figure of enriched GO biological processes: Top 15 enriched GO BP terms are showed in the bar plot of each disease state in each tissue. Each row represents a significant GO biological process which is colored according to the -log10(p.adjust).
ColorectumSERGO analysis - Figure of enriched GO biological processes: Top 15 enriched GO BP terms are showed in the bar plot of each disease state in each tissue. Each row represents a significant GO biological process which is colored according to the -log10(p.adjust).
ColorectumMSSGO analysis - Figure of enriched GO biological processes: Top 15 enriched GO BP terms are showed in the bar plot of each disease state in each tissue. Each row represents a significant GO biological process which is colored according to the -log10(p.adjust).
ColorectumMSI-HGO analysis - Figure of enriched GO biological processes: Top 15 enriched GO BP terms are showed in the bar plot of each disease state in each tissue. Each row represents a significant GO biological process which is colored according to the -log10(p.adjust).
ColorectumFAPGO analysis - Figure of enriched GO biological processes: Top 15 enriched GO BP terms are showed in the bar plot of each disease state in each tissue. Each row represents a significant GO biological process which is colored according to the -log10(p.adjust).
∗Top 15 enriched GO BP terms are showed in the bar plot of each disease state in each tissue. Each row represents a significant GO biological process which is colored according to the -log10(p.adjust).
Page: 1 2 3 4 5 6 7 8 9 

check button Enriched GO biological processes.
GO IDTissueDisease StageDescriptionGene RatioBg Ratiopvaluep.adjustCount
GO:0006417111EsophagusESCCregulation of translation304/8552468/187231.53e-171.33e-15304
GO:00987812EsophagusESCCncRNA transcription45/855256/187231.05e-071.72e-0645
GO:00063602EsophagusESCCtranscription by RNA polymerase I42/855255/187233.41e-063.78e-0542
GO:00093032EsophagusESCCrRNA transcription28/855234/187231.21e-051.12e-0428
GO:00488638EsophagusESCCstem cell differentiation122/8552206/187235.95e-054.59e-04122
GO:00018378EsophagusESCCepithelial to mesenchymal transition95/8552157/187231.25e-048.56e-0495
GO:00487628EsophagusESCCmesenchymal cell differentiation133/8552236/187235.94e-043.22e-03133
GO:00427902EsophagusESCCnucleolar large rRNA transcription by RNA polymerase I15/855218/187231.20e-035.88e-0315
GO:00604856EsophagusESCCmesenchyme development156/8552291/187233.76e-031.53e-02156
GO:000641712LiverCirrhoticregulation of translation194/4634468/187237.28e-168.79e-14194
GO:004886311LiverCirrhoticstem cell differentiation66/4634206/187231.06e-024.68e-0266
GO:000641722LiverHCCregulation of translation287/7958468/187238.79e-178.08e-15287
GO:0009303LiverHCCrRNA transcription25/795834/187232.42e-041.81e-0325
GO:0006360LiverHCCtranscription by RNA polymerase I36/795855/187234.94e-043.23e-0336
GO:0098781LiverHCCncRNA transcription33/795856/187239.64e-033.63e-0233
GO:0042790LiverHCCnucleolar large rRNA transcription by RNA polymerase I13/795818/187231.05e-023.89e-0213
GO:000641720Oral cavityOSCCregulation of translation274/7305468/187234.39e-184.63e-16274
GO:00987811Oral cavityOSCCncRNA transcription38/730556/187231.15e-051.18e-0438
GO:00063601Oral cavityOSCCtranscription by RNA polymerase I36/730555/187236.42e-055.22e-0436
GO:00093031Oral cavityOSCCrRNA transcription24/730534/187231.89e-041.28e-0324
Page: 1 2 3 

check button Enriched KEGG pathways.
Pathway IDTissueDisease StageDescriptionGene RatioBg Ratiopvaluep.adjustqvalueCount
Page: 1 

Top

Cell-cell communication analysis

check buttonIdentification of potential cell-cell interactions between two cell types and their ligand-receptor pairs for different disease states
LigandReceptorLRpairPathwayTissueDisease Stage
Page: 1 

Top

Single-cell gene regulatory network inference analysis

check buttonFind out the significant the regulons (TFs) and the target genes of each regulon across cell types for different disease states
TFCell TypeTissueDisease StageTarget GeneRSSRegulon Activity
∗The dot plots of a searched regulon are shown for all cell subpopulations in each disease state of each tissue based on the regulon specific score inferred using pySCENIC and by calculating the average expression.
Page: 1 

Top

Somatic mutation of malignant transformation related genes

check buttonAnnotation of somatic variants for genes involved in malignant transformation
Hugo SymbolVariant ClassVariant ClassificationdbSNP RSHGVScHGVSpHGVSp ShortSWISSPROTBIOTYPESIFTPolyPhenTumor Sample BarcodeTissueHistologySexAgeStageTherapy TypesDrugsOutcome
TCOF1SNVMissense_Mutationnovelc.3659A>Gp.Lys1220Argp.K1220RQ13428protein_codingdeleterious(0.01)probably_damaging(0.971)TCGA-A8-A08G-01Breastbreast invasive carcinomaFemale<65I/IIChemotherapy5-fluorouracilCR
TCOF1SNVMissense_Mutationc.3475N>Cp.Asp1159Hisp.D1159HQ13428protein_codingdeleterious(0)possibly_damaging(0.819)TCGA-AC-A23H-01Breastbreast invasive carcinomaFemale>=65I/IIUnknownUnknownPD
TCOF1SNVMissense_Mutationc.2048N>Tp.Ala683Valp.A683VQ13428protein_codingtolerated(0.1)benign(0.228)TCGA-BH-A1F6-01Breastbreast invasive carcinomaFemale<65III/IVUnknownUnknownSD
TCOF1SNVMissense_Mutationc.3707N>Tp.Ala1236Valp.A1236VQ13428protein_codingtolerated(0.12)benign(0.168)TCGA-E2-A15O-01Breastbreast invasive carcinomaFemale>=65I/IIHormone TherapyarimidexPD
TCOF1SNVMissense_Mutationc.3908N>Tp.Pro1303Leup.P1303LQ13428protein_codingdeleterious(0)possibly_damaging(0.781)TCGA-E2-A1LG-01Breastbreast invasive carcinomaFemale<65I/IIChemotherapydoxorubicinSD
TCOF1insertionFrame_Shift_Insnovelc.3661_3662insACCTGACTTTGCTGTTTGAp.Ala1221AspfsTer26p.A1221Dfs*26Q13428protein_codingTCGA-A8-A08G-01Breastbreast invasive carcinomaFemale<65I/IIChemotherapy5-fluorouracilCR
TCOF1insertionFrame_Shift_Insnovelc.2394_2395insCTp.Ala799LeufsTer30p.A799Lfs*30Q13428protein_codingTCGA-BH-A0DZ-01Breastbreast invasive carcinomaFemale<65I/IIChemotherapydocetaxelSD
TCOF1deletionFrame_Shift_Delnovelc.3639delNp.Ala1214ProfsTer12p.A1214Pfs*12Q13428protein_codingTCGA-EW-A2FV-01Breastbreast invasive carcinomaFemale<65III/IVChemotherapydocetaxelSD
TCOF1SNVMissense_Mutationc.206C>Tp.Ala69Valp.A69VQ13428protein_codingdeleterious(0.02)possibly_damaging(0.801)TCGA-2W-A8YY-01Cervixcervical & endocervical cancerFemale<65I/IIChemotherapycisplatinCR
TCOF1SNVMissense_Mutationnovelc.3695C>Tp.Ser1232Phep.S1232FQ13428protein_codingdeleterious(0.02)possibly_damaging(0.854)TCGA-2W-A8YY-01Cervixcervical & endocervical cancerFemale<65I/IIChemotherapycisplatinCR
Page: 1 2 3 4 5 6 7 8 9 10 11 12 

Top

Related drugs of malignant transformation related genes

check buttonIdentification of chemicals and drugs interact with genes involved in malignant transfromation
(DGIdb 4.0)
Entrez IDSymbolCategoryInteraction TypesDrug Claim NameDrug NamePMIDs
Page: 1