
|
|||||
|
 | |
| |
| |
| |
| |
| |
|
Gene: TCN2 |
Gene summary for TCN2 |
| Gene information | Species | Human | Gene symbol | TCN2 | Gene ID | 6948 |
| Gene name | transcobalamin 2 | |
| Gene Alias | D22S676 | |
| Cytomap | 22q12.2 | |
| Gene Type | protein-coding | GO ID | GO:0000041 | UniProtAcc | P20062 |
Top |
Malignant transformation analysis |
| Identification of the aberrant gene expression in precancerous and cancerous lesions by comparing the gene expression of stem-like cells in diseased tissues with normal stem cells |
| Entrez ID | Symbol | Replicates | Species | Organ | Tissue | Adj P-value | Log2FC | Malignancy |
| 6948 | TCN2 | LZE7T | Human | Esophagus | ESCC | 5.52e-04 | 3.59e-01 | 0.0667 |
| 6948 | TCN2 | P1T-E | Human | Esophagus | ESCC | 4.51e-02 | 2.73e-01 | 0.0875 |
| 6948 | TCN2 | P4T-E | Human | Esophagus | ESCC | 5.55e-05 | 2.20e-01 | 0.1323 |
| 6948 | TCN2 | P8T-E | Human | Esophagus | ESCC | 1.18e-12 | 2.49e-01 | 0.0889 |
| 6948 | TCN2 | P10T-E | Human | Esophagus | ESCC | 4.65e-09 | 7.95e-02 | 0.116 |
| 6948 | TCN2 | P11T-E | Human | Esophagus | ESCC | 2.59e-08 | 4.74e-01 | 0.1426 |
| 6948 | TCN2 | P12T-E | Human | Esophagus | ESCC | 1.88e-03 | 3.63e-02 | 0.1122 |
| 6948 | TCN2 | P16T-E | Human | Esophagus | ESCC | 7.07e-05 | 1.11e-01 | 0.1153 |
| 6948 | TCN2 | P23T-E | Human | Esophagus | ESCC | 6.28e-03 | 2.29e-01 | 0.108 |
| 6948 | TCN2 | P24T-E | Human | Esophagus | ESCC | 4.77e-02 | 9.57e-02 | 0.1287 |
| 6948 | TCN2 | P26T-E | Human | Esophagus | ESCC | 5.88e-04 | 8.66e-02 | 0.1276 |
| 6948 | TCN2 | P27T-E | Human | Esophagus | ESCC | 2.53e-06 | 7.73e-02 | 0.1055 |
| 6948 | TCN2 | P30T-E | Human | Esophagus | ESCC | 5.60e-27 | 9.67e-01 | 0.137 |
| 6948 | TCN2 | P32T-E | Human | Esophagus | ESCC | 1.59e-03 | 7.86e-02 | 0.1666 |
| 6948 | TCN2 | P40T-E | Human | Esophagus | ESCC | 3.42e-08 | 3.22e-01 | 0.109 |
| 6948 | TCN2 | P47T-E | Human | Esophagus | ESCC | 1.05e-05 | 1.15e-01 | 0.1067 |
| 6948 | TCN2 | P52T-E | Human | Esophagus | ESCC | 1.15e-04 | 1.22e-01 | 0.1555 |
| 6948 | TCN2 | P57T-E | Human | Esophagus | ESCC | 3.91e-05 | 2.34e-01 | 0.0926 |
| 6948 | TCN2 | P65T-E | Human | Esophagus | ESCC | 1.50e-19 | 4.96e-01 | 0.0978 |
| 6948 | TCN2 | P74T-E | Human | Esophagus | ESCC | 5.06e-82 | 2.34e+00 | 0.1479 |
| Page: 1 2 |
| Tissue | Expression Dynamics | Abbreviation |
| Esophagus | 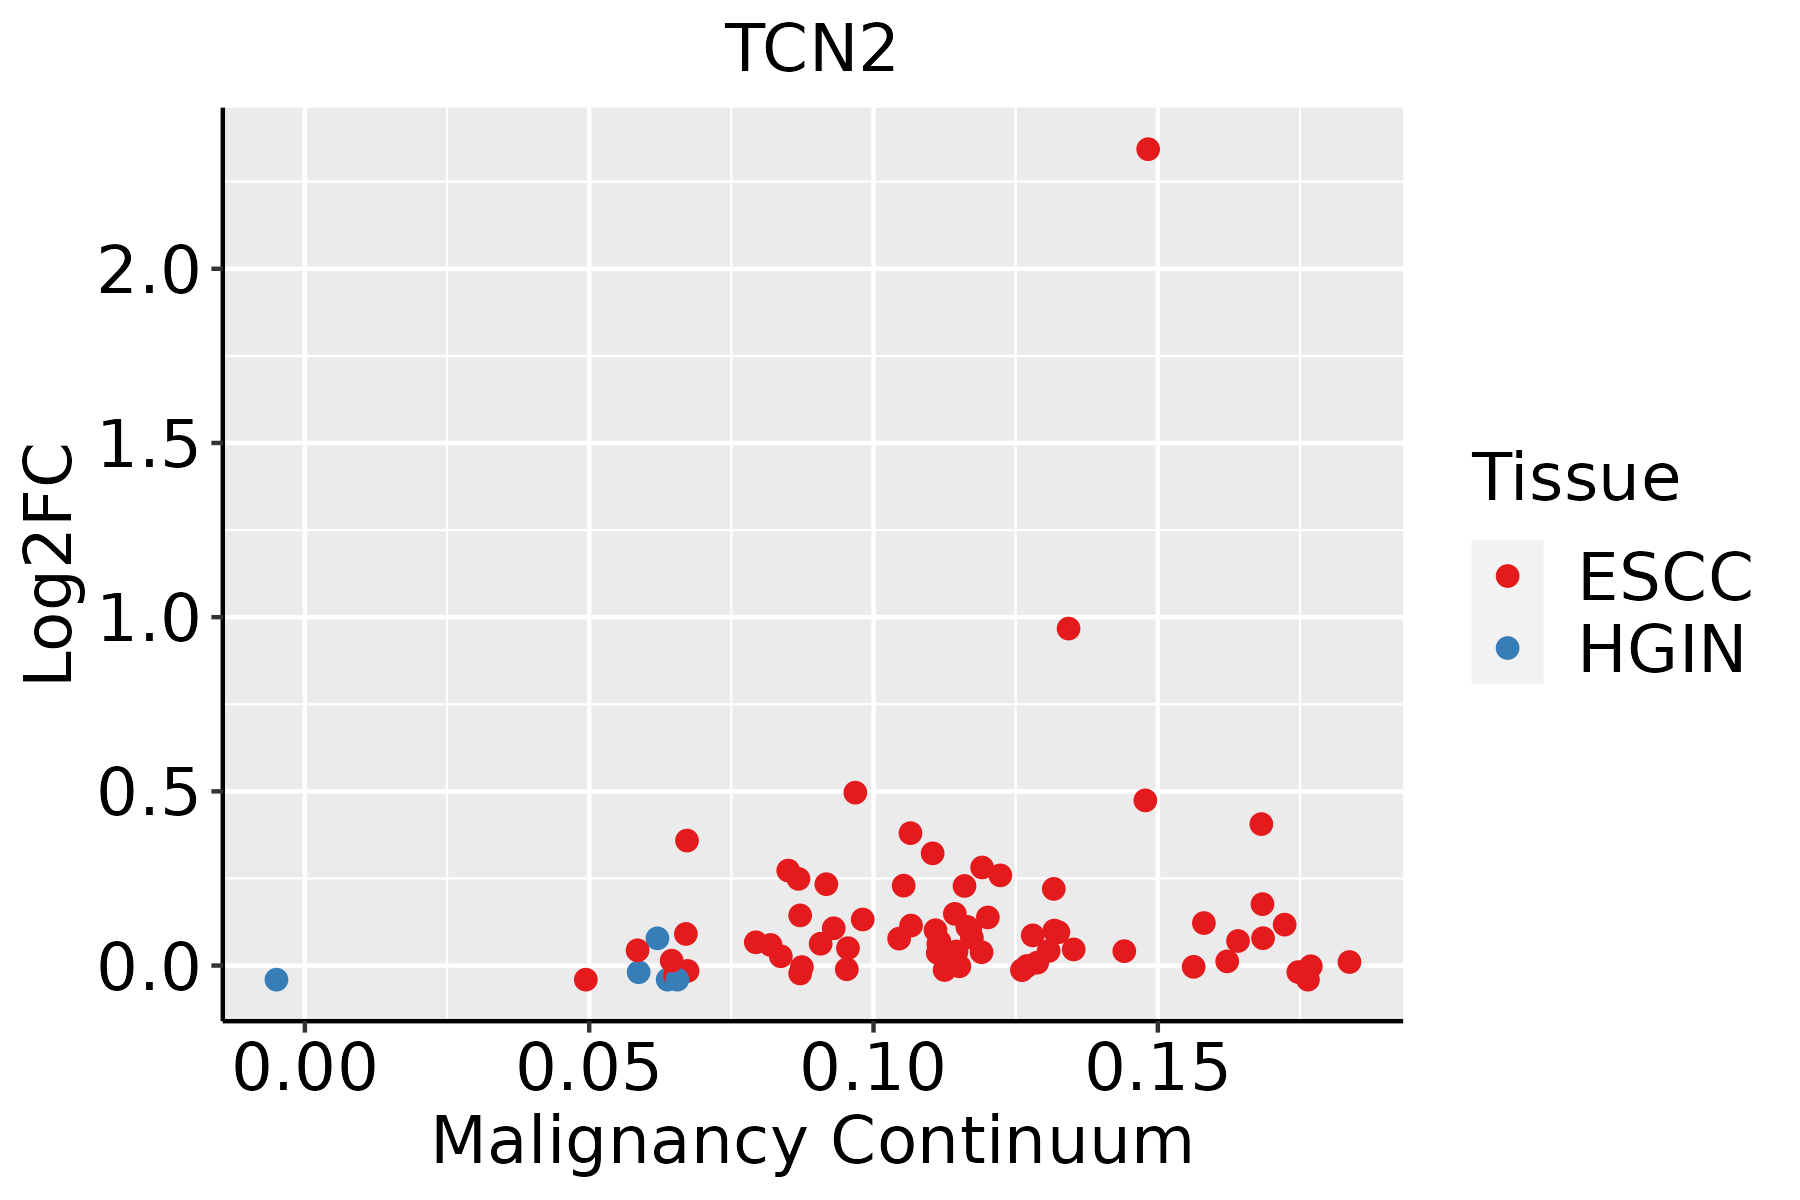 | ESCC: Esophageal squamous cell carcinoma |
| HGIN: High-grade intraepithelial neoplasias | ||
| LGIN: Low-grade intraepithelial neoplasias | ||
| Liver | 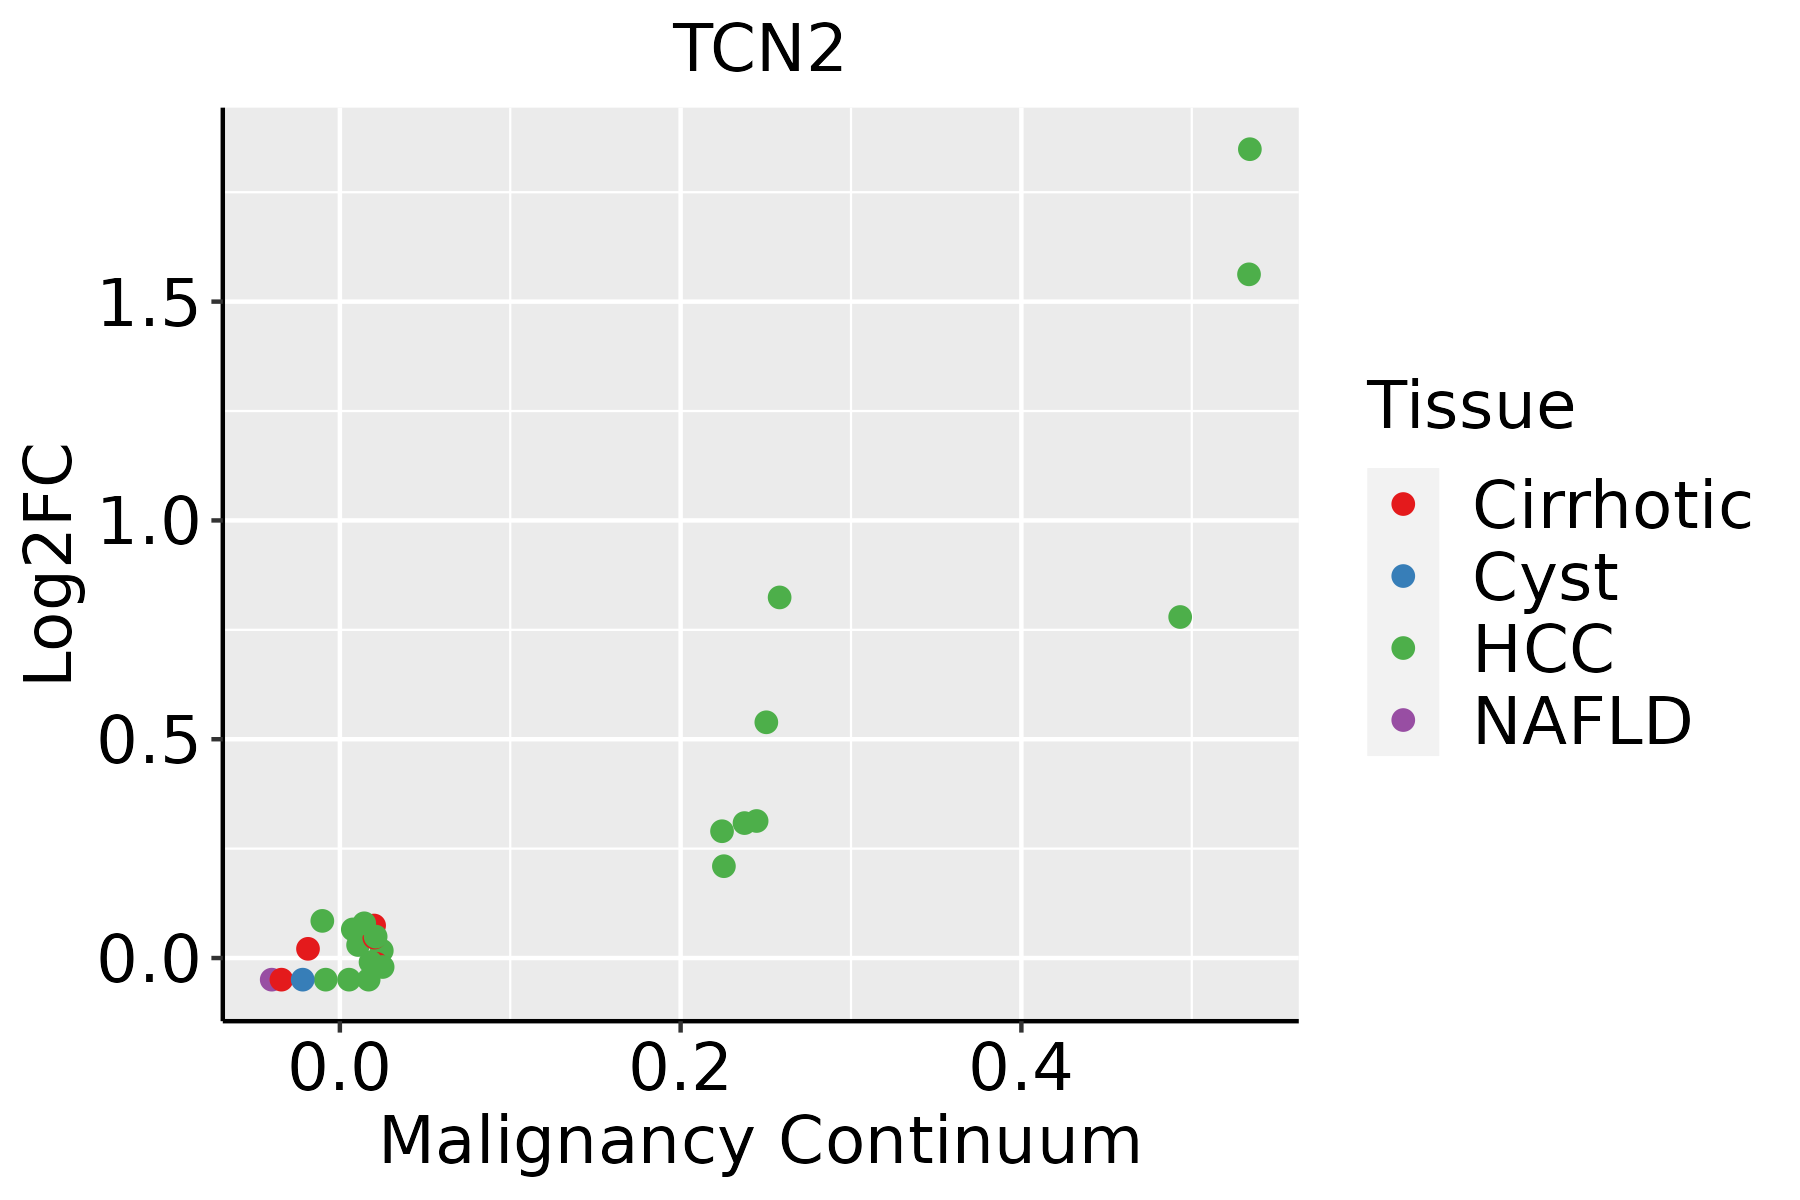 | HCC: Hepatocellular carcinoma |
| NAFLD: Non-alcoholic fatty liver disease | ||
| Oral Cavity | 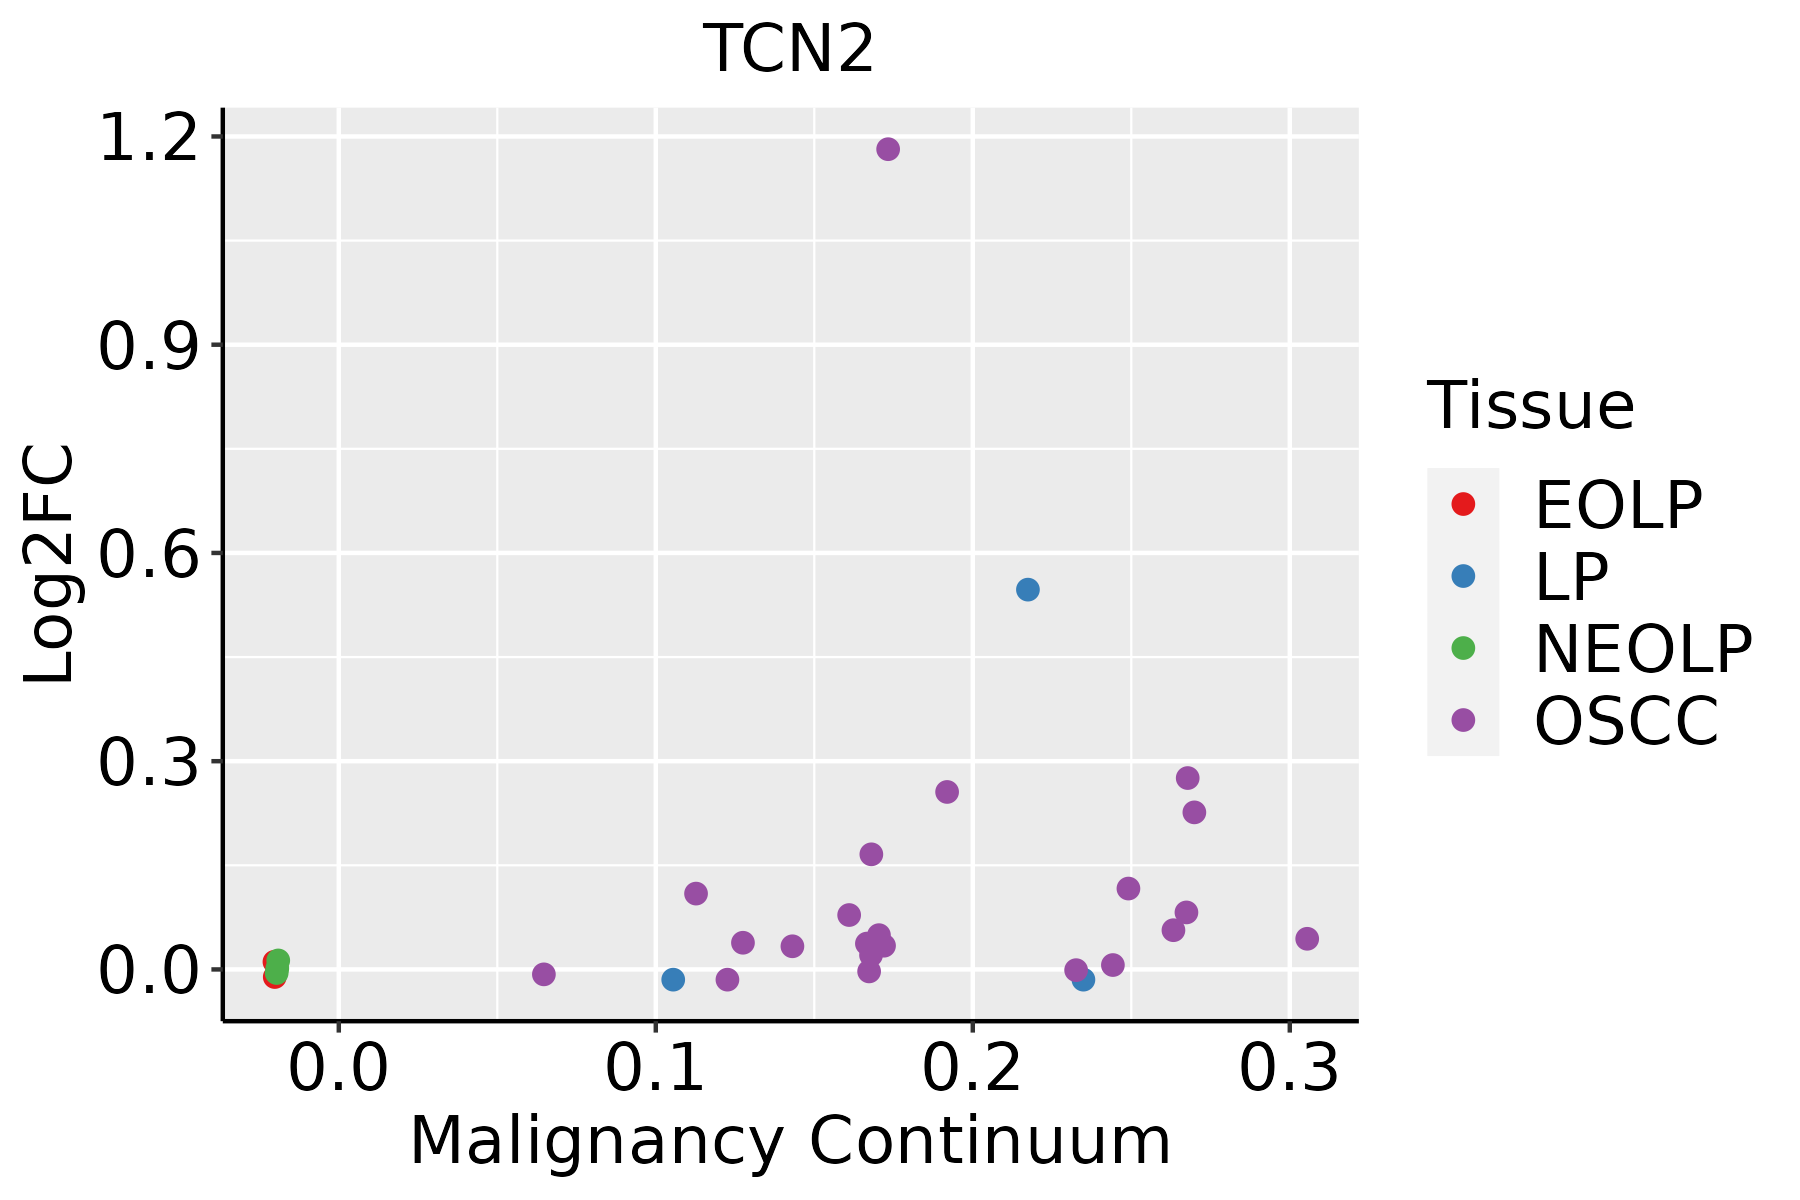 | EOLP: Erosive Oral lichen planus |
| LP: leukoplakia | ||
| NEOLP: Non-erosive oral lichen planus | ||
| OSCC: Oral squamous cell carcinoma |
| ∗log2FC in expression of this searched gene in stem-like cells from each diseased tissue sample relative to stem-like cells in normal samples in each tissue plotted against the malignancy continuum. Samples are colored based on if they are from different disease stage. |
Top |
Malignant transformation related pathway analysis |
| Find out the enriched GO biological processes and KEGG pathways involved in transition from healthy to precancer to cancer |
| Tissue | Disease Stage | Enriched GO biological Processes |
| Colorectum | AD |  |
| Colorectum | SER |  |
| Colorectum | MSS |  |
| Colorectum | MSI-H |  |
| Colorectum | FAP |  |
| ∗Top 15 enriched GO BP terms are showed in the bar plot of each disease state in each tissue. Each row represents a significant GO biological process which is colored according to the -log10(p.adjust). |
| Page: 1 2 3 4 5 6 7 8 9 |
| GO ID | Tissue | Disease Stage | Description | Gene Ratio | Bg Ratio | pvalue | p.adjust | Count |
| GO:00000411 | Liver | HCC | transition metal ion transport | 59/7958 | 105/18723 | 3.18e-03 | 1.47e-02 | 59 |
| Page: 1 |
| Pathway ID | Tissue | Disease Stage | Description | Gene Ratio | Bg Ratio | pvalue | p.adjust | qvalue | Count |
| Page: 1 |
Top |
Cell-cell communication analysis |
| Identification of potential cell-cell interactions between two cell types and their ligand-receptor pairs for different disease states |
| Ligand | Receptor | LRpair | Pathway | Tissue | Disease Stage |
| Page: 1 |
Top |
Single-cell gene regulatory network inference analysis |
| Find out the significant the regulons (TFs) and the target genes of each regulon across cell types for different disease states |
| TF | Cell Type | Tissue | Disease Stage | Target Gene | RSS | Regulon Activity |
| ∗The dot plots of a searched regulon are shown for all cell subpopulations in each disease state of each tissue based on the regulon specific score inferred using pySCENIC and by calculating the average expression. |
| Page: 1 |
Top |
Somatic mutation of malignant transformation related genes |
| Annotation of somatic variants for genes involved in malignant transformation |
| Hugo Symbol | Variant Class | Variant Classification | dbSNP RS | HGVSc | HGVSp | HGVSp Short | SWISSPROT | BIOTYPE | SIFT | PolyPhen | Tumor Sample Barcode | Tissue | Histology | Sex | Age | Stage | Therapy Types | Drugs | Outcome |
| TCN2 | SNV | Missense_Mutation | c.1206C>A | p.Asn402Lys | p.N402K | P20062 | protein_coding | deleterious(0.01) | benign(0.007) | TCGA-AN-A04D-01 | Breast | breast invasive carcinoma | Female | <65 | I/II | Unknown | Unknown | SD | |
| TCN2 | SNV | Missense_Mutation | rs141635240 | c.287N>A | p.Cys96Tyr | p.C96Y | P20062 | protein_coding | tolerated(1) | benign(0.131) | TCGA-OL-A5RV-01 | Breast | breast invasive carcinoma | Female | <65 | III/IV | Chemotherapy | doxorubicin | CR |
| TCN2 | SNV | Missense_Mutation | novel | c.973N>G | p.Gln325Glu | p.Q325E | P20062 | protein_coding | tolerated(0.77) | benign(0.003) | TCGA-XX-A89A-01 | Breast | breast invasive carcinoma | Female | >=65 | I/II | Unknown | Unknown | SD |
| TCN2 | SNV | Missense_Mutation | novel | c.302C>T | p.Ser101Phe | p.S101F | P20062 | protein_coding | deleterious(0) | probably_damaging(0.935) | TCGA-C5-A8YT-01 | Cervix | cervical & endocervical cancer | Female | <65 | I/II | Chemotherapy | cisplatin | PD |
| TCN2 | SNV | Missense_Mutation | rs770055978 | c.131N>A | p.Arg44Gln | p.R44Q | P20062 | protein_coding | tolerated(0.71) | benign(0.007) | TCGA-EK-A2R7-01 | Cervix | cervical & endocervical cancer | Female | <65 | I/II | Unknown | Unknown | SD |
| TCN2 | SNV | Missense_Mutation | c.709G>A | p.Glu237Lys | p.E237K | P20062 | protein_coding | tolerated(0.09) | benign(0.094) | TCGA-LP-A4AV-01 | Cervix | cervical & endocervical cancer | Female | <65 | I/II | Unknown | Unknown | SD | |
| TCN2 | SNV | Missense_Mutation | c.122N>T | p.Trp41Leu | p.W41L | P20062 | protein_coding | tolerated(0.34) | probably_damaging(0.999) | TCGA-AA-3697-01 | Colorectum | colon adenocarcinoma | Male | >=65 | I/II | Unknown | Unknown | SD | |
| TCN2 | SNV | Missense_Mutation | rs774428161 | c.1163C>T | p.Ala388Val | p.A388V | P20062 | protein_coding | tolerated(0.27) | benign(0) | TCGA-AA-3864-01 | Colorectum | colon adenocarcinoma | Male | >=65 | I/II | Unknown | Unknown | SD |
| TCN2 | SNV | Missense_Mutation | c.1192N>A | p.Leu398Ile | p.L398I | P20062 | protein_coding | tolerated(0.05) | benign(0.085) | TCGA-AA-A010-01 | Colorectum | colon adenocarcinoma | Female | <65 | I/II | Chemotherapy | folinic | CR | |
| TCN2 | SNV | Missense_Mutation | novel | c.1238N>T | p.Arg413Ile | p.R413I | P20062 | protein_coding | tolerated(0.1) | benign(0.049) | TCGA-CA-6717-01 | Colorectum | colon adenocarcinoma | Male | <65 | I/II | Chemotherapy | oxaliplatin | CR |
| Page: 1 2 3 4 5 |
Top |
Related drugs of malignant transformation related genes |
| Identification of chemicals and drugs interact with genes involved in malignant transfromation |
| (DGIdb 4.0) |
| Entrez ID | Symbol | Category | Interaction Types | Drug Claim Name | Drug Name | PMIDs |
| Page: 1 |

Copyright 2023-Present -The University of Texas Health Science Center at Houston |