
|
|||||
|
 | |
| |
| |
| |
| |
| |
|
Gene: TCN1 |
Gene summary for TCN1 |
| Gene information | Species | Human | Gene symbol | TCN1 | Gene ID | 6947 |
| Gene name | transcobalamin 1 | |
| Gene Alias | HC | |
| Cytomap | 11q12.1 | |
| Gene Type | protein-coding | GO ID | GO:0000041 | UniProtAcc | P20061 |
Top |
Malignant transformation analysis |
| Identification of the aberrant gene expression in precancerous and cancerous lesions by comparing the gene expression of stem-like cells in diseased tissues with normal stem cells |
| Entrez ID | Symbol | Replicates | Species | Organ | Tissue | Adj P-value | Log2FC | Malignancy |
| 6947 | TCN1 | Tumor | Human | Cervix | CC | 2.65e-13 | 3.98e-01 | 0.1241 |
| 6947 | TCN1 | sample3 | Human | Cervix | CC | 5.43e-13 | 3.94e-01 | 0.1387 |
| 6947 | TCN1 | H2 | Human | Cervix | HSIL_HPV | 3.45e-28 | 7.26e-01 | 0.0632 |
| 6947 | TCN1 | T2 | Human | Cervix | CC | 3.40e-02 | 4.96e-01 | 0.0709 |
| 6947 | TCN1 | T3 | Human | Cervix | CC | 3.15e-14 | 3.90e-01 | 0.1389 |
| 6947 | TCN1 | LZE4T | Human | Esophagus | ESCC | 5.73e-09 | -7.82e-01 | 0.0811 |
| 6947 | TCN1 | LZE5T | Human | Esophagus | ESCC | 1.40e-10 | -2.67e-01 | 0.0514 |
| 6947 | TCN1 | LZE7T | Human | Esophagus | ESCC | 6.93e-04 | -7.61e-01 | 0.0667 |
| 6947 | TCN1 | LZE8T | Human | Esophagus | ESCC | 1.45e-07 | -7.69e-01 | 0.067 |
| 6947 | TCN1 | LZE20T | Human | Esophagus | ESCC | 1.00e-11 | -6.97e-01 | 0.0662 |
| 6947 | TCN1 | LZE22D1 | Human | Esophagus | HGIN | 1.13e-59 | -1.34e-01 | 0.0595 |
| 6947 | TCN1 | LZE24T | Human | Esophagus | ESCC | 3.71e-13 | -7.82e-01 | 0.0596 |
| 6947 | TCN1 | LZE21T | Human | Esophagus | ESCC | 1.87e-02 | -7.82e-01 | 0.0655 |
| 6947 | TCN1 | LZE6T | Human | Esophagus | ESCC | 5.26e-05 | -7.82e-01 | 0.0845 |
| 6947 | TCN1 | P2T-E | Human | Esophagus | ESCC | 2.17e-18 | -7.76e-01 | 0.1177 |
| 6947 | TCN1 | P4T-E | Human | Esophagus | ESCC | 9.09e-14 | -7.82e-01 | 0.1323 |
| 6947 | TCN1 | P5T-E | Human | Esophagus | ESCC | 5.00e-17 | -7.82e-01 | 0.1327 |
| 6947 | TCN1 | P8T-E | Human | Esophagus | ESCC | 1.30e-13 | -7.10e-01 | 0.0889 |
| 6947 | TCN1 | P9T-E | Human | Esophagus | ESCC | 7.79e-14 | -7.82e-01 | 0.1131 |
| 6947 | TCN1 | P10T-E | Human | Esophagus | ESCC | 9.67e-18 | -7.82e-01 | 0.116 |
| Page: 1 2 3 4 |
| Tissue | Expression Dynamics | Abbreviation |
| Cervix | 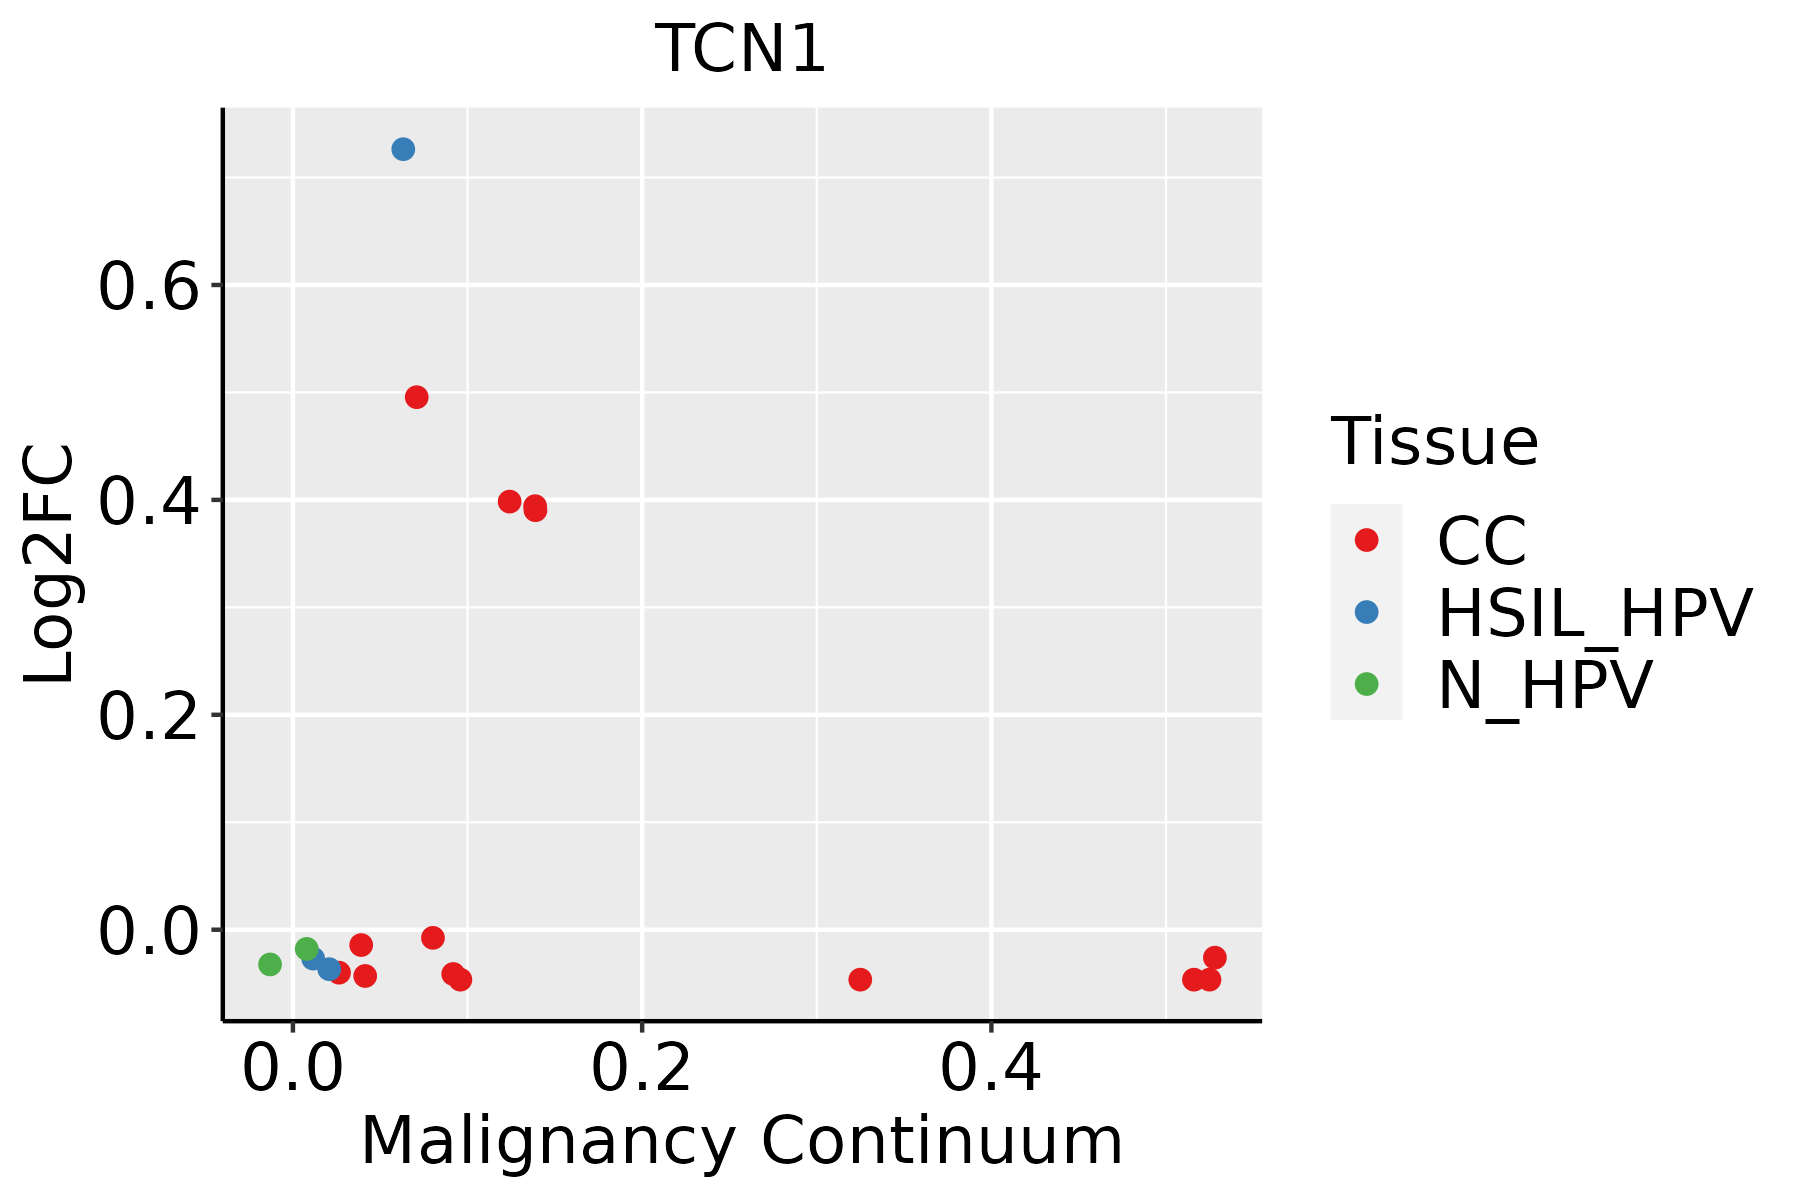 | CC: Cervix cancer |
| HSIL_HPV: HPV-infected high-grade squamous intraepithelial lesions | ||
| N_HPV: HPV-infected normal cervix | ||
| Esophagus | 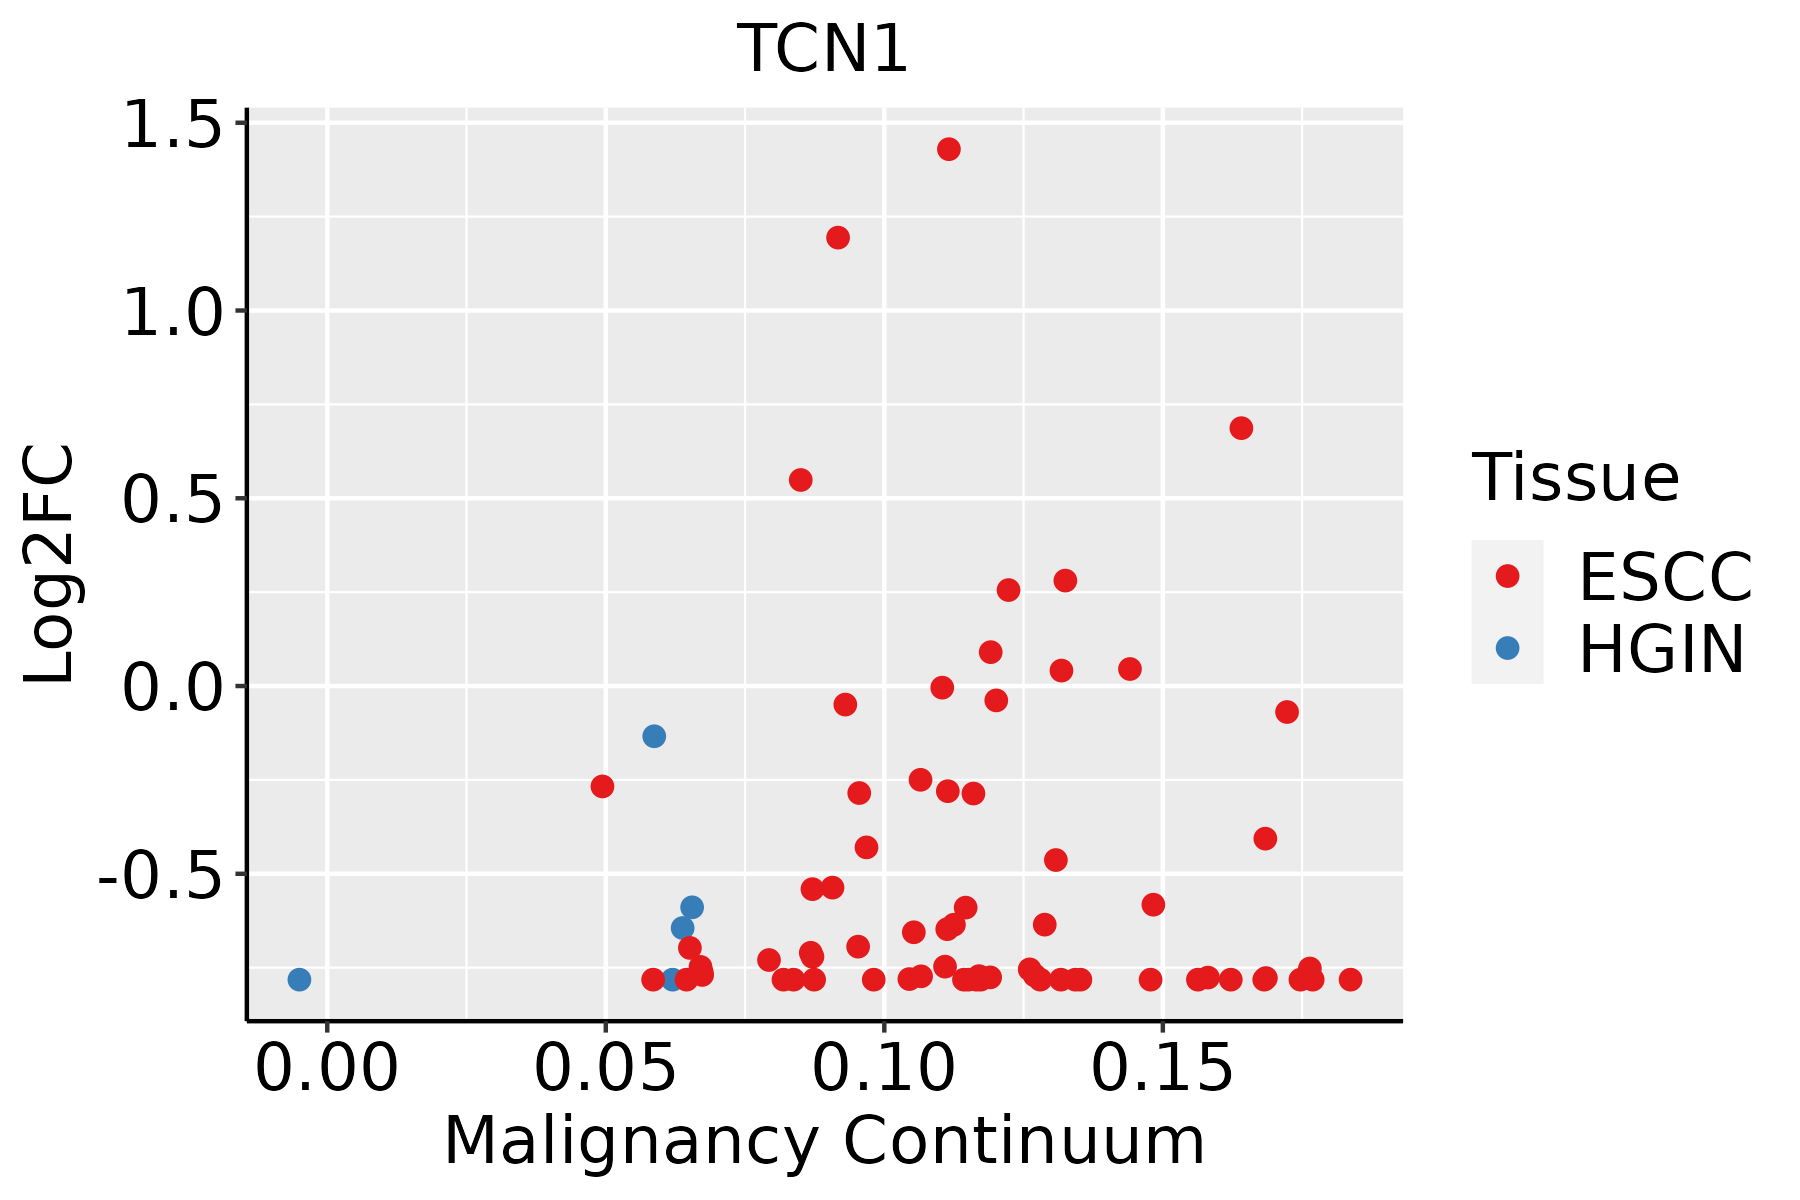 | ESCC: Esophageal squamous cell carcinoma |
| HGIN: High-grade intraepithelial neoplasias | ||
| LGIN: Low-grade intraepithelial neoplasias | ||
| Oral Cavity |  | EOLP: Erosive Oral lichen planus |
| LP: leukoplakia | ||
| NEOLP: Non-erosive oral lichen planus | ||
| OSCC: Oral squamous cell carcinoma |
| ∗log2FC in expression of this searched gene in stem-like cells from each diseased tissue sample relative to stem-like cells in normal samples in each tissue plotted against the malignancy continuum. Samples are colored based on if they are from different disease stage. |
Top |
Malignant transformation related pathway analysis |
| Find out the enriched GO biological processes and KEGG pathways involved in transition from healthy to precancer to cancer |
| Tissue | Disease Stage | Enriched GO biological Processes |
| Colorectum | AD |  |
| Colorectum | SER |  |
| Colorectum | MSS |  |
| Colorectum | MSI-H |  |
| Colorectum | FAP |  |
| ∗Top 15 enriched GO BP terms are showed in the bar plot of each disease state in each tissue. Each row represents a significant GO biological process which is colored according to the -log10(p.adjust). |
| Page: 1 2 3 4 5 6 7 8 9 |
| GO ID | Tissue | Disease Stage | Description | Gene Ratio | Bg Ratio | pvalue | p.adjust | Count |
| GO:004578516 | Endometrium | AEH | positive regulation of cell adhesion | 96/2100 | 437/18723 | 5.50e-11 | 7.18e-09 | 96 |
| GO:002240714 | Endometrium | AEH | regulation of cell-cell adhesion | 79/2100 | 448/18723 | 2.90e-05 | 5.40e-04 | 79 |
| GO:002240910 | Endometrium | AEH | positive regulation of cell-cell adhesion | 54/2100 | 284/18723 | 6.94e-05 | 1.07e-03 | 54 |
| GO:19030398 | Endometrium | AEH | positive regulation of leukocyte cell-cell adhesion | 46/2100 | 239/18723 | 1.72e-04 | 2.24e-03 | 46 |
| GO:00421109 | Endometrium | AEH | T cell activation | 81/2100 | 487/18723 | 1.78e-04 | 2.30e-03 | 81 |
| GO:00508709 | Endometrium | AEH | positive regulation of T cell activation | 41/2100 | 216/18723 | 5.08e-04 | 5.18e-03 | 41 |
| GO:00071599 | Endometrium | AEH | leukocyte cell-cell adhesion | 63/2100 | 371/18723 | 5.11e-04 | 5.21e-03 | 63 |
| GO:00508639 | Endometrium | AEH | regulation of T cell activation | 57/2100 | 329/18723 | 5.58e-04 | 5.59e-03 | 57 |
| GO:00027645 | Endometrium | AEH | immune response-regulating signaling pathway | 76/2100 | 468/18723 | 5.76e-04 | 5.71e-03 | 76 |
| GO:19030379 | Endometrium | AEH | regulation of leukocyte cell-cell adhesion | 57/2100 | 336/18723 | 9.42e-04 | 8.57e-03 | 57 |
| GO:00508525 | Endometrium | AEH | T cell receptor signaling pathway | 26/2100 | 123/18723 | 1.03e-03 | 9.15e-03 | 26 |
| GO:00026838 | Endometrium | AEH | negative regulation of immune system process | 69/2100 | 434/18723 | 1.76e-03 | 1.41e-02 | 69 |
| GO:00420989 | Endometrium | AEH | T cell proliferation | 35/2100 | 199/18723 | 4.66e-03 | 2.98e-02 | 35 |
| GO:00421298 | Endometrium | AEH | regulation of T cell proliferation | 31/2100 | 171/18723 | 4.73e-03 | 3.00e-02 | 31 |
| GO:00018198 | Endometrium | AEH | positive regulation of cytokine production | 71/2100 | 467/18723 | 4.76e-03 | 3.02e-02 | 71 |
| GO:00071627 | Endometrium | AEH | negative regulation of cell adhesion | 49/2100 | 303/18723 | 5.43e-03 | 3.37e-02 | 49 |
| GO:00706638 | Endometrium | AEH | regulation of leukocyte proliferation | 41/2100 | 245/18723 | 5.77e-03 | 3.52e-02 | 41 |
| GO:004578517 | Endometrium | EEC | positive regulation of cell adhesion | 98/2168 | 437/18723 | 6.15e-11 | 8.38e-09 | 98 |
| GO:002240715 | Endometrium | EEC | regulation of cell-cell adhesion | 84/2168 | 448/18723 | 4.98e-06 | 1.24e-04 | 84 |
| GO:002240914 | Endometrium | EEC | positive regulation of cell-cell adhesion | 56/2168 | 284/18723 | 4.36e-05 | 7.15e-04 | 56 |
| Page: 1 2 |
| Pathway ID | Tissue | Disease Stage | Description | Gene Ratio | Bg Ratio | pvalue | p.adjust | qvalue | Count |
| Page: 1 |
Top |
Cell-cell communication analysis |
| Identification of potential cell-cell interactions between two cell types and their ligand-receptor pairs for different disease states |
| Ligand | Receptor | LRpair | Pathway | Tissue | Disease Stage |
| Page: 1 |
Top |
Single-cell gene regulatory network inference analysis |
| Find out the significant the regulons (TFs) and the target genes of each regulon across cell types for different disease states |
| TF | Cell Type | Tissue | Disease Stage | Target Gene | RSS | Regulon Activity |
| ∗The dot plots of a searched regulon are shown for all cell subpopulations in each disease state of each tissue based on the regulon specific score inferred using pySCENIC and by calculating the average expression. |
| Page: 1 |
Top |
Somatic mutation of malignant transformation related genes |
| Annotation of somatic variants for genes involved in malignant transformation |
| Hugo Symbol | Variant Class | Variant Classification | dbSNP RS | HGVSc | HGVSp | HGVSp Short | SWISSPROT | BIOTYPE | SIFT | PolyPhen | Tumor Sample Barcode | Tissue | Histology | Sex | Age | Stage | Therapy Types | Drugs | Outcome |
| TCN1 | SNV | Missense_Mutation | rs766356612 | c.275N>T | p.Ser92Leu | p.S92L | P20061 | protein_coding | deleterious(0) | probably_damaging(0.999) | TCGA-A2-A0EQ-01 | Breast | breast invasive carcinoma | Female | <65 | I/II | Chemotherapy | adriamycin | SD |
| TCN1 | SNV | Missense_Mutation | novel | c.473N>C | p.Asn158Thr | p.N158T | P20061 | protein_coding | tolerated(0.14) | benign(0.098) | TCGA-A8-A08H-01 | Breast | breast invasive carcinoma | Female | >=65 | I/II | Unknown | Unknown | SD |
| TCN1 | SNV | Missense_Mutation | rs778765850 | c.451G>A | p.Val151Ile | p.V151I | P20061 | protein_coding | tolerated(0.18) | possibly_damaging(0.724) | TCGA-AN-A049-01 | Breast | breast invasive carcinoma | Female | <65 | I/II | Unknown | Unknown | SD |
| TCN1 | SNV | Missense_Mutation | c.681N>C | p.Lys227Asn | p.K227N | P20061 | protein_coding | deleterious(0.04) | probably_damaging(0.979) | TCGA-B6-A0I8-01 | Breast | breast invasive carcinoma | Female | <65 | I/II | Unknown | Unknown | PD | |
| TCN1 | SNV | Missense_Mutation | c.681N>C | p.Lys227Asn | p.K227N | P20061 | protein_coding | deleterious(0.04) | probably_damaging(0.979) | TCGA-E9-A22B-01 | Breast | breast invasive carcinoma | Female | >=65 | I/II | Hormone Therapy | tamoxiphen | SD | |
| TCN1 | SNV | Missense_Mutation | rs371448135 | c.1139N>A | p.Arg380His | p.R380H | P20061 | protein_coding | deleterious(0) | benign(0.039) | TCGA-C5-A7CK-01 | Cervix | cervical & endocervical cancer | Female | <65 | I/II | Chemotherapy | cisplatin | SD |
| TCN1 | SNV | Missense_Mutation | novel | c.1187N>T | p.Asn396Ile | p.N396I | P20061 | protein_coding | deleterious(0) | possibly_damaging(0.606) | TCGA-C5-A8YR-01 | Cervix | cervical & endocervical cancer | Female | <65 | I/II | Unknown | Unknown | PD |
| TCN1 | SNV | Missense_Mutation | c.691N>C | p.Glu231Gln | p.E231Q | P20061 | protein_coding | tolerated(0.19) | benign(0.053) | TCGA-JW-A852-01 | Cervix | cervical & endocervical cancer | Female | <65 | I/II | Unknown | Unknown | PD | |
| TCN1 | SNV | Missense_Mutation | novel | c.843C>G | p.Phe281Leu | p.F281L | P20061 | protein_coding | deleterious(0.03) | benign(0.376) | TCGA-VS-A8Q8-01 | Cervix | cervical & endocervical cancer | Female | <65 | I/II | Unknown | Unknown | PD |
| TCN1 | SNV | Missense_Mutation | c.413N>A | p.Gly138Asp | p.G138D | P20061 | protein_coding | tolerated(0.14) | benign(0.031) | TCGA-AA-3663-01 | Colorectum | colon adenocarcinoma | Male | <65 | I/II | Unknown | Unknown | SD |
| Page: 1 2 3 4 5 6 7 |
Top |
Related drugs of malignant transformation related genes |
| Identification of chemicals and drugs interact with genes involved in malignant transfromation |
| (DGIdb 4.0) |
| Entrez ID | Symbol | Category | Interaction Types | Drug Claim Name | Drug Name | PMIDs |
| 6947 | TCN1 | DRUGGABLE GENOME | CYANOCOBALAMIN | CYANOCOBALAMIN | 2876185 | |
| 6947 | TCN1 | DRUGGABLE GENOME | VITAMIN-B12 | 526444,3018464,1285639,6164603,8438881,474643,1176445,10207776,3332101,2235967,1504859 |
| Page: 1 |

Copyright 2023-Present -The University of Texas Health Science Center at Houston |