
|
|||||
|
 | |
| |
| |
| |
| |
| |
|
Gene: TCF7L2 |
Gene summary for TCF7L2 |
| Gene information | Species | Human | Gene symbol | TCF7L2 | Gene ID | 6934 |
| Gene name | transcription factor 7 like 2 | |
| Gene Alias | TCF-4 | |
| Cytomap | 10q25.2-q25.3 | |
| Gene Type | protein-coding | GO ID | GO:0000122 | UniProtAcc | Q9NQB0 |
Top |
Malignant transformation analysis |
| Identification of the aberrant gene expression in precancerous and cancerous lesions by comparing the gene expression of stem-like cells in diseased tissues with normal stem cells |
| Entrez ID | Symbol | Replicates | Species | Organ | Tissue | Adj P-value | Log2FC | Malignancy |
| 6934 | TCF7L2 | CCI_1 | Human | Cervix | CC | 8.52e-09 | 1.07e+00 | 0.528 |
| 6934 | TCF7L2 | CCI_2 | Human | Cervix | CC | 2.84e-13 | 1.79e+00 | 0.5249 |
| 6934 | TCF7L2 | CCI_3 | Human | Cervix | CC | 3.90e-25 | 1.50e+00 | 0.516 |
| 6934 | TCF7L2 | T1 | Human | Cervix | CC | 2.62e-02 | 2.45e-01 | 0.0918 |
| 6934 | TCF7L2 | HTA11_2487_2000001011 | Human | Colorectum | SER | 6.04e-16 | 1.10e+00 | -0.1808 |
| 6934 | TCF7L2 | HTA11_1938_2000001011 | Human | Colorectum | AD | 6.23e-28 | 1.18e+00 | -0.0811 |
| 6934 | TCF7L2 | HTA11_78_2000001011 | Human | Colorectum | AD | 2.15e-04 | 6.75e-01 | -0.1088 |
| 6934 | TCF7L2 | HTA11_347_2000001011 | Human | Colorectum | AD | 7.40e-16 | 1.01e+00 | -0.1954 |
| 6934 | TCF7L2 | HTA11_411_2000001011 | Human | Colorectum | SER | 3.68e-14 | 1.80e+00 | -0.2602 |
| 6934 | TCF7L2 | HTA11_2112_2000001011 | Human | Colorectum | SER | 7.47e-27 | 1.77e+00 | -0.2196 |
| 6934 | TCF7L2 | HTA11_3361_2000001011 | Human | Colorectum | AD | 8.78e-05 | 5.97e-01 | -0.1207 |
| 6934 | TCF7L2 | HTA11_83_2000001011 | Human | Colorectum | SER | 1.71e-15 | 9.81e-01 | -0.1526 |
| 6934 | TCF7L2 | HTA11_696_2000001011 | Human | Colorectum | AD | 4.78e-11 | 1.02e+00 | -0.1464 |
| 6934 | TCF7L2 | HTA11_866_2000001011 | Human | Colorectum | AD | 3.71e-08 | 8.85e-01 | -0.1001 |
| 6934 | TCF7L2 | HTA11_1391_2000001011 | Human | Colorectum | AD | 1.56e-17 | 1.58e+00 | -0.059 |
| 6934 | TCF7L2 | HTA11_2992_2000001011 | Human | Colorectum | SER | 1.16e-05 | 5.40e-01 | -0.1706 |
| 6934 | TCF7L2 | HTA11_5212_2000001011 | Human | Colorectum | AD | 1.71e-07 | 6.82e-01 | -0.2061 |
| 6934 | TCF7L2 | HTA11_546_2000001011 | Human | Colorectum | AD | 4.97e-02 | 4.47e-01 | -0.0842 |
| 6934 | TCF7L2 | HTA11_99999965062_69753 | Human | Colorectum | MSI-H | 1.13e-15 | 1.20e+00 | 0.3487 |
| 6934 | TCF7L2 | HTA11_99999965104_69814 | Human | Colorectum | MSS | 1.08e-08 | 6.35e-01 | 0.281 |
| Page: 1 2 3 4 5 6 7 8 9 10 11 |
| Tissue | Expression Dynamics | Abbreviation |
| Cervix |  | CC: Cervix cancer |
| HSIL_HPV: HPV-infected high-grade squamous intraepithelial lesions | ||
| N_HPV: HPV-infected normal cervix | ||
| Colorectum (GSE201348) | 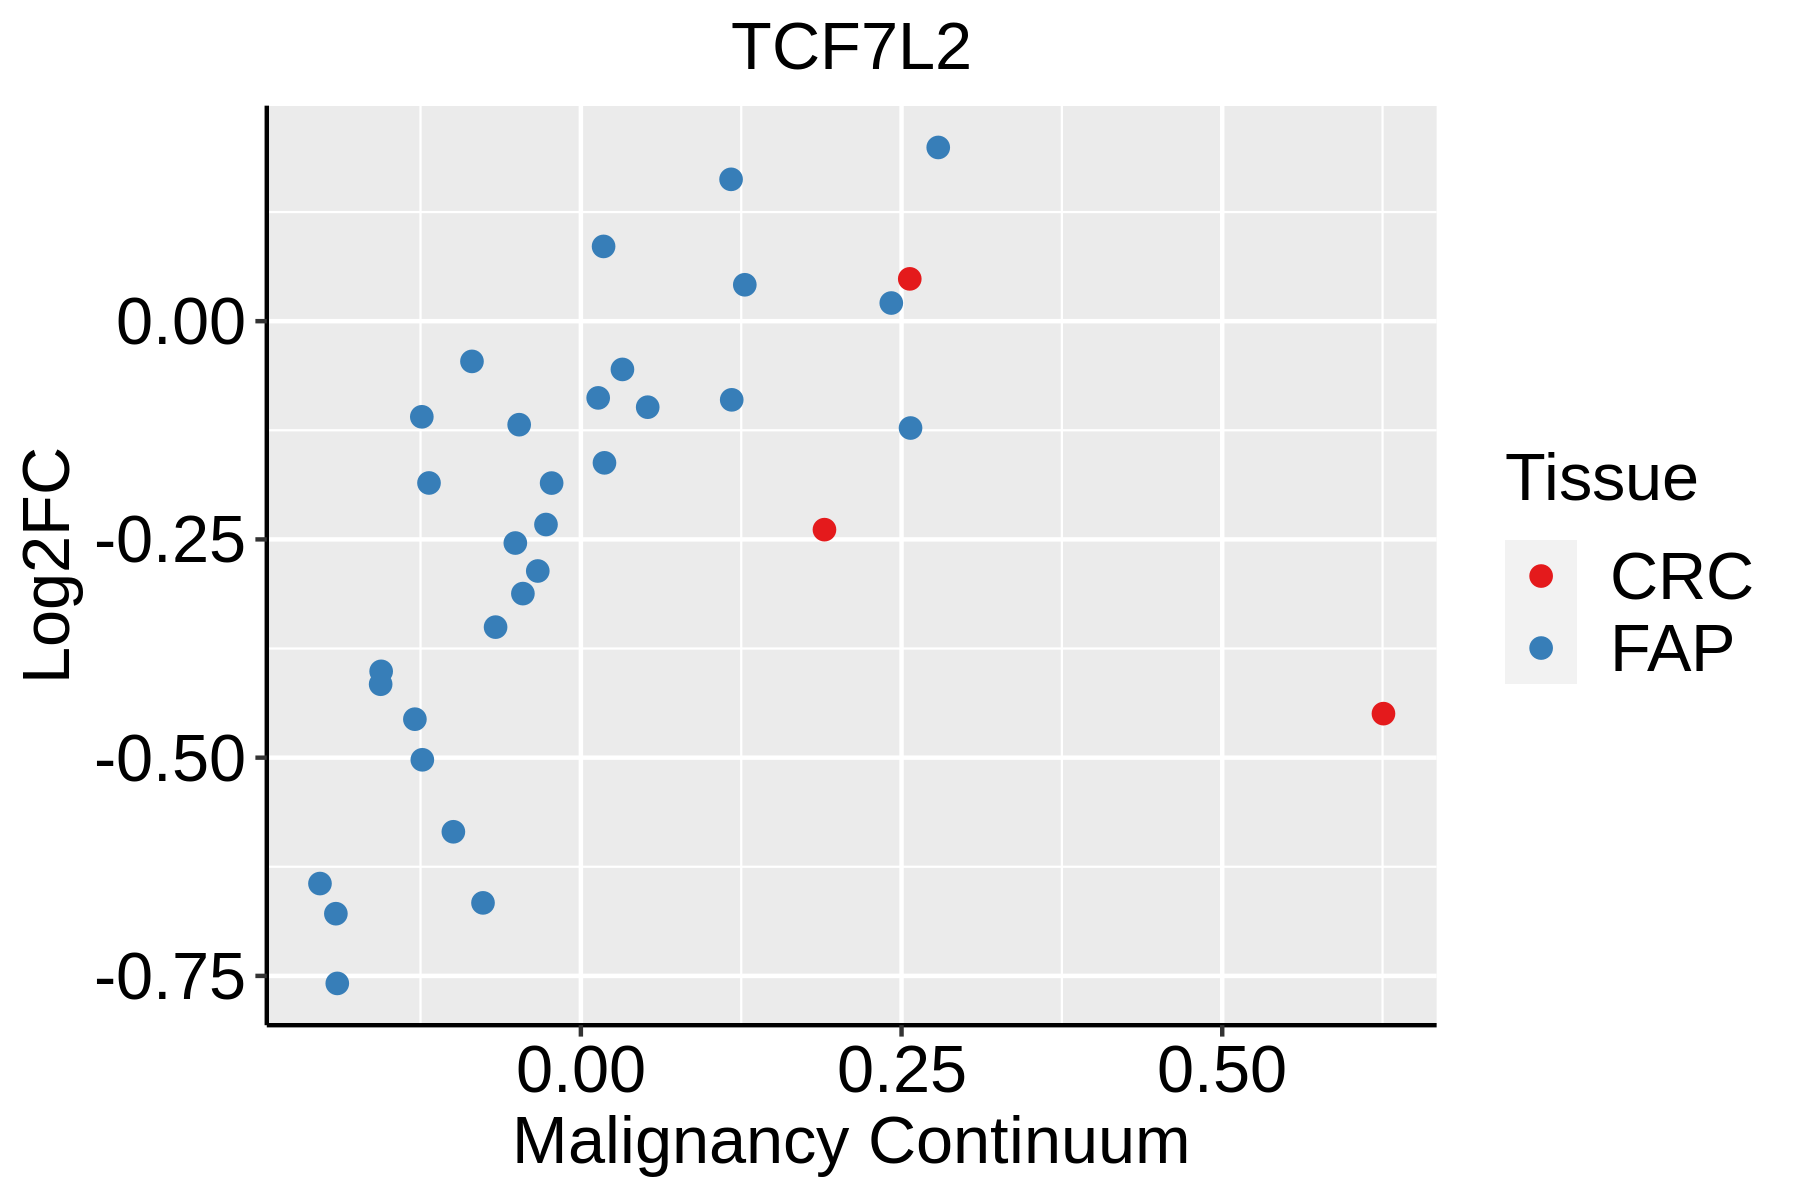 | FAP: Familial adenomatous polyposis |
| CRC: Colorectal cancer | ||
| Colorectum (HTA11) | 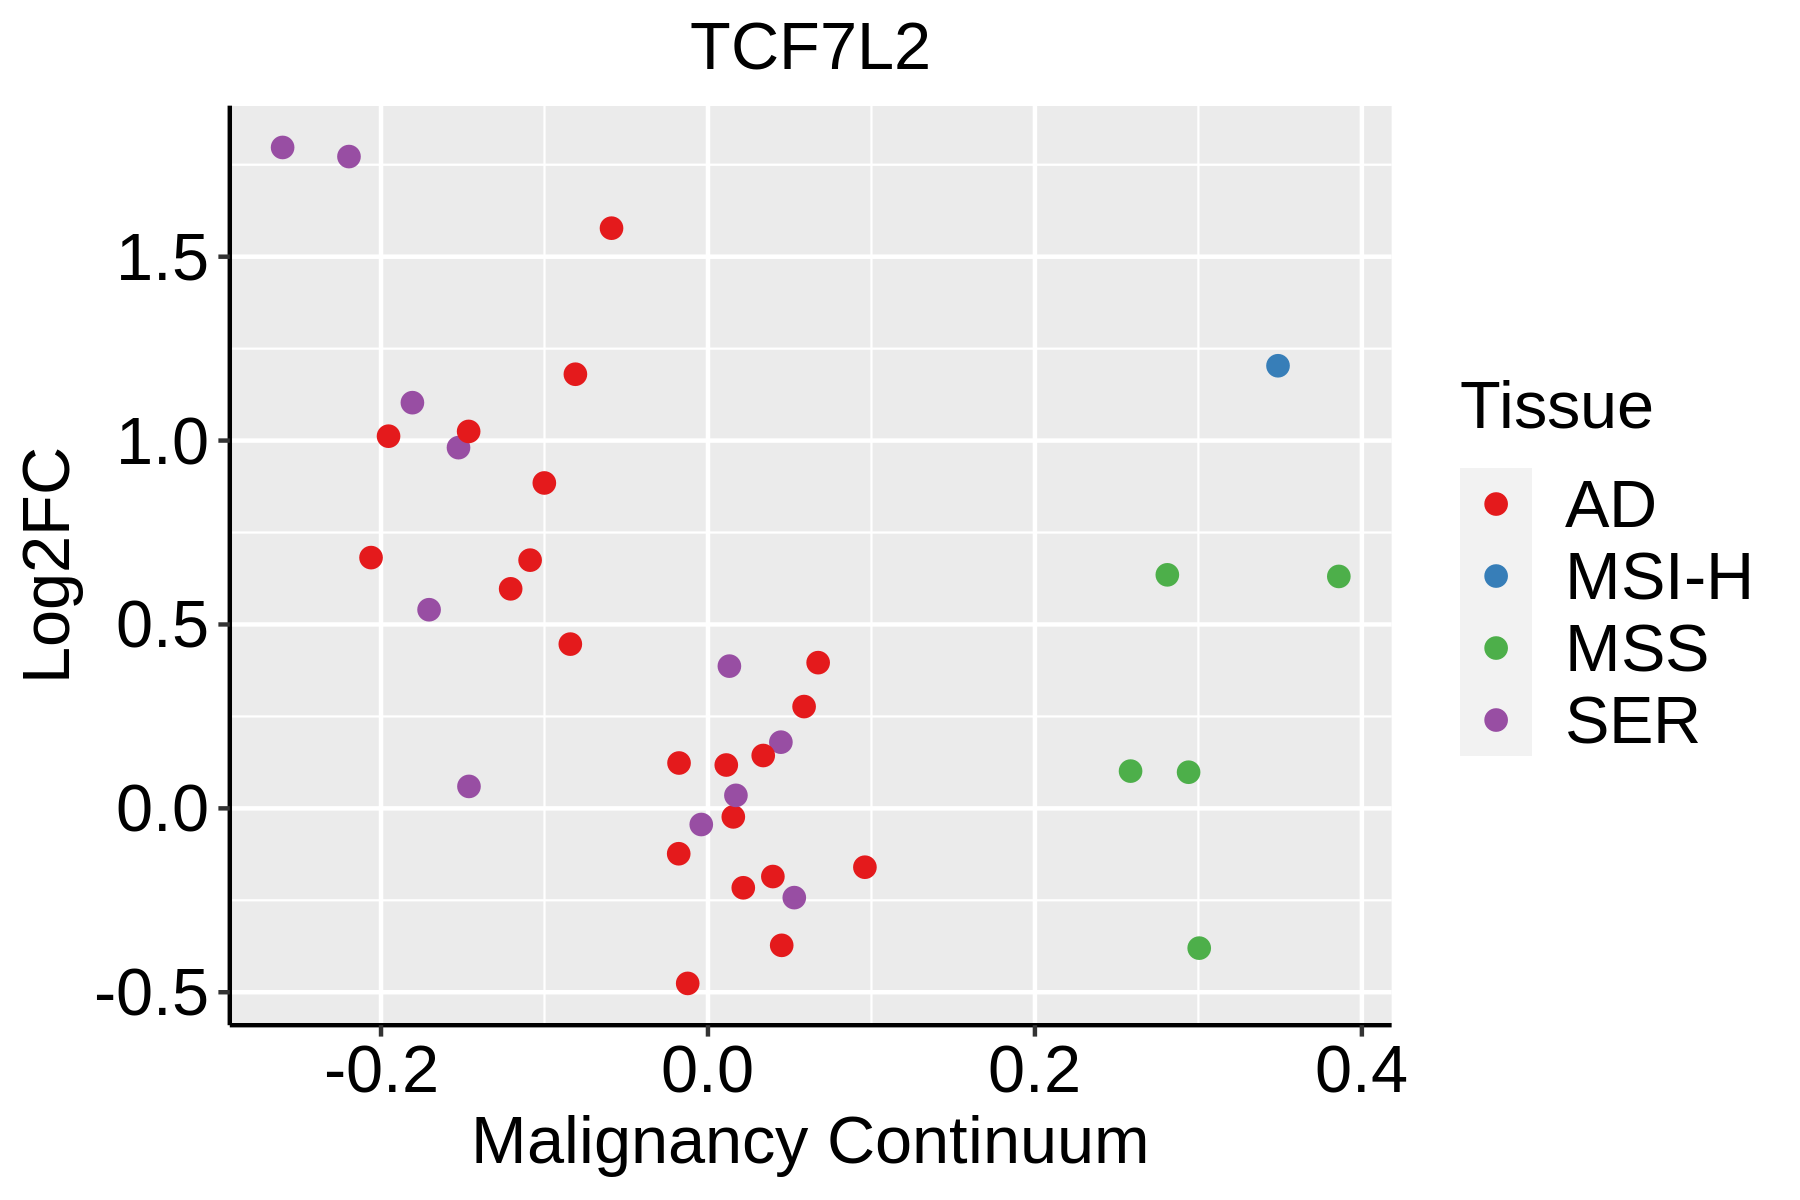 | AD: Adenomas |
| SER: Sessile serrated lesions | ||
| MSI-H: Microsatellite-high colorectal cancer | ||
| MSS: Microsatellite stable colorectal cancer | ||
| Endometrium |  | AEH: Atypical endometrial hyperplasia |
| EEC: Endometrioid Cancer | ||
| Esophagus |  | ESCC: Esophageal squamous cell carcinoma |
| HGIN: High-grade intraepithelial neoplasias | ||
| LGIN: Low-grade intraepithelial neoplasias | ||
| GC |  | CAG: Chronic atrophic gastritis |
| CAG with IM: Chronic atrophic gastritis with intestinal metaplasia | ||
| CSG: Chronic superficial gastritis | ||
| GC: Gastric cancer | ||
| SIM: Severe intestinal metaplasia | ||
| WIM: Wild intestinal metaplasia | ||
| Liver | 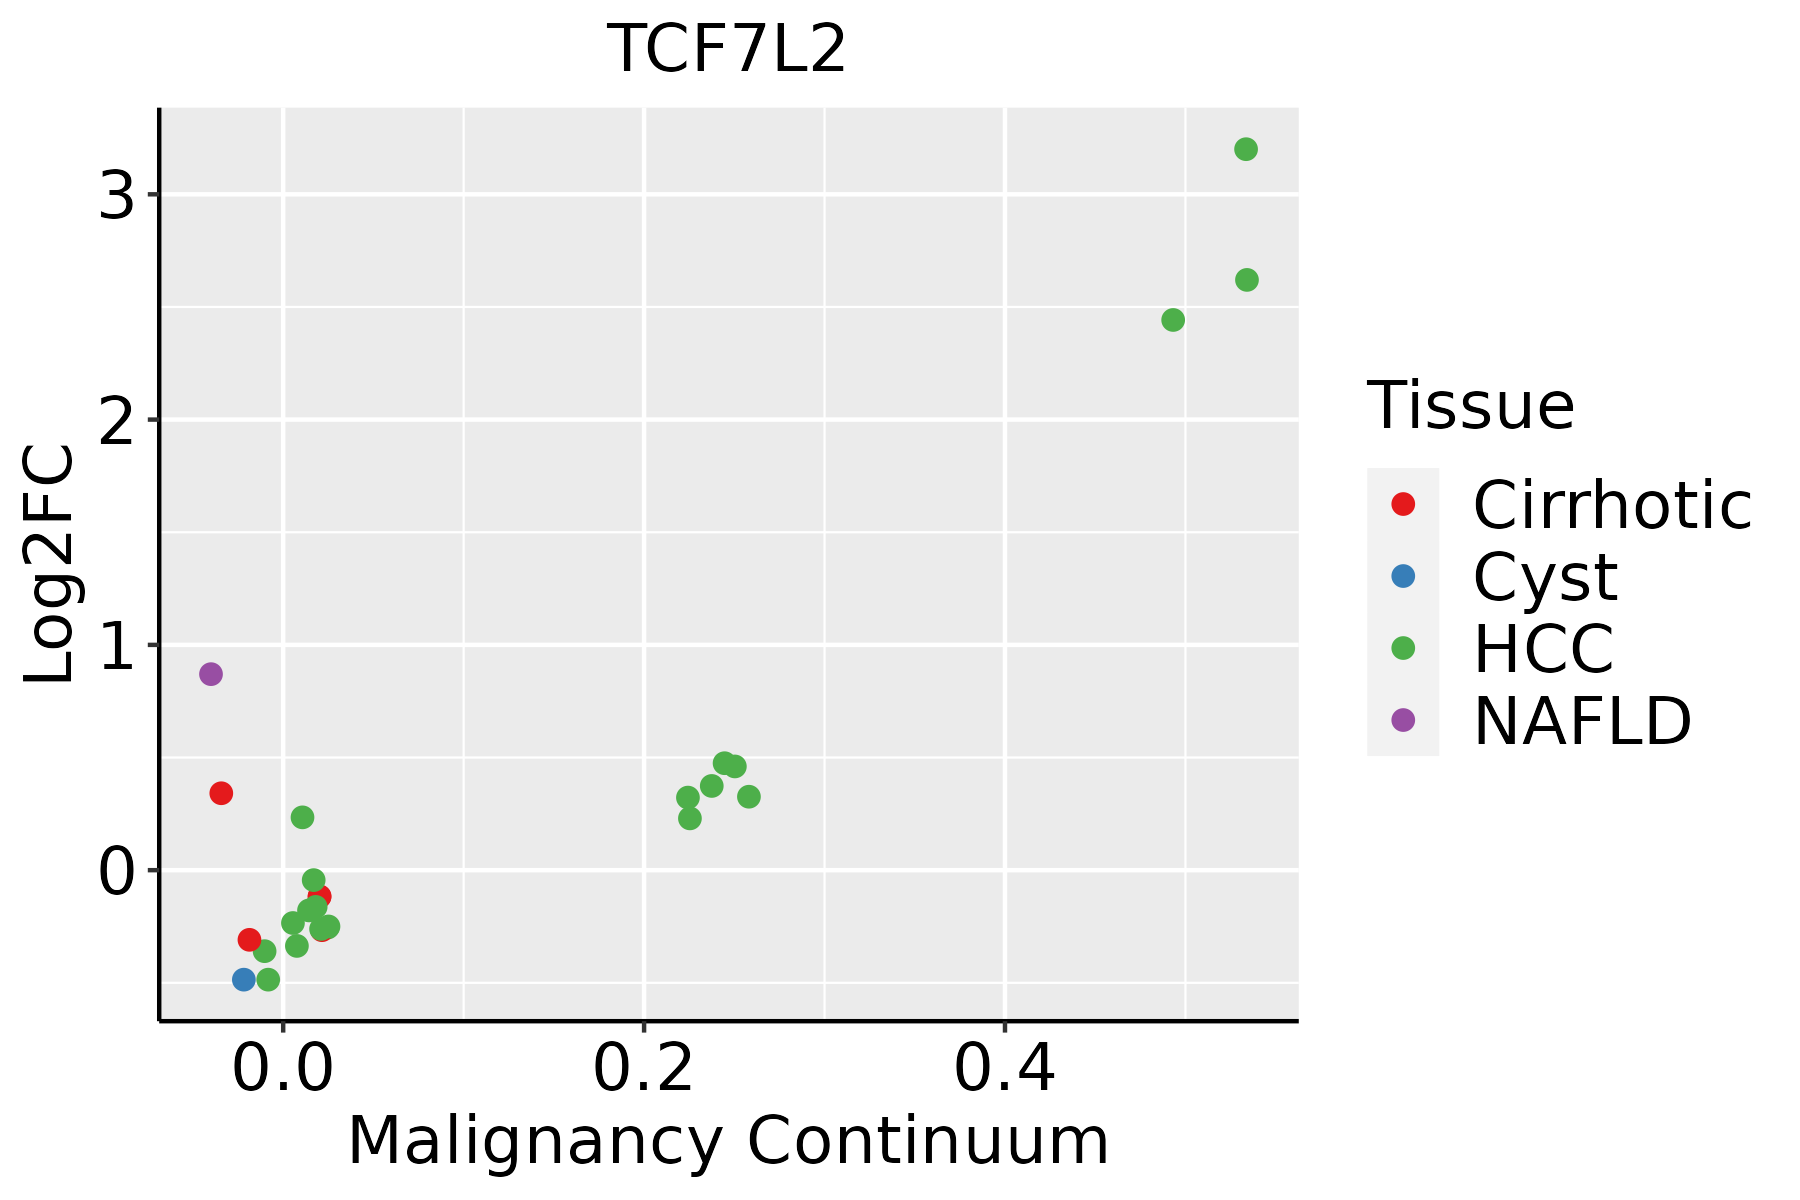 | HCC: Hepatocellular carcinoma |
| NAFLD: Non-alcoholic fatty liver disease | ||
| Lung |  | AAH: Atypical adenomatous hyperplasia |
| AIS: Adenocarcinoma in situ | ||
| IAC: Invasive lung adenocarcinoma | ||
| MIA: Minimally invasive adenocarcinoma | ||
| Prostate | 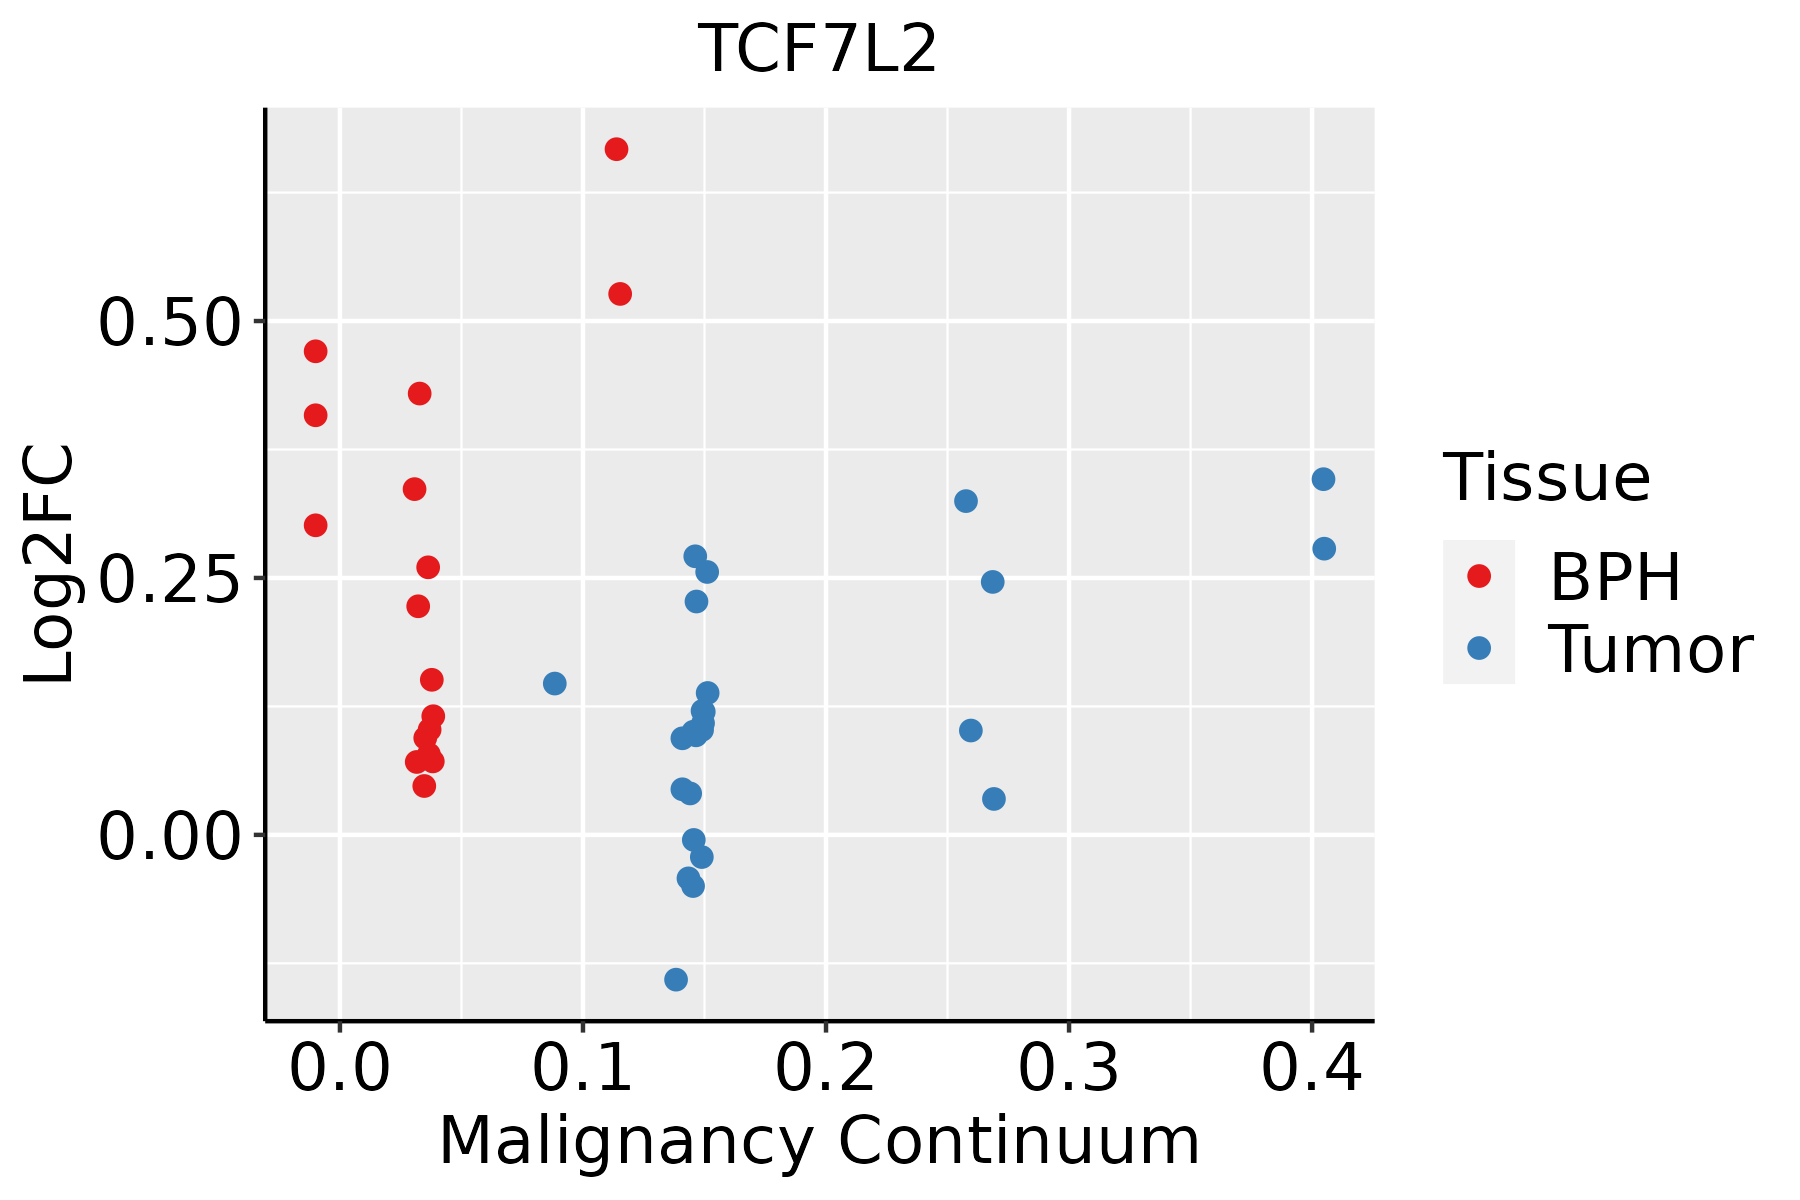 | BPH: Benign Prostatic Hyperplasia |
| Thyroid | 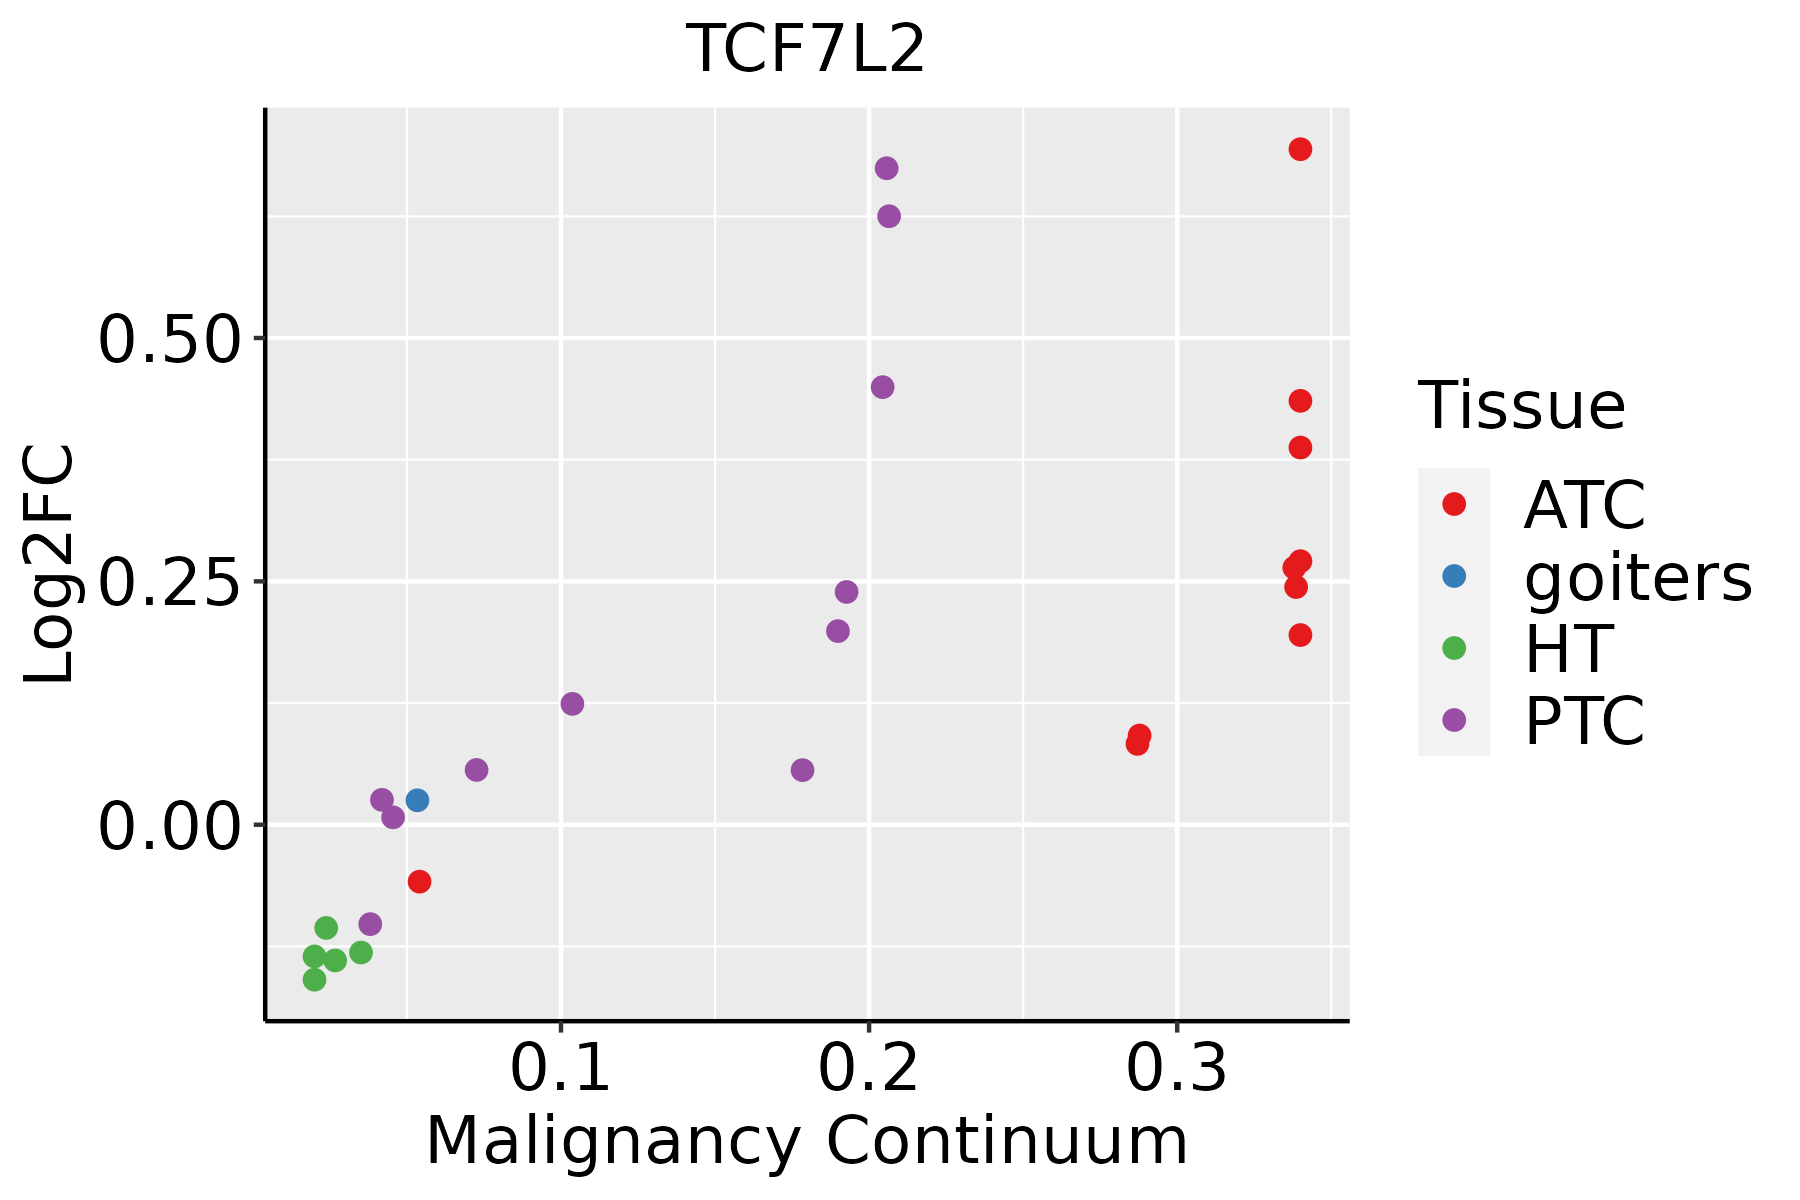 | ATC: Anaplastic thyroid cancer |
| HT: Hashimoto's thyroiditis | ||
| PTC: Papillary thyroid cancer |
| ∗log2FC in expression of this searched gene in stem-like cells from each diseased tissue sample relative to stem-like cells in normal samples in each tissue plotted against the malignancy continuum. Samples are colored based on if they are from different disease stage. |
Top |
Malignant transformation related pathway analysis |
| Find out the enriched GO biological processes and KEGG pathways involved in transition from healthy to precancer to cancer |
| Tissue | Disease Stage | Enriched GO biological Processes |
| Colorectum | AD |  |
| Colorectum | SER |  |
| Colorectum | MSS |  |
| Colorectum | MSI-H |  |
| Colorectum | FAP |  |
| ∗Top 15 enriched GO BP terms are showed in the bar plot of each disease state in each tissue. Each row represents a significant GO biological process which is colored according to the -log10(p.adjust). |
| Page: 1 2 3 4 5 6 7 8 9 |
| GO ID | Tissue | Disease Stage | Description | Gene Ratio | Bg Ratio | pvalue | p.adjust | Count |
| GO:200123310 | Cervix | CC | regulation of apoptotic signaling pathway | 96/2311 | 356/18723 | 4.08e-14 | 3.05e-11 | 96 |
| GO:00506737 | Cervix | CC | epithelial cell proliferation | 98/2311 | 437/18723 | 2.01e-09 | 2.15e-07 | 98 |
| GO:00160557 | Cervix | CC | Wnt signaling pathway | 98/2311 | 444/18723 | 4.82e-09 | 4.65e-07 | 98 |
| GO:01987387 | Cervix | CC | cell-cell signaling by wnt | 98/2311 | 446/18723 | 6.16e-09 | 5.58e-07 | 98 |
| GO:005122210 | Cervix | CC | positive regulation of protein transport | 72/2311 | 303/18723 | 2.36e-08 | 1.70e-06 | 72 |
| GO:00301117 | Cervix | CC | regulation of Wnt signaling pathway | 76/2311 | 328/18723 | 3.05e-08 | 2.08e-06 | 76 |
| GO:00069139 | Cervix | CC | nucleocytoplasmic transport | 71/2311 | 301/18723 | 4.04e-08 | 2.54e-06 | 71 |
| GO:00511699 | Cervix | CC | nuclear transport | 71/2311 | 301/18723 | 4.04e-08 | 2.54e-06 | 71 |
| GO:190495110 | Cervix | CC | positive regulation of establishment of protein localization | 73/2311 | 319/18723 | 9.69e-08 | 5.25e-06 | 73 |
| GO:00506787 | Cervix | CC | regulation of epithelial cell proliferation | 83/2311 | 381/18723 | 1.31e-07 | 6.42e-06 | 83 |
| GO:005109810 | Cervix | CC | regulation of binding | 80/2311 | 363/18723 | 1.32e-07 | 6.42e-06 | 80 |
| GO:200123410 | Cervix | CC | negative regulation of apoptotic signaling pathway | 56/2311 | 224/18723 | 1.39e-07 | 6.70e-06 | 56 |
| GO:00608287 | Cervix | CC | regulation of canonical Wnt signaling pathway | 58/2311 | 253/18723 | 1.83e-06 | 5.89e-05 | 58 |
| GO:009719110 | Cervix | CC | extrinsic apoptotic signaling pathway | 52/2311 | 219/18723 | 2.06e-06 | 6.34e-05 | 52 |
| GO:00600707 | Cervix | CC | canonical Wnt signaling pathway | 66/2311 | 303/18723 | 2.47e-06 | 7.35e-05 | 66 |
| GO:00468229 | Cervix | CC | regulation of nucleocytoplasmic transport | 31/2311 | 106/18723 | 2.68e-06 | 7.87e-05 | 31 |
| GO:00903167 | Cervix | CC | positive regulation of intracellular protein transport | 41/2311 | 160/18723 | 3.24e-06 | 8.80e-05 | 41 |
| GO:00323868 | Cervix | CC | regulation of intracellular transport | 71/2311 | 337/18723 | 3.70e-06 | 9.74e-05 | 71 |
| GO:00454445 | Cervix | CC | fat cell differentiation | 53/2311 | 229/18723 | 3.72e-06 | 9.75e-05 | 53 |
| GO:00510904 | Cervix | CC | regulation of DNA-binding transcription factor activity | 87/2311 | 440/18723 | 4.85e-06 | 1.22e-04 | 87 |
| Page: 1 2 3 4 5 6 7 8 9 10 11 12 13 14 15 16 17 18 19 20 21 22 23 24 25 26 27 28 29 30 31 32 33 34 35 36 37 38 39 40 41 42 43 44 45 46 47 48 49 50 51 52 |
| Pathway ID | Tissue | Disease Stage | Description | Gene Ratio | Bg Ratio | pvalue | p.adjust | qvalue | Count |
| hsa0513220 | Cervix | CC | Salmonella infection | 74/1267 | 249/8465 | 1.33e-09 | 2.54e-08 | 1.50e-08 | 74 |
| hsa0516720 | Cervix | CC | Kaposi sarcoma-associated herpesvirus infection | 60/1267 | 194/8465 | 9.74e-09 | 1.58e-07 | 9.33e-08 | 60 |
| hsa0452020 | Cervix | CC | Adherens junction | 33/1267 | 93/8465 | 6.99e-07 | 7.31e-06 | 4.32e-06 | 33 |
| hsa0521010 | Cervix | CC | Colorectal cancer | 27/1267 | 86/8465 | 8.60e-05 | 5.57e-04 | 3.30e-04 | 27 |
| hsa051657 | Cervix | CC | Human papillomavirus infection | 74/1267 | 331/8465 | 1.70e-04 | 1.02e-03 | 6.03e-04 | 74 |
| hsa043109 | Cervix | CC | Wnt signaling pathway | 43/1267 | 171/8465 | 3.03e-04 | 1.64e-03 | 9.68e-04 | 43 |
| hsa043908 | Cervix | CC | Hippo signaling pathway | 40/1267 | 157/8465 | 3.64e-04 | 1.82e-03 | 1.07e-03 | 40 |
| hsa052157 | Cervix | CC | Prostate cancer | 27/1267 | 97/8465 | 7.54e-04 | 3.39e-03 | 2.01e-03 | 27 |
| hsa0521310 | Cervix | CC | Endometrial cancer | 18/1267 | 58/8465 | 1.46e-03 | 6.30e-03 | 3.73e-03 | 18 |
| hsa0522510 | Cervix | CC | Hepatocellular carcinoma | 40/1267 | 168/8465 | 1.52e-03 | 6.39e-03 | 3.78e-03 | 40 |
| hsa05224 | Cervix | CC | Breast cancer | 32/1267 | 147/8465 | 1.66e-02 | 4.88e-02 | 2.88e-02 | 32 |
| hsa05132110 | Cervix | CC | Salmonella infection | 74/1267 | 249/8465 | 1.33e-09 | 2.54e-08 | 1.50e-08 | 74 |
| hsa05167110 | Cervix | CC | Kaposi sarcoma-associated herpesvirus infection | 60/1267 | 194/8465 | 9.74e-09 | 1.58e-07 | 9.33e-08 | 60 |
| hsa04520110 | Cervix | CC | Adherens junction | 33/1267 | 93/8465 | 6.99e-07 | 7.31e-06 | 4.32e-06 | 33 |
| hsa0521015 | Cervix | CC | Colorectal cancer | 27/1267 | 86/8465 | 8.60e-05 | 5.57e-04 | 3.30e-04 | 27 |
| hsa0516512 | Cervix | CC | Human papillomavirus infection | 74/1267 | 331/8465 | 1.70e-04 | 1.02e-03 | 6.03e-04 | 74 |
| hsa0431012 | Cervix | CC | Wnt signaling pathway | 43/1267 | 171/8465 | 3.03e-04 | 1.64e-03 | 9.68e-04 | 43 |
| hsa0439013 | Cervix | CC | Hippo signaling pathway | 40/1267 | 157/8465 | 3.64e-04 | 1.82e-03 | 1.07e-03 | 40 |
| hsa0521512 | Cervix | CC | Prostate cancer | 27/1267 | 97/8465 | 7.54e-04 | 3.39e-03 | 2.01e-03 | 27 |
| hsa0521313 | Cervix | CC | Endometrial cancer | 18/1267 | 58/8465 | 1.46e-03 | 6.30e-03 | 3.73e-03 | 18 |
| Page: 1 2 3 4 5 6 7 8 9 10 11 12 13 14 15 16 17 |
Top |
Cell-cell communication analysis |
| Identification of potential cell-cell interactions between two cell types and their ligand-receptor pairs for different disease states |
| Ligand | Receptor | LRpair | Pathway | Tissue | Disease Stage |
| Page: 1 |
Top |
Single-cell gene regulatory network inference analysis |
| Find out the significant the regulons (TFs) and the target genes of each regulon across cell types for different disease states |
| TF | Cell Type | Tissue | Disease Stage | Target Gene | RSS | Regulon Activity |
| TCF7L2 | INMON | Breast | Healthy | VCAN,MARCO,INHBA, etc. | 1.83e-01 |  |
| TCF7L2 | ADIPO | Colorectum | CRC | NRIP1,CEACAM1,SORL1, etc. | 1.95e-01 |  |
| TCF7L2 | ICAF | Endometrium | ADJ | DDR2,NFAT5,AC099489.1, etc. | 2.31e-03 |  |
| TCF7L2 | MYOFIB | Endometrium | ADJ | DDR2,NFAT5,AC099489.1, etc. | 0.00e+00 | |
| TCF7L2 | ICAF | Endometrium | AEH | DDR2,NFAT5,AC099489.1, etc. | 7.18e-03 |  |
| TCF7L2 | MYOFIB | Endometrium | AEH | DDR2,NFAT5,AC099489.1, etc. | 0.00e+00 | |
| TCF7L2 | MYOFIB | Endometrium | EEC | DDR2,NFAT5,AC099489.1, etc. | 1.44e-03 |  |
| TCF7L2 | LYMEND | Endometrium | Healthy | DDR2,NFAT5,AC099489.1, etc. | 4.44e-16 |  |
| TCF7L2 | FIB | Endometrium | Healthy | DDR2,NFAT5,AC099489.1, etc. | 5.70e-04 | |
| TCF7L2 | ICAF | Endometrium | Healthy | DDR2,NFAT5,AC099489.1, etc. | 1.04e-02 | |
| ∗The dot plots of a searched regulon are shown for all cell subpopulations in each disease state of each tissue based on the regulon specific score inferred using pySCENIC and by calculating the average expression. |
| Page: 1 2 3 4 |
Top |
Somatic mutation of malignant transformation related genes |
| Annotation of somatic variants for genes involved in malignant transformation |
| Hugo Symbol | Variant Class | Variant Classification | dbSNP RS | HGVSc | HGVSp | HGVSp Short | SWISSPROT | BIOTYPE | SIFT | PolyPhen | Tumor Sample Barcode | Tissue | Histology | Sex | Age | Stage | Therapy Types | Drugs | Outcome |
| TCF7L2 | SNV | Missense_Mutation | c.413C>T | p.Ser138Phe | p.S138F | Q9NQB0 | protein_coding | deleterious(0) | probably_damaging(0.989) | TCGA-AC-A23H-01 | Breast | breast invasive carcinoma | Female | >=65 | I/II | Unknown | Unknown | PD | |
| TCF7L2 | SNV | Missense_Mutation | novel | c.899N>T | p.Pro300Leu | p.P300L | Q9NQB0 | protein_coding | tolerated(0.19) | benign(0.425) | TCGA-AC-A6NO-01 | Breast | breast invasive carcinoma | Female | <65 | I/II | Unknown | Unknown | SD |
| TCF7L2 | SNV | Missense_Mutation | c.1255G>A | p.Ala419Thr | p.A419T | Q9NQB0 | protein_coding | deleterious(0) | probably_damaging(0.981) | TCGA-BH-A1FC-01 | Breast | breast invasive carcinoma | Female | >=65 | I/II | Unknown | Unknown | SD | |
| TCF7L2 | SNV | Missense_Mutation | c.931N>T | p.His311Tyr | p.H311Y | Q9NQB0 | protein_coding | deleterious(0) | possibly_damaging(0.648) | TCGA-C8-A1HI-01 | Breast | breast invasive carcinoma | Female | <65 | III/IV | Unknown | Unknown | SD | |
| TCF7L2 | SNV | Missense_Mutation | c.614C>T | p.Thr205Met | p.T205M | Q9NQB0 | protein_coding | tolerated(0.12) | possibly_damaging(0.687) | TCGA-2W-A8YY-01 | Cervix | cervical & endocervical cancer | Female | <65 | I/II | Chemotherapy | cisplatin | CR | |
| TCF7L2 | SNV | Missense_Mutation | c.166C>G | p.Gln56Glu | p.Q56E | Q9NQB0 | protein_coding | tolerated(0.56) | possibly_damaging(0.756) | TCGA-DG-A2KK-01 | Cervix | cervical & endocervical cancer | Female | <65 | III/IV | Chemotherapy | cisplatin | SD | |
| TCF7L2 | SNV | Missense_Mutation | novel | c.1079A>G | p.Tyr360Cys | p.Y360C | Q9NQB0 | protein_coding | deleterious(0) | probably_damaging(0.999) | TCGA-VS-A9UB-01 | Cervix | cervical & endocervical cancer | Female | <65 | I/II | Chemotherapy | cisplatin | CR |
| TCF7L2 | insertion | In_Frame_Ins | novel | c.535_536insCAC | p.Pro180dup | p.P180dup | Q9NQB0 | protein_coding | TCGA-C5-A7X3-01 | Cervix | cervical & endocervical cancer | Female | >=65 | III/IV | Chemotherapy | cisplatin | SD | ||
| TCF7L2 | SNV | Missense_Mutation | c.1258C>T | p.Arg420Trp | p.R420W | Q9NQB0 | protein_coding | deleterious(0) | probably_damaging(0.999) | TCGA-5M-AATA-01 | Colorectum | colon adenocarcinoma | Unknown | Unknown | I/II | Unknown | Unknown | Unknown | |
| TCF7L2 | SNV | Missense_Mutation | c.1411N>T | p.Arg471Cys | p.R471C | Q9NQB0 | protein_coding | deleterious(0) | possibly_damaging(0.857) | TCGA-A6-2681-01 | Colorectum | colon adenocarcinoma | Female | >=65 | I/II | Unknown | Unknown | PD |
| Page: 1 2 3 4 5 6 7 8 9 10 11 |
Top |
Related drugs of malignant transformation related genes |
| Identification of chemicals and drugs interact with genes involved in malignant transfromation |
| (DGIdb 4.0) |
| Entrez ID | Symbol | Category | Interaction Types | Drug Claim Name | Drug Name | PMIDs |
| 6934 | TCF7L2 | CLINICALLY ACTIONABLE, TRANSCRIPTION FACTOR | sulfonamides, urea derivatives | 21114608,17519421 | ||
| 6934 | TCF7L2 | CLINICALLY ACTIONABLE, TRANSCRIPTION FACTOR | tacrolimus | TACROLIMUS | 23041303,21857094 | |
| 6934 | TCF7L2 | CLINICALLY ACTIONABLE, TRANSCRIPTION FACTOR | Dipeptidyl peptidase 4 (DPP-4) inhibitors | 27166975 | ||
| 6934 | TCF7L2 | CLINICALLY ACTIONABLE, TRANSCRIPTION FACTOR | hydrochlorothiazide | HYDROCHLOROTHIAZIDE | ||
| 6934 | TCF7L2 | CLINICALLY ACTIONABLE, TRANSCRIPTION FACTOR | cyclosporine | CYCLOSPORINE | 23041303,21857094 | |
| 6934 | TCF7L2 | CLINICALLY ACTIONABLE, TRANSCRIPTION FACTOR | repaglinide | REPAGLINIDE | 20054294 | |
| 6934 | TCF7L2 | CLINICALLY ACTIONABLE, TRANSCRIPTION FACTOR | sirolimus | SIROLIMUS | 23041303,21857094 |
| Page: 1 |

Copyright 2023-Present -The University of Texas Health Science Center at Houston |