
|
|||||
|
 | |
| |
| |
| |
| |
| |
|
Gene: TCF7L1 |
Gene summary for TCF7L1 |
| Gene information | Species | Human | Gene symbol | TCF7L1 | Gene ID | 83439 |
| Gene name | transcription factor 7 like 1 | |
| Gene Alias | TCF-3 | |
| Cytomap | 2p11.2 | |
| Gene Type | protein-coding | GO ID | GO:0006139 | UniProtAcc | Q9HCS4 |
Top |
Malignant transformation analysis |
| Identification of the aberrant gene expression in precancerous and cancerous lesions by comparing the gene expression of stem-like cells in diseased tissues with normal stem cells |
| Entrez ID | Symbol | Replicates | Species | Organ | Tissue | Adj P-value | Log2FC | Malignancy |
| 83439 | TCF7L1 | AEH-subject1 | Human | Endometrium | AEH | 2.35e-04 | 2.48e-01 | -0.3059 |
| 83439 | TCF7L1 | AEH-subject5 | Human | Endometrium | AEH | 1.26e-02 | 2.26e-01 | -0.2953 |
| 83439 | TCF7L1 | EEC-subject1 | Human | Endometrium | EEC | 1.32e-04 | 3.02e-01 | -0.2682 |
| 83439 | TCF7L1 | GSM5276935 | Human | Endometrium | EEC | 2.27e-03 | 1.63e-01 | -0.123 |
| 83439 | TCF7L1 | GSM6177620_NYU_UCEC1_lib1_lib1 | Human | Endometrium | EEC | 4.12e-06 | 1.63e-01 | -0.1869 |
| 83439 | TCF7L1 | GSM6177620_NYU_UCEC1_lib2_lib2 | Human | Endometrium | EEC | 2.58e-04 | 4.01e-02 | -0.1875 |
| 83439 | TCF7L1 | GSM6177620_NYU_UCEC1_lib3_lib3 | Human | Endometrium | EEC | 1.71e-07 | 8.74e-02 | -0.1883 |
| 83439 | TCF7L1 | GSM6177621_NYU_UCEC2_lib1_lib1 | Human | Endometrium | EEC | 3.73e-08 | 2.46e-01 | -0.1934 |
| 83439 | TCF7L1 | GSM6177622_NYU_UCEC3_lib1_lib1 | Human | Endometrium | EEC | 1.44e-12 | 9.36e-02 | -0.1917 |
| 83439 | TCF7L1 | GSM6177622_NYU_UCEC3_lib2_lib2 | Human | Endometrium | EEC | 1.81e-08 | 7.43e-02 | -0.1916 |
| 83439 | TCF7L1 | P2T-E | Human | Esophagus | ESCC | 7.50e-27 | 5.58e-01 | 0.1177 |
| 83439 | TCF7L1 | P4T-E | Human | Esophagus | ESCC | 7.88e-08 | 1.41e-01 | 0.1323 |
| 83439 | TCF7L1 | P5T-E | Human | Esophagus | ESCC | 6.36e-06 | 6.13e-02 | 0.1327 |
| 83439 | TCF7L1 | P8T-E | Human | Esophagus | ESCC | 6.46e-08 | 1.41e-01 | 0.0889 |
| 83439 | TCF7L1 | P9T-E | Human | Esophagus | ESCC | 3.65e-02 | 3.77e-02 | 0.1131 |
| 83439 | TCF7L1 | P10T-E | Human | Esophagus | ESCC | 5.64e-11 | 1.54e-01 | 0.116 |
| 83439 | TCF7L1 | P12T-E | Human | Esophagus | ESCC | 8.17e-30 | 3.97e-01 | 0.1122 |
| 83439 | TCF7L1 | P15T-E | Human | Esophagus | ESCC | 5.54e-08 | 2.05e-01 | 0.1149 |
| 83439 | TCF7L1 | P16T-E | Human | Esophagus | ESCC | 8.32e-31 | 5.60e-01 | 0.1153 |
| 83439 | TCF7L1 | P20T-E | Human | Esophagus | ESCC | 2.24e-06 | 9.14e-02 | 0.1124 |
| Page: 1 2 3 4 |
| Tissue | Expression Dynamics | Abbreviation |
| Endometrium | 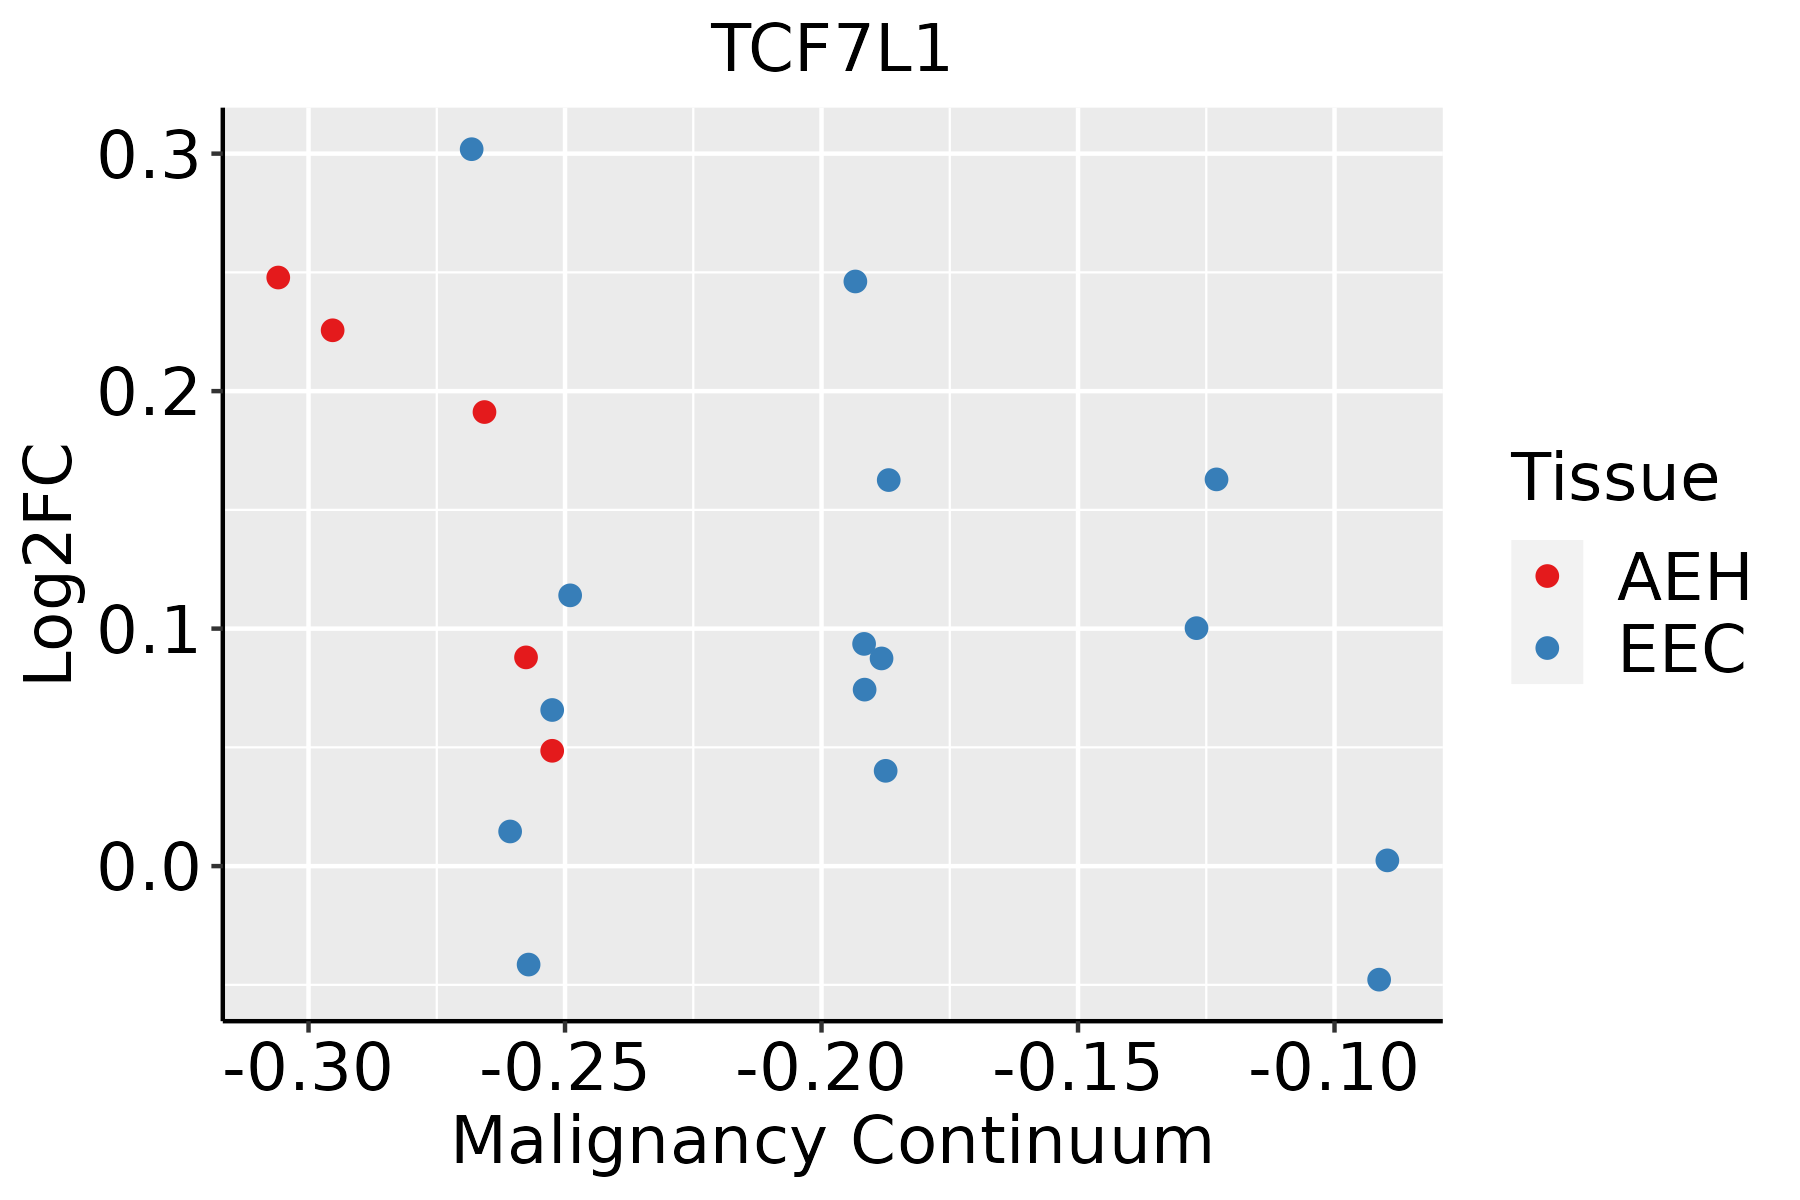 | AEH: Atypical endometrial hyperplasia |
| EEC: Endometrioid Cancer | ||
| Esophagus |  | ESCC: Esophageal squamous cell carcinoma |
| HGIN: High-grade intraepithelial neoplasias | ||
| LGIN: Low-grade intraepithelial neoplasias | ||
| Lung |  | AAH: Atypical adenomatous hyperplasia |
| AIS: Adenocarcinoma in situ | ||
| IAC: Invasive lung adenocarcinoma | ||
| MIA: Minimally invasive adenocarcinoma | ||
| Thyroid |  | ATC: Anaplastic thyroid cancer |
| HT: Hashimoto's thyroiditis | ||
| PTC: Papillary thyroid cancer |
| ∗log2FC in expression of this searched gene in stem-like cells from each diseased tissue sample relative to stem-like cells in normal samples in each tissue plotted against the malignancy continuum. Samples are colored based on if they are from different disease stage. |
Top |
Malignant transformation related pathway analysis |
| Find out the enriched GO biological processes and KEGG pathways involved in transition from healthy to precancer to cancer |
| Tissue | Disease Stage | Enriched GO biological Processes |
| Colorectum | AD |  |
| Colorectum | SER |  |
| Colorectum | MSS |  |
| Colorectum | MSI-H |  |
| Colorectum | FAP |  |
| ∗Top 15 enriched GO BP terms are showed in the bar plot of each disease state in each tissue. Each row represents a significant GO biological process which is colored according to the -log10(p.adjust). |
| Page: 1 2 3 4 5 6 7 8 9 |
| GO ID | Tissue | Disease Stage | Description | Gene Ratio | Bg Ratio | pvalue | p.adjust | Count |
| GO:00301118 | Endometrium | AEH | regulation of Wnt signaling pathway | 71/2100 | 328/18723 | 3.31e-08 | 1.87e-06 | 71 |
| GO:00160558 | Endometrium | AEH | Wnt signaling pathway | 85/2100 | 444/18723 | 4.99e-07 | 1.97e-05 | 85 |
| GO:01987388 | Endometrium | AEH | cell-cell signaling by wnt | 85/2100 | 446/18723 | 6.07e-07 | 2.29e-05 | 85 |
| GO:00600708 | Endometrium | AEH | canonical Wnt signaling pathway | 58/2100 | 303/18723 | 3.12e-05 | 5.66e-04 | 58 |
| GO:00063258 | Endometrium | AEH | chromatin organization | 64/2100 | 409/18723 | 3.69e-03 | 2.52e-02 | 64 |
| GO:003011113 | Endometrium | EEC | regulation of Wnt signaling pathway | 74/2168 | 328/18723 | 1.03e-08 | 6.47e-07 | 74 |
| GO:001605513 | Endometrium | EEC | Wnt signaling pathway | 90/2168 | 444/18723 | 6.65e-08 | 3.50e-06 | 90 |
| GO:019873813 | Endometrium | EEC | cell-cell signaling by wnt | 90/2168 | 446/18723 | 8.25e-08 | 4.23e-06 | 90 |
| GO:006007013 | Endometrium | EEC | canonical Wnt signaling pathway | 61/2168 | 303/18723 | 1.05e-05 | 2.25e-04 | 61 |
| GO:000632513 | Endometrium | EEC | chromatin organization | 65/2168 | 409/18723 | 4.98e-03 | 3.14e-02 | 65 |
| GO:001605517 | Esophagus | ESCC | Wnt signaling pathway | 268/8552 | 444/18723 | 2.32e-10 | 6.58e-09 | 268 |
| GO:019873817 | Esophagus | ESCC | cell-cell signaling by wnt | 269/8552 | 446/18723 | 2.41e-10 | 6.79e-09 | 269 |
| GO:000632517 | Esophagus | ESCC | chromatin organization | 240/8552 | 409/18723 | 6.52e-08 | 1.14e-06 | 240 |
| GO:003011117 | Esophagus | ESCC | regulation of Wnt signaling pathway | 194/8552 | 328/18723 | 5.39e-07 | 7.14e-06 | 194 |
| GO:006007016 | Esophagus | ESCC | canonical Wnt signaling pathway | 180/8552 | 303/18723 | 9.15e-07 | 1.17e-05 | 180 |
| GO:00160556 | Lung | IAC | Wnt signaling pathway | 95/2061 | 444/18723 | 1.13e-10 | 2.80e-08 | 95 |
| GO:01987386 | Lung | IAC | cell-cell signaling by wnt | 95/2061 | 446/18723 | 1.46e-10 | 3.48e-08 | 95 |
| GO:00301116 | Lung | IAC | regulation of Wnt signaling pathway | 74/2061 | 328/18723 | 1.14e-09 | 2.05e-07 | 74 |
| GO:00600706 | Lung | IAC | canonical Wnt signaling pathway | 61/2061 | 303/18723 | 2.09e-06 | 9.45e-05 | 61 |
| GO:00063256 | Lung | IAC | chromatin organization | 69/2061 | 409/18723 | 2.01e-04 | 3.53e-03 | 69 |
| Page: 1 2 |
| Pathway ID | Tissue | Disease Stage | Description | Gene Ratio | Bg Ratio | pvalue | p.adjust | qvalue | Count |
| hsa0513226 | Endometrium | AEH | Salmonella infection | 71/1197 | 249/8465 | 1.69e-09 | 3.44e-08 | 2.52e-08 | 71 |
| hsa0452025 | Endometrium | AEH | Adherens junction | 36/1197 | 93/8465 | 3.49e-09 | 5.98e-08 | 4.37e-08 | 36 |
| hsa043909 | Endometrium | AEH | Hippo signaling pathway | 38/1197 | 157/8465 | 4.79e-04 | 3.38e-03 | 2.47e-03 | 38 |
| hsa0521314 | Endometrium | AEH | Endometrial cancer | 18/1197 | 58/8465 | 7.42e-04 | 5.03e-03 | 3.68e-03 | 18 |
| hsa0516725 | Endometrium | AEH | Kaposi sarcoma-associated herpesvirus infection | 44/1197 | 194/8465 | 7.97e-04 | 5.28e-03 | 3.87e-03 | 44 |
| hsa052158 | Endometrium | AEH | Prostate cancer | 25/1197 | 97/8465 | 1.68e-03 | 1.01e-02 | 7.39e-03 | 25 |
| hsa0521610 | Endometrium | AEH | Thyroid cancer | 12/1197 | 37/8465 | 3.68e-03 | 2.14e-02 | 1.56e-02 | 12 |
| hsa0431010 | Endometrium | AEH | Wnt signaling pathway | 37/1197 | 171/8465 | 4.68e-03 | 2.53e-02 | 1.86e-02 | 37 |
| hsa05132112 | Endometrium | AEH | Salmonella infection | 71/1197 | 249/8465 | 1.69e-09 | 3.44e-08 | 2.52e-08 | 71 |
| hsa04520111 | Endometrium | AEH | Adherens junction | 36/1197 | 93/8465 | 3.49e-09 | 5.98e-08 | 4.37e-08 | 36 |
| hsa0439014 | Endometrium | AEH | Hippo signaling pathway | 38/1197 | 157/8465 | 4.79e-04 | 3.38e-03 | 2.47e-03 | 38 |
| hsa0521315 | Endometrium | AEH | Endometrial cancer | 18/1197 | 58/8465 | 7.42e-04 | 5.03e-03 | 3.68e-03 | 18 |
| hsa05167111 | Endometrium | AEH | Kaposi sarcoma-associated herpesvirus infection | 44/1197 | 194/8465 | 7.97e-04 | 5.28e-03 | 3.87e-03 | 44 |
| hsa0521513 | Endometrium | AEH | Prostate cancer | 25/1197 | 97/8465 | 1.68e-03 | 1.01e-02 | 7.39e-03 | 25 |
| hsa0521615 | Endometrium | AEH | Thyroid cancer | 12/1197 | 37/8465 | 3.68e-03 | 2.14e-02 | 1.56e-02 | 12 |
| hsa0431013 | Endometrium | AEH | Wnt signaling pathway | 37/1197 | 171/8465 | 4.68e-03 | 2.53e-02 | 1.86e-02 | 37 |
| hsa0513227 | Endometrium | EEC | Salmonella infection | 71/1237 | 249/8465 | 7.11e-09 | 1.30e-07 | 9.69e-08 | 71 |
| hsa0452026 | Endometrium | EEC | Adherens junction | 36/1237 | 93/8465 | 8.57e-09 | 1.48e-07 | 1.11e-07 | 36 |
| hsa0439023 | Endometrium | EEC | Hippo signaling pathway | 39/1237 | 157/8465 | 4.54e-04 | 3.47e-03 | 2.59e-03 | 39 |
| hsa0516726 | Endometrium | EEC | Kaposi sarcoma-associated herpesvirus infection | 45/1237 | 194/8465 | 8.55e-04 | 5.86e-03 | 4.37e-03 | 45 |
| Page: 1 2 3 4 |
Top |
Cell-cell communication analysis |
| Identification of potential cell-cell interactions between two cell types and their ligand-receptor pairs for different disease states |
| Ligand | Receptor | LRpair | Pathway | Tissue | Disease Stage |
| Page: 1 |
Top |
Single-cell gene regulatory network inference analysis |
| Find out the significant the regulons (TFs) and the target genes of each regulon across cell types for different disease states |
| TF | Cell Type | Tissue | Disease Stage | Target Gene | RSS | Regulon Activity |
| TCF7L1 | STM | Breast | DCIS | KRT14,IRS2,RHCG, etc. | 2.53e-01 |  |
| TCF7L1 | DC | Cervix | ADJ | CFD,PLAC9,DCN, etc. | 1.72e-01 |  |
| TCF7L1 | M2MAC | Cervix | CC | CFD,PLAC9,DCN, etc. | 2.39e-01 |  |
| TCF7L1 | PLA | Cervix | CC | CFD,PLAC9,DCN, etc. | 2.37e-01 | |
| TCF7L1 | M1MAC | Cervix | Healthy | CFD,PLAC9,DCN, etc. | 1.93e-01 |  |
| TCF7L1 | PVA | Endometrium | ADJ | RNF144B,FBN2,ZNF577, etc. | 3.68e-01 |  |
| TCF7L1 | PVA | Endometrium | AEH | RNF144B,FBN2,ZNF577, etc. | 3.59e-01 |  |
| TCF7L1 | MSC.SEC | Liver | Cirrhotic | PCSK5,LDB2,PPP1R16B, etc. | 3.14e-01 |  |
| TCF7L1 | MSC.SEC | Liver | Healthy | PCSK5,LDB2,PPP1R16B, etc. | 5.96e-01 |  |
| TCF7L1 | MSC.SEC | Liver | NAFLD | PCSK5,LDB2,PPP1R16B, etc. | 5.96e-01 |  |
| ∗The dot plots of a searched regulon are shown for all cell subpopulations in each disease state of each tissue based on the regulon specific score inferred using pySCENIC and by calculating the average expression. |
| Page: 1 2 3 4 |
Top |
Somatic mutation of malignant transformation related genes |
| Annotation of somatic variants for genes involved in malignant transformation |
| Hugo Symbol | Variant Class | Variant Classification | dbSNP RS | HGVSc | HGVSp | HGVSp Short | SWISSPROT | BIOTYPE | SIFT | PolyPhen | Tumor Sample Barcode | Tissue | Histology | Sex | Age | Stage | Therapy Types | Drugs | Outcome |
| TCF7L1 | SNV | Missense_Mutation | c.552N>A | p.His184Gln | p.H184Q | Q9HCS4 | protein_coding | tolerated(0.44) | possibly_damaging(0.602) | TCGA-EW-A1P4-01 | Breast | breast invasive carcinoma | Female | <65 | I/II | Chemotherapy | docetaxel | SD | |
| TCF7L1 | insertion | Frame_Shift_Ins | novel | c.501_502insC | p.Arg168GlnfsTer10 | p.R168Qfs*10 | Q9HCS4 | protein_coding | TCGA-AC-A3QQ-01 | Breast | breast invasive carcinoma | Female | <65 | I/II | Unknown | Unknown | SD | ||
| TCF7L1 | insertion | Frame_Shift_Ins | novel | c.502_503insGGGCTGACCAAGGAGGCAGAGGCTCCCAGAT | p.Ser169AlafsTer19 | p.S169Afs*19 | Q9HCS4 | protein_coding | TCGA-AC-A3QQ-01 | Breast | breast invasive carcinoma | Female | <65 | I/II | Unknown | Unknown | SD | ||
| TCF7L1 | SNV | Missense_Mutation | rs150938300 | c.667C>T | p.Arg223Trp | p.R223W | Q9HCS4 | protein_coding | deleterious(0) | probably_damaging(0.998) | TCGA-2W-A8YY-01 | Cervix | cervical & endocervical cancer | Female | <65 | I/II | Chemotherapy | cisplatin | CR |
| TCF7L1 | SNV | Missense_Mutation | c.148N>C | p.Glu50Gln | p.E50Q | Q9HCS4 | protein_coding | deleterious(0.02) | possibly_damaging(0.516) | TCGA-C5-A1BQ-01 | Cervix | cervical & endocervical cancer | Female | >=65 | III/IV | Chemotherapy | cisplatin | CR | |
| TCF7L1 | SNV | Missense_Mutation | c.606C>G | p.Phe202Leu | p.F202L | Q9HCS4 | protein_coding | deleterious(0) | benign(0.125) | TCGA-EK-A2R8-01 | Cervix | cervical & endocervical cancer | Female | <65 | I/II | Unknown | Unknown | SD | |
| TCF7L1 | SNV | Missense_Mutation | rs753284958 | c.901N>T | p.Pro301Ser | p.P301S | Q9HCS4 | protein_coding | tolerated(0.06) | benign(0.212) | TCGA-A6-6780-01 | Colorectum | colon adenocarcinoma | Male | >=65 | I/II | Unknown | Unknown | SD |
| TCF7L1 | SNV | Missense_Mutation | c.926N>A | p.Ala309Asp | p.A309D | Q9HCS4 | protein_coding | deleterious(0) | possibly_damaging(0.617) | TCGA-AA-3846-01 | Colorectum | colon adenocarcinoma | Female | >=65 | I/II | Unknown | Unknown | SD | |
| TCF7L1 | SNV | Missense_Mutation | c.334N>A | p.Ala112Thr | p.A112T | Q9HCS4 | protein_coding | tolerated(0.19) | possibly_damaging(0.532) | TCGA-DM-A1HB-01 | Colorectum | colon adenocarcinoma | Male | >=65 | III/IV | Unknown | Unknown | SD | |
| TCF7L1 | SNV | Missense_Mutation | novel | c.427N>A | p.Gly143Arg | p.G143R | Q9HCS4 | protein_coding | tolerated(0.26) | benign(0.015) | TCGA-G4-6588-01 | Colorectum | colon adenocarcinoma | Female | <65 | I/II | Unknown | Unknown | SD |
| Page: 1 2 3 4 5 |
Top |
Related drugs of malignant transformation related genes |
| Identification of chemicals and drugs interact with genes involved in malignant transfromation |
| (DGIdb 4.0) |
| Entrez ID | Symbol | Category | Interaction Types | Drug Claim Name | Drug Name | PMIDs |
| Page: 1 |

Copyright 2023-Present -The University of Texas Health Science Center at Houston |