
|
|||||
|
 | |
| |
| |
| |
| |
| |
|
Gene: TCF19 |
Gene summary for TCF19 |
| Gene information | Species | Human | Gene symbol | TCF19 | Gene ID | 6941 |
| Gene name | transcription factor 19 | |
| Gene Alias | SC1 | |
| Cytomap | 6p21.33 | |
| Gene Type | protein-coding | GO ID | GO:0008150 | UniProtAcc | A0A1U9X8M7 |
Top |
Malignant transformation analysis |
| Identification of the aberrant gene expression in precancerous and cancerous lesions by comparing the gene expression of stem-like cells in diseased tissues with normal stem cells |
| Entrez ID | Symbol | Replicates | Species | Organ | Tissue | Adj P-value | Log2FC | Malignancy |
| 6941 | TCF19 | LZE24T | Human | Esophagus | ESCC | 1.65e-03 | 1.07e-01 | 0.0596 |
| 6941 | TCF19 | P2T-E | Human | Esophagus | ESCC | 2.20e-17 | 3.48e-01 | 0.1177 |
| 6941 | TCF19 | P4T-E | Human | Esophagus | ESCC | 2.60e-05 | 1.22e-01 | 0.1323 |
| 6941 | TCF19 | P5T-E | Human | Esophagus | ESCC | 4.44e-08 | 2.04e-01 | 0.1327 |
| 6941 | TCF19 | P8T-E | Human | Esophagus | ESCC | 1.96e-05 | 1.34e-01 | 0.0889 |
| 6941 | TCF19 | P10T-E | Human | Esophagus | ESCC | 4.44e-08 | 1.85e-01 | 0.116 |
| 6941 | TCF19 | P16T-E | Human | Esophagus | ESCC | 4.31e-06 | 1.69e-01 | 0.1153 |
| 6941 | TCF19 | P17T-E | Human | Esophagus | ESCC | 2.25e-04 | 2.94e-01 | 0.1278 |
| 6941 | TCF19 | P21T-E | Human | Esophagus | ESCC | 2.03e-09 | 2.17e-01 | 0.1617 |
| 6941 | TCF19 | P22T-E | Human | Esophagus | ESCC | 2.03e-09 | 1.89e-01 | 0.1236 |
| 6941 | TCF19 | P24T-E | Human | Esophagus | ESCC | 1.96e-05 | 1.55e-01 | 0.1287 |
| 6941 | TCF19 | P26T-E | Human | Esophagus | ESCC | 1.66e-02 | 9.11e-02 | 0.1276 |
| 6941 | TCF19 | P28T-E | Human | Esophagus | ESCC | 3.75e-03 | 7.94e-02 | 0.1149 |
| 6941 | TCF19 | P31T-E | Human | Esophagus | ESCC | 9.44e-07 | 1.84e-01 | 0.1251 |
| 6941 | TCF19 | P32T-E | Human | Esophagus | ESCC | 4.40e-09 | 2.08e-01 | 0.1666 |
| 6941 | TCF19 | P37T-E | Human | Esophagus | ESCC | 4.88e-02 | 6.64e-02 | 0.1371 |
| 6941 | TCF19 | P42T-E | Human | Esophagus | ESCC | 2.34e-03 | 1.73e-01 | 0.1175 |
| 6941 | TCF19 | P48T-E | Human | Esophagus | ESCC | 4.17e-05 | 1.12e-01 | 0.0959 |
| 6941 | TCF19 | P52T-E | Human | Esophagus | ESCC | 5.79e-16 | 3.08e-01 | 0.1555 |
| 6941 | TCF19 | P62T-E | Human | Esophagus | ESCC | 5.76e-05 | 1.66e-01 | 0.1302 |
| Page: 1 2 3 |
| Tissue | Expression Dynamics | Abbreviation |
| Esophagus | 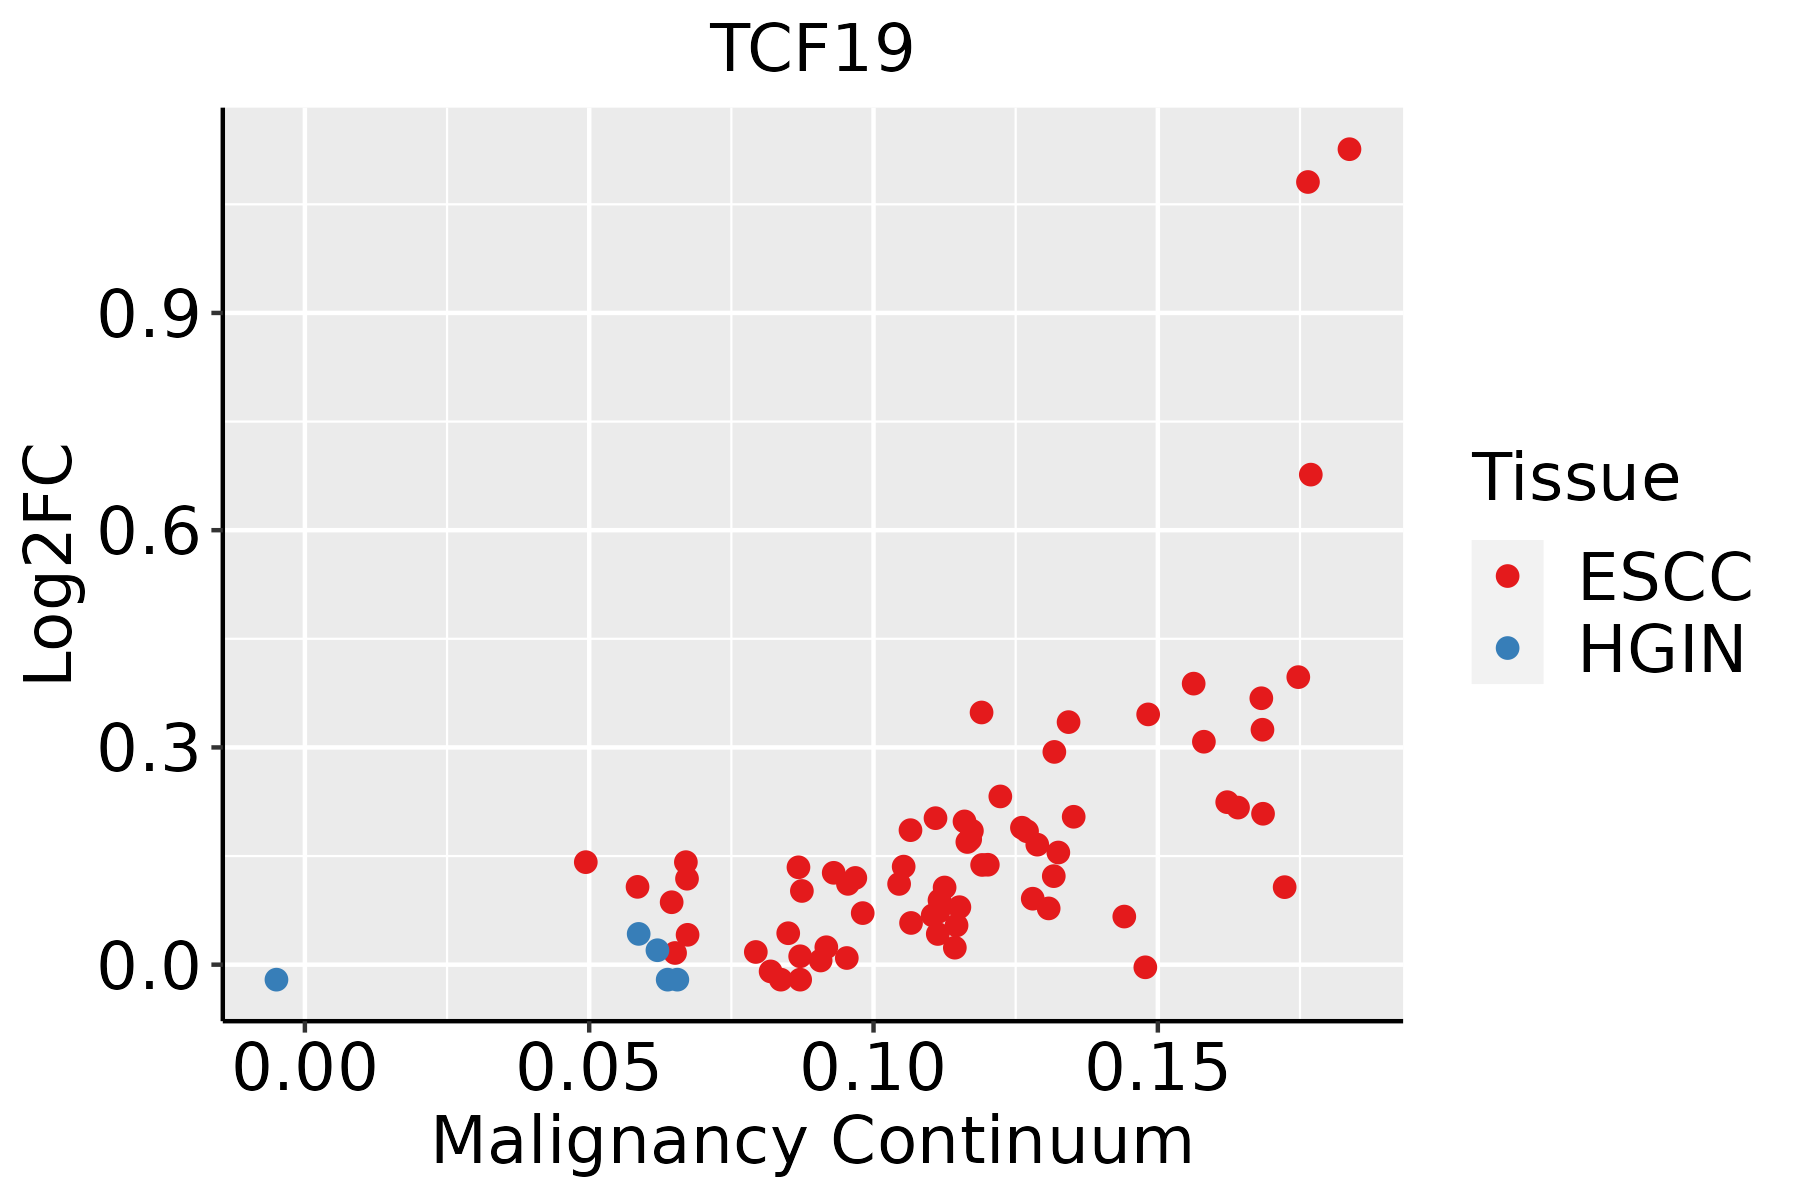 | ESCC: Esophageal squamous cell carcinoma |
| HGIN: High-grade intraepithelial neoplasias | ||
| LGIN: Low-grade intraepithelial neoplasias | ||
| Oral Cavity | 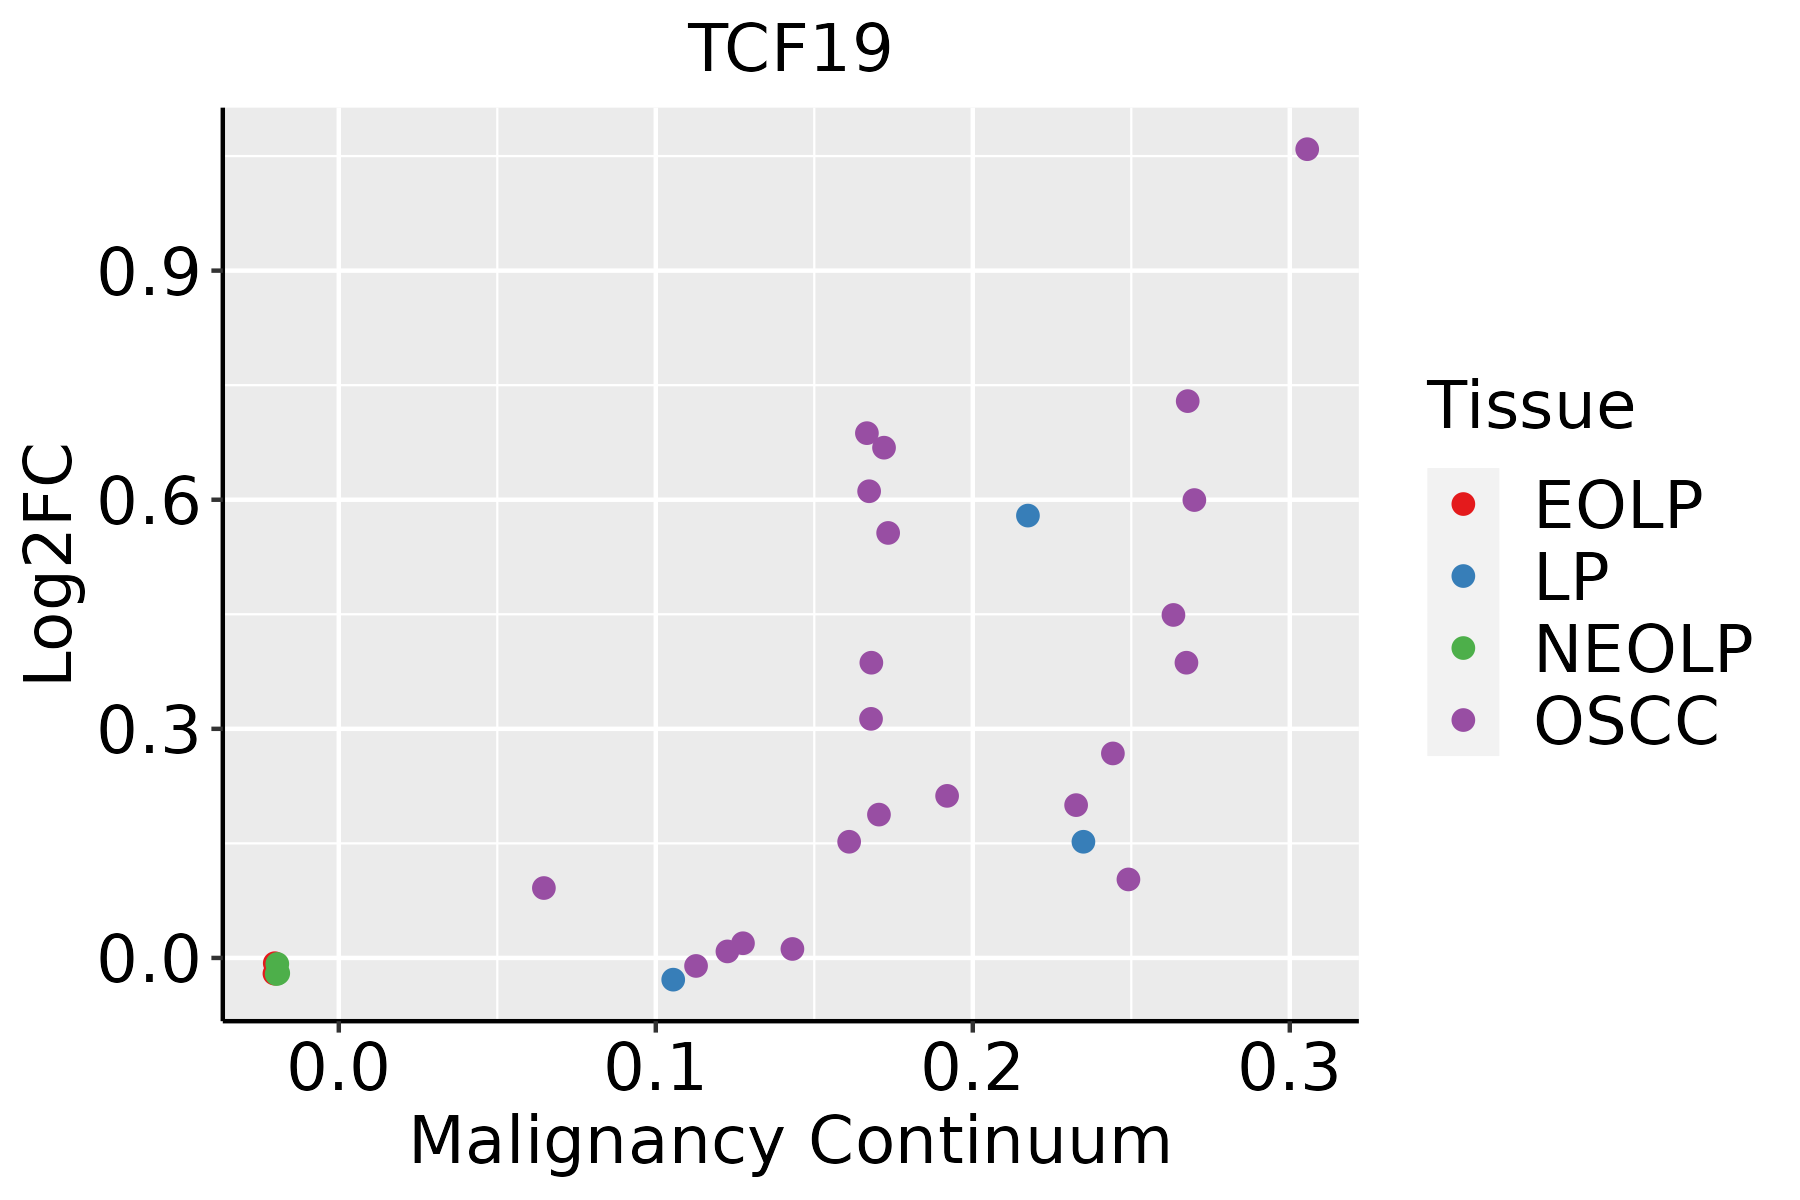 | EOLP: Erosive Oral lichen planus |
| LP: leukoplakia | ||
| NEOLP: Non-erosive oral lichen planus | ||
| OSCC: Oral squamous cell carcinoma |
| ∗log2FC in expression of this searched gene in stem-like cells from each diseased tissue sample relative to stem-like cells in normal samples in each tissue plotted against the malignancy continuum. Samples are colored based on if they are from different disease stage. |
Top |
Malignant transformation related pathway analysis |
| Find out the enriched GO biological processes and KEGG pathways involved in transition from healthy to precancer to cancer |
| Tissue | Disease Stage | Enriched GO biological Processes |
| Colorectum | AD |  |
| Colorectum | SER |  |
| Colorectum | MSS |  |
| Colorectum | MSI-H |  |
| Colorectum | FAP |  |
| ∗Top 15 enriched GO BP terms are showed in the bar plot of each disease state in each tissue. Each row represents a significant GO biological process which is colored according to the -log10(p.adjust). |
| Page: 1 2 3 4 5 6 7 8 9 |
| GO ID | Tissue | Disease Stage | Description | Gene Ratio | Bg Ratio | pvalue | p.adjust | Count |
| Page: 1 |
| Pathway ID | Tissue | Disease Stage | Description | Gene Ratio | Bg Ratio | pvalue | p.adjust | qvalue | Count |
| Page: 1 |
Top |
Cell-cell communication analysis |
| Identification of potential cell-cell interactions between two cell types and their ligand-receptor pairs for different disease states |
| Ligand | Receptor | LRpair | Pathway | Tissue | Disease Stage |
| Page: 1 |
Top |
Single-cell gene regulatory network inference analysis |
| Find out the significant the regulons (TFs) and the target genes of each regulon across cell types for different disease states |
| TF | Cell Type | Tissue | Disease Stage | Target Gene | RSS | Regulon Activity |
| ∗The dot plots of a searched regulon are shown for all cell subpopulations in each disease state of each tissue based on the regulon specific score inferred using pySCENIC and by calculating the average expression. |
| Page: 1 |
Top |
Somatic mutation of malignant transformation related genes |
| Annotation of somatic variants for genes involved in malignant transformation |
| Hugo Symbol | Variant Class | Variant Classification | dbSNP RS | HGVSc | HGVSp | HGVSp Short | SWISSPROT | BIOTYPE | SIFT | PolyPhen | Tumor Sample Barcode | Tissue | Histology | Sex | Age | Stage | Therapy Types | Drugs | Outcome |
| TCF19 | SNV | Missense_Mutation | rs767412829 | c.199G>A | p.Asp67Asn | p.D67N | Q9Y242 | protein_coding | tolerated(0.14) | benign(0.441) | TCGA-D8-A1JA-01 | Breast | breast invasive carcinoma | Female | <65 | III/IV | Chemotherapy | adriamycin | PD |
| TCF19 | SNV | Missense_Mutation | rs762889350 | c.556C>T | p.Arg186Trp | p.R186W | Q9Y242 | protein_coding | deleterious(0) | benign(0.23) | TCGA-AZ-6601-01 | Colorectum | colon adenocarcinoma | Male | >=65 | I/II | Unknown | Unknown | PD |
| TCF19 | SNV | Missense_Mutation | c.935G>A | p.Gly312Asp | p.G312D | Q9Y242 | protein_coding | tolerated(0.66) | possibly_damaging(0.602) | TCGA-G4-6628-01 | Colorectum | colon adenocarcinoma | Male | >=65 | I/II | Unknown | Unknown | SD | |
| TCF19 | SNV | Missense_Mutation | c.472N>A | p.Ala158Thr | p.A158T | Q9Y242 | protein_coding | tolerated(0.21) | benign(0.009) | TCGA-WS-AB45-01 | Colorectum | colon adenocarcinoma | Female | <65 | I/II | Unknown | Unknown | SD | |
| TCF19 | SNV | Missense_Mutation | rs761157384 | c.616N>A | p.Ala206Thr | p.A206T | Q9Y242 | protein_coding | tolerated(1) | benign(0) | TCGA-EI-6917-01 | Colorectum | rectum adenocarcinoma | Male | <65 | III/IV | Chemotherapy | 5fluorouracil+oxaciplatina+l-folinian | SD |
| TCF19 | insertion | Frame_Shift_Ins | rs763666737 | c.65_66insC | p.Ala25ArgfsTer17 | p.A25Rfs*17 | Q9Y242 | protein_coding | TCGA-D5-6540-01 | Colorectum | colon adenocarcinoma | Male | >=65 | I/II | Unknown | Unknown | SD | ||
| TCF19 | SNV | Missense_Mutation | c.839N>A | p.Pro280His | p.P280H | Q9Y242 | protein_coding | tolerated(0.07) | benign(0.001) | TCGA-A5-A0G2-01 | Endometrium | uterine corpus endometrioid carcinoma | Female | <65 | III/IV | Unknown | Unknown | SD | |
| TCF19 | SNV | Missense_Mutation | novel | c.31N>T | p.Gly11Trp | p.G11W | Q9Y242 | protein_coding | deleterious(0) | probably_damaging(1) | TCGA-A5-A1OF-01 | Endometrium | uterine corpus endometrioid carcinoma | Female | <65 | I/II | Unknown | Unknown | SD |
| TCF19 | SNV | Missense_Mutation | novel | c.931G>C | p.Asp311His | p.D311H | Q9Y242 | protein_coding | deleterious(0) | probably_damaging(0.999) | TCGA-AP-A3K1-01 | Endometrium | uterine corpus endometrioid carcinoma | Female | <65 | III/IV | Chemotherapy | carboplatin | PD |
| TCF19 | SNV | Missense_Mutation | novel | c.559N>T | p.Pro187Ser | p.P187S | Q9Y242 | protein_coding | tolerated(0.37) | benign(0.003) | TCGA-AX-A1C4-01 | Endometrium | uterine corpus endometrioid carcinoma | Female | <65 | I/II | Unknown | Unknown | SD |
| Page: 1 2 3 |
Top |
Related drugs of malignant transformation related genes |
| Identification of chemicals and drugs interact with genes involved in malignant transfromation |
| (DGIdb 4.0) |
| Entrez ID | Symbol | Category | Interaction Types | Drug Claim Name | Drug Name | PMIDs |
| 6941 | TCF19 | TRANSCRIPTION FACTOR | nevirapine | NEVIRAPINE | 21810746 |
| Page: 1 |

Copyright 2023-Present -The University of Texas Health Science Center at Houston |