
|
|||||
|
 | |
| |
| |
| |
| |
| |
|
Gene: TCF12 |
Gene summary for TCF12 |
| Gene information | Species | Human | Gene symbol | TCF12 | Gene ID | 6938 |
| Gene name | transcription factor 12 | |
| Gene Alias | CRS3 | |
| Cytomap | 15q21.3 | |
| Gene Type | protein-coding | GO ID | GO:0002376 | UniProtAcc | F5GY10 |
Top |
Malignant transformation analysis |
| Identification of the aberrant gene expression in precancerous and cancerous lesions by comparing the gene expression of stem-like cells in diseased tissues with normal stem cells |
| Entrez ID | Symbol | Replicates | Species | Organ | Tissue | Adj P-value | Log2FC | Malignancy |
| 6938 | TCF12 | CCI_1 | Human | Cervix | CC | 3.49e-14 | 1.66e+00 | 0.528 |
| 6938 | TCF12 | CCI_2 | Human | Cervix | CC | 1.24e-20 | 1.66e+00 | 0.5249 |
| 6938 | TCF12 | CCI_3 | Human | Cervix | CC | 1.32e-15 | 1.03e+00 | 0.516 |
| 6938 | TCF12 | HTA11_3410_2000001011 | Human | Colorectum | AD | 7.17e-37 | -7.48e-01 | 0.0155 |
| 6938 | TCF12 | HTA11_2951_2000001011 | Human | Colorectum | AD | 5.45e-08 | -6.66e-01 | 0.0216 |
| 6938 | TCF12 | HTA11_347_2000001011 | Human | Colorectum | AD | 2.42e-03 | 3.79e-01 | -0.1954 |
| 6938 | TCF12 | HTA11_3361_2000001011 | Human | Colorectum | AD | 4.36e-11 | -6.43e-01 | -0.1207 |
| 6938 | TCF12 | HTA11_696_2000001011 | Human | Colorectum | AD | 2.11e-11 | -3.88e-01 | -0.1464 |
| 6938 | TCF12 | HTA11_2992_2000001011 | Human | Colorectum | SER | 4.66e-05 | -5.91e-01 | -0.1706 |
| 6938 | TCF12 | HTA11_5212_2000001011 | Human | Colorectum | AD | 7.71e-14 | -7.40e-01 | -0.2061 |
| 6938 | TCF12 | HTA11_5216_2000001011 | Human | Colorectum | SER | 1.02e-03 | -4.51e-01 | -0.1462 |
| 6938 | TCF12 | HTA11_9341_2000001011 | Human | Colorectum | SER | 1.58e-06 | -9.02e-01 | -0.00410000000000005 |
| 6938 | TCF12 | HTA11_7862_2000001011 | Human | Colorectum | AD | 1.92e-04 | -6.01e-01 | -0.0179 |
| 6938 | TCF12 | HTA11_866_3004761011 | Human | Colorectum | AD | 1.02e-09 | -5.75e-01 | 0.096 |
| 6938 | TCF12 | HTA11_8622_2000001021 | Human | Colorectum | SER | 3.58e-07 | -6.43e-01 | 0.0528 |
| 6938 | TCF12 | HTA11_7696_3000711011 | Human | Colorectum | AD | 3.94e-12 | -4.78e-01 | 0.0674 |
| 6938 | TCF12 | HTA11_6818_2000001011 | Human | Colorectum | AD | 2.43e-03 | -4.18e-01 | 0.0112 |
| 6938 | TCF12 | HTA11_7469_2000001011 | Human | Colorectum | AD | 8.40e-07 | -7.33e-01 | -0.0124 |
| 6938 | TCF12 | HTA11_11156_2000001011 | Human | Colorectum | AD | 5.38e-09 | -9.01e-01 | 0.0397 |
| 6938 | TCF12 | HTA11_6818_2000001021 | Human | Colorectum | AD | 3.88e-04 | -4.75e-01 | 0.0588 |
| Page: 1 2 3 4 5 6 7 8 9 10 11 12 |
| Tissue | Expression Dynamics | Abbreviation |
| Cervix | 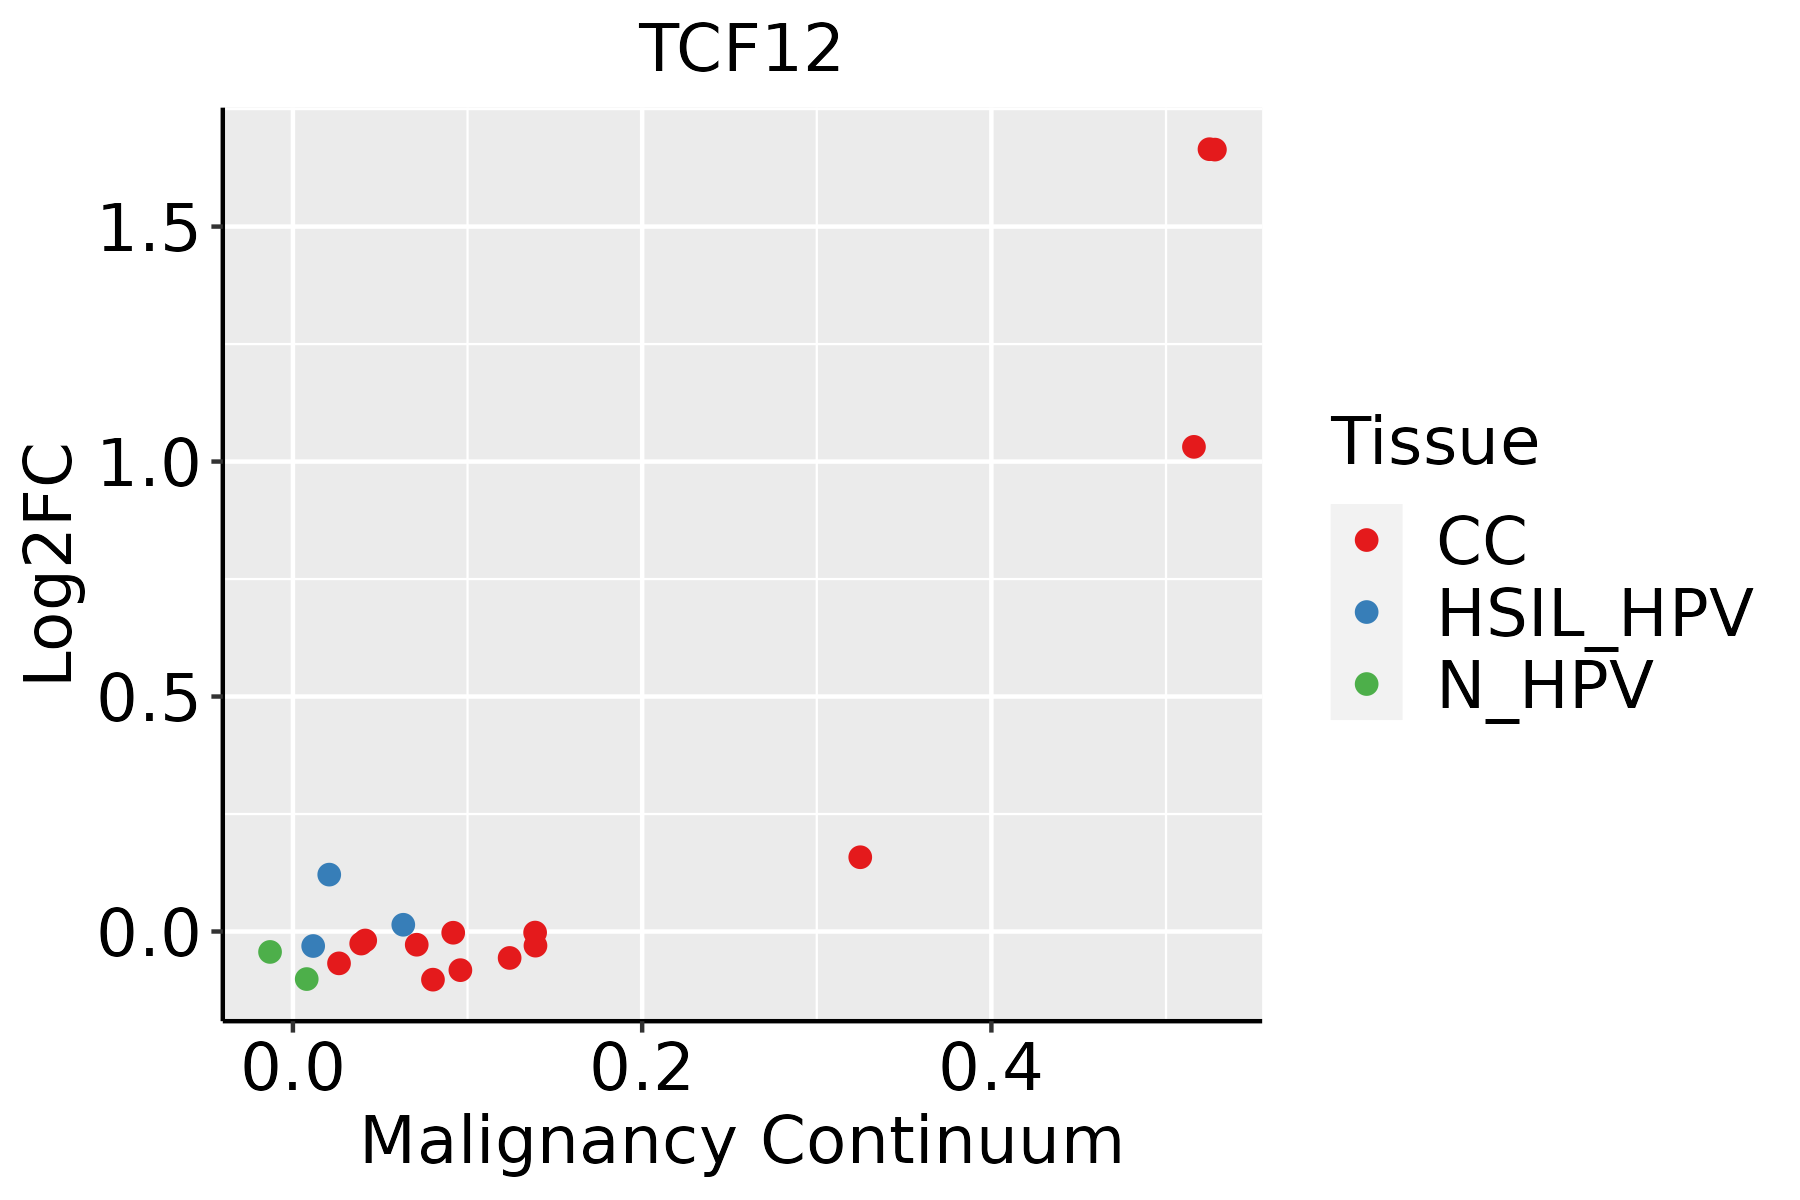 | CC: Cervix cancer |
| HSIL_HPV: HPV-infected high-grade squamous intraepithelial lesions | ||
| N_HPV: HPV-infected normal cervix | ||
| Colorectum (GSE201348) |  | FAP: Familial adenomatous polyposis |
| CRC: Colorectal cancer | ||
| Colorectum (HTA11) |  | AD: Adenomas |
| SER: Sessile serrated lesions | ||
| MSI-H: Microsatellite-high colorectal cancer | ||
| MSS: Microsatellite stable colorectal cancer | ||
| Endometrium | 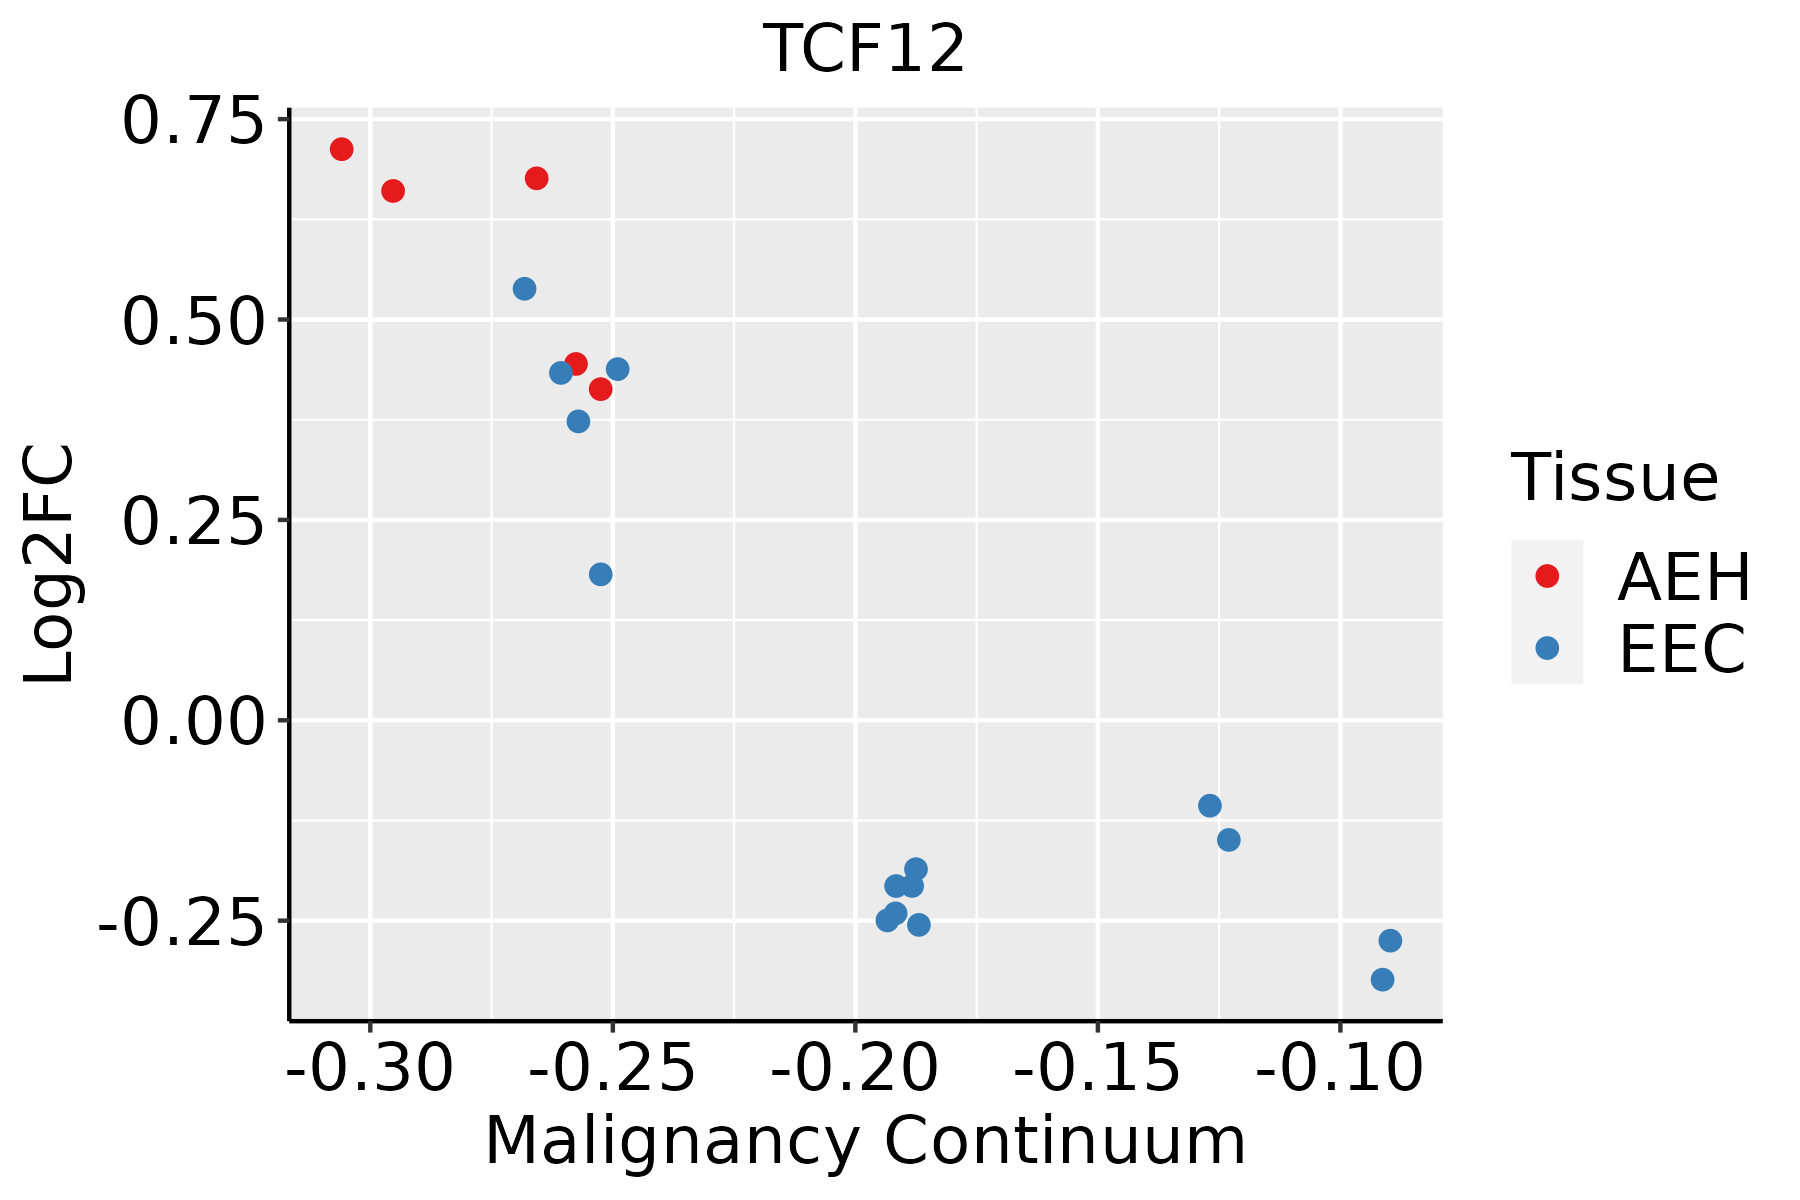 | AEH: Atypical endometrial hyperplasia |
| EEC: Endometrioid Cancer | ||
| Esophagus | 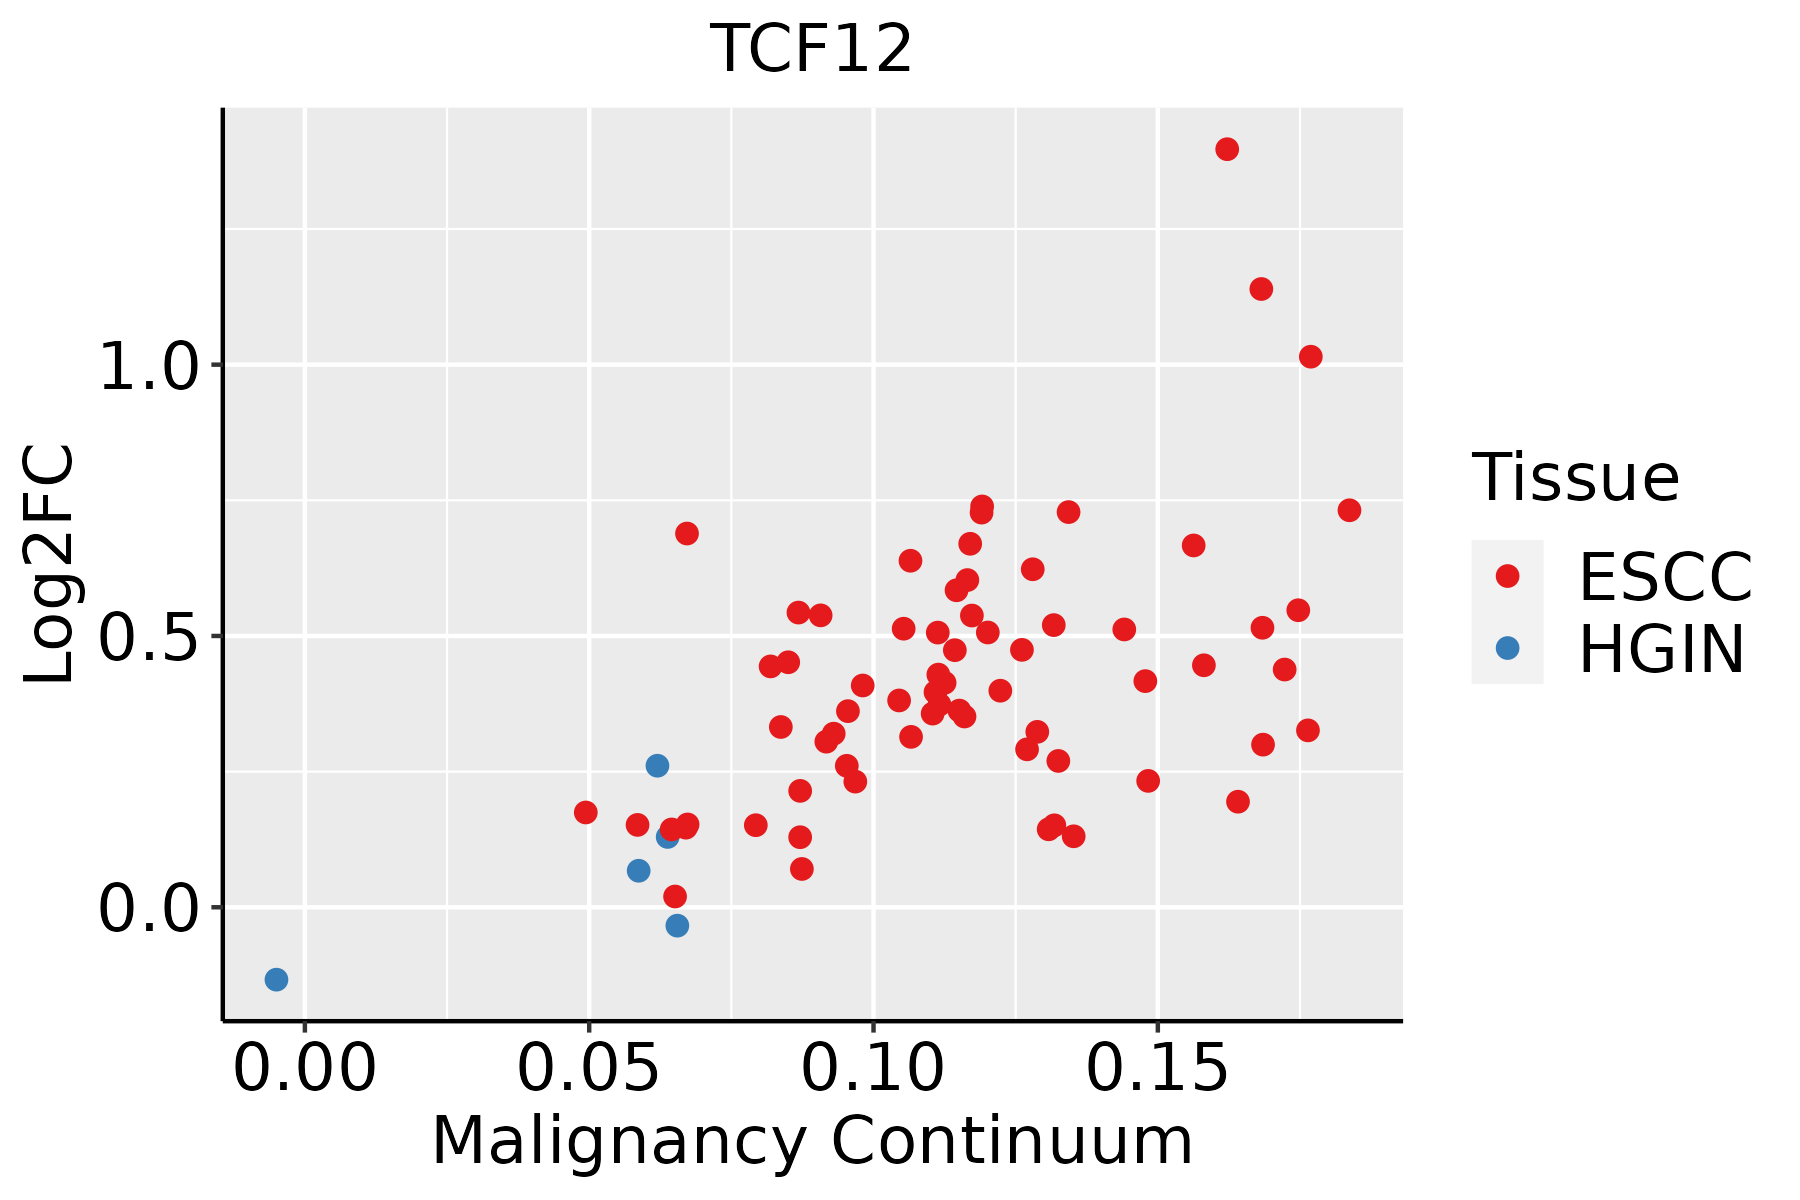 | ESCC: Esophageal squamous cell carcinoma |
| HGIN: High-grade intraepithelial neoplasias | ||
| LGIN: Low-grade intraepithelial neoplasias | ||
| Liver | 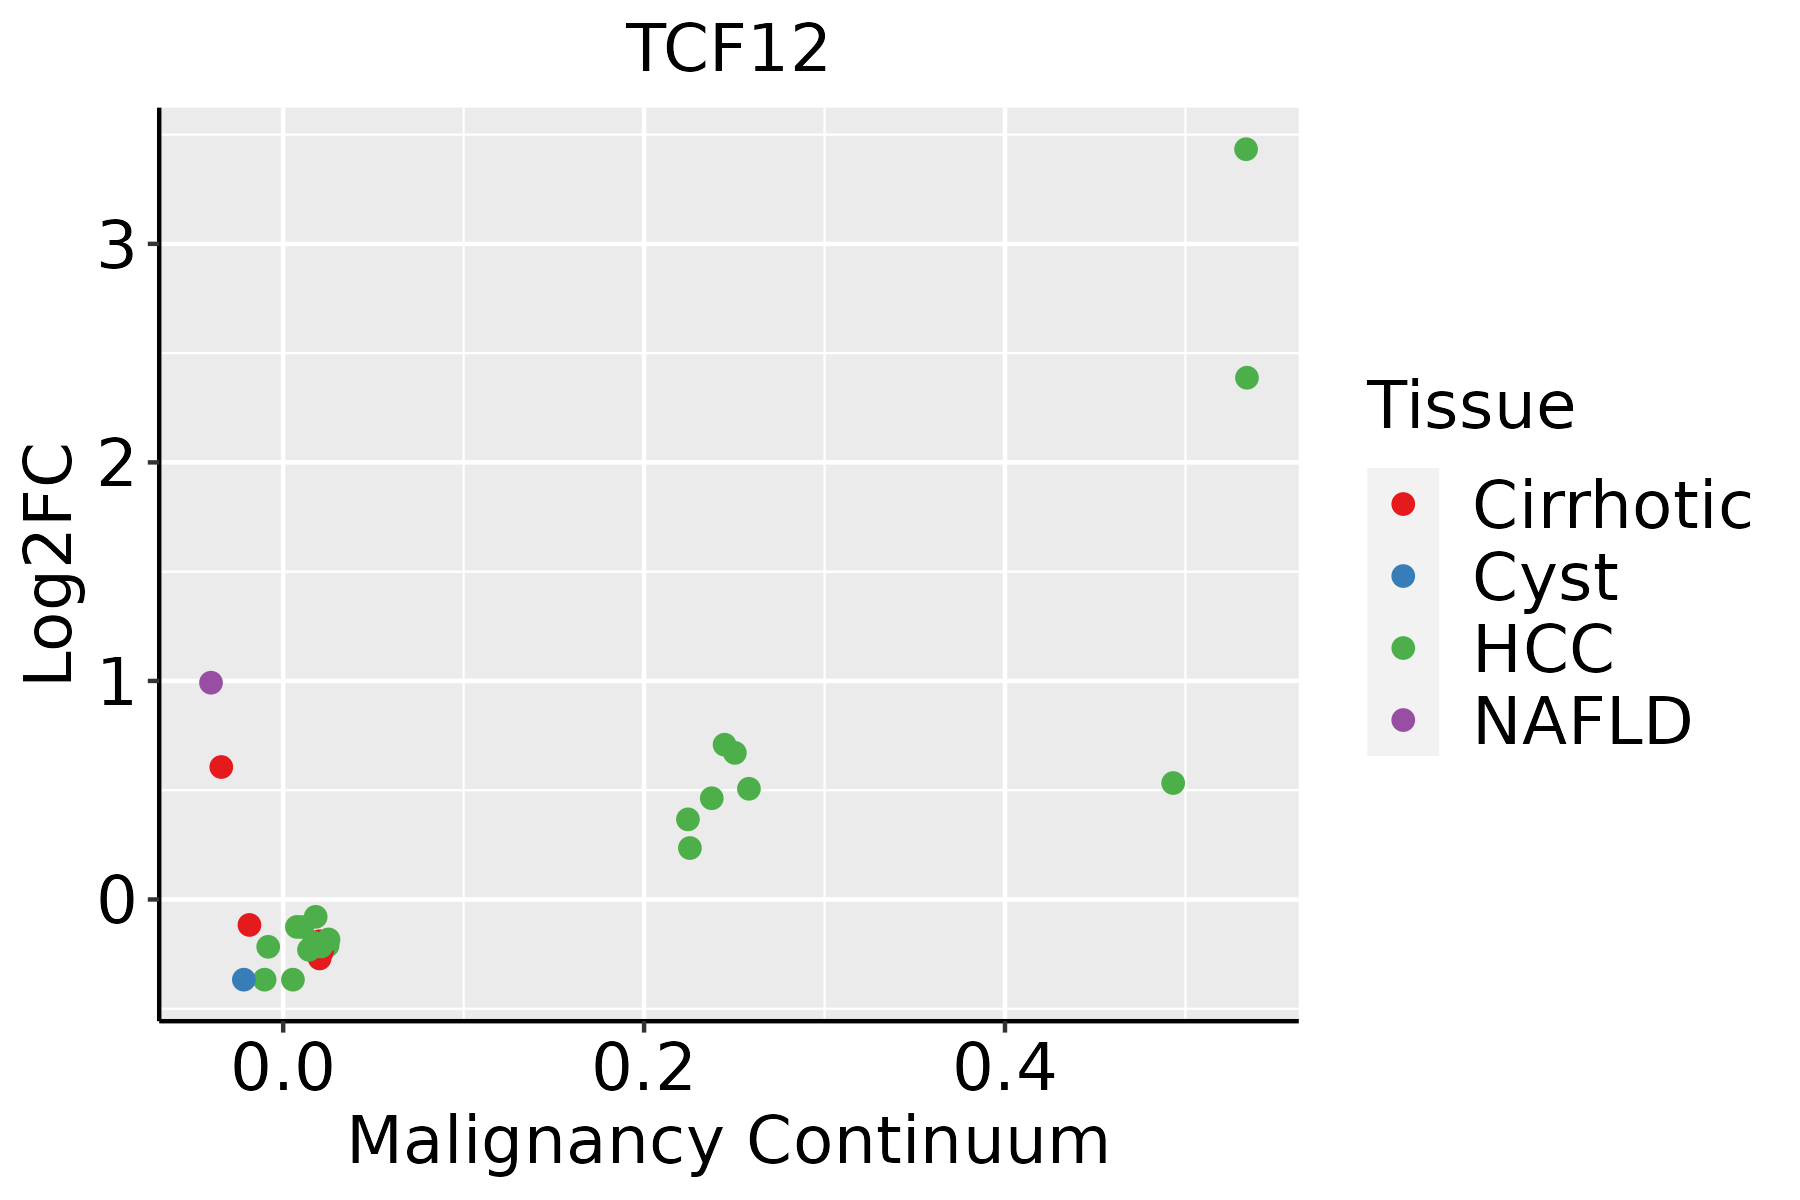 | HCC: Hepatocellular carcinoma |
| NAFLD: Non-alcoholic fatty liver disease | ||
| Lung | 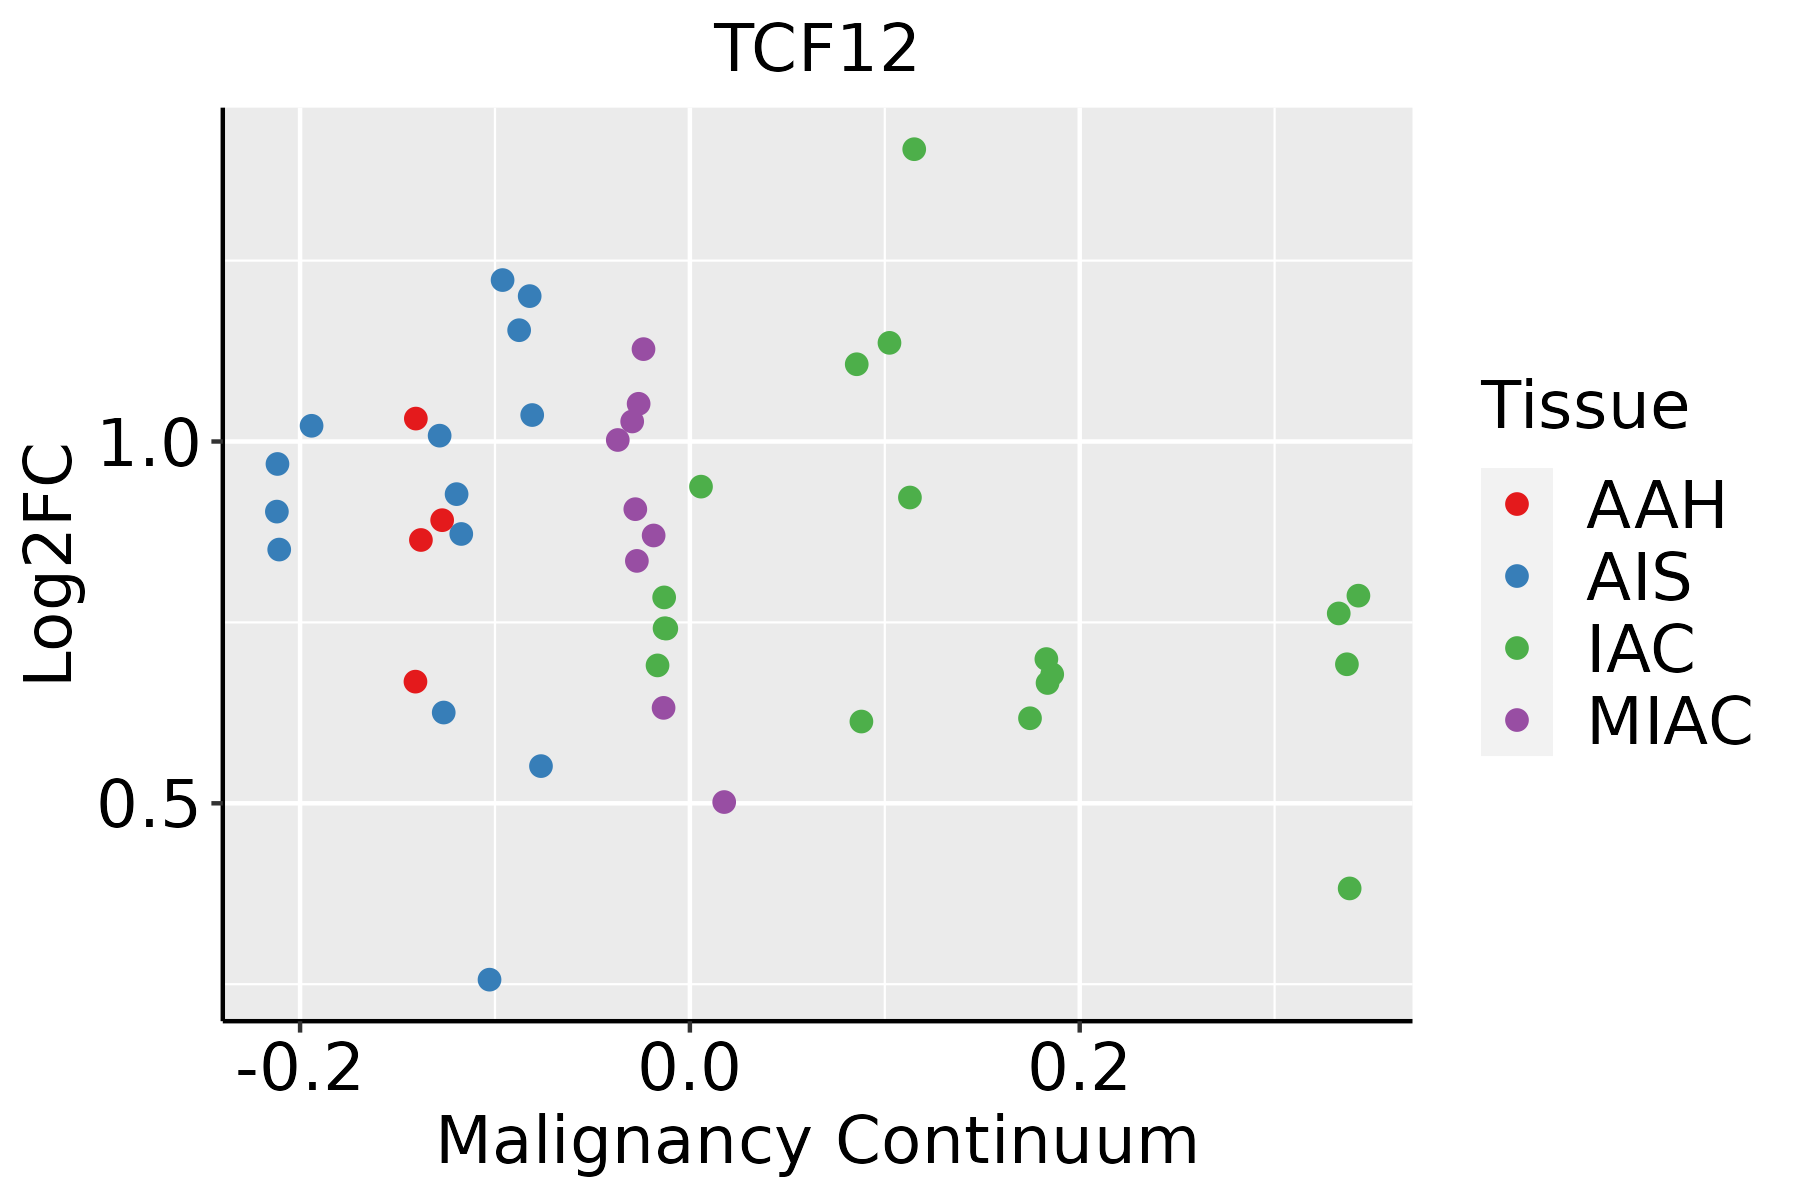 | AAH: Atypical adenomatous hyperplasia |
| AIS: Adenocarcinoma in situ | ||
| IAC: Invasive lung adenocarcinoma | ||
| MIA: Minimally invasive adenocarcinoma | ||
| Oral Cavity | 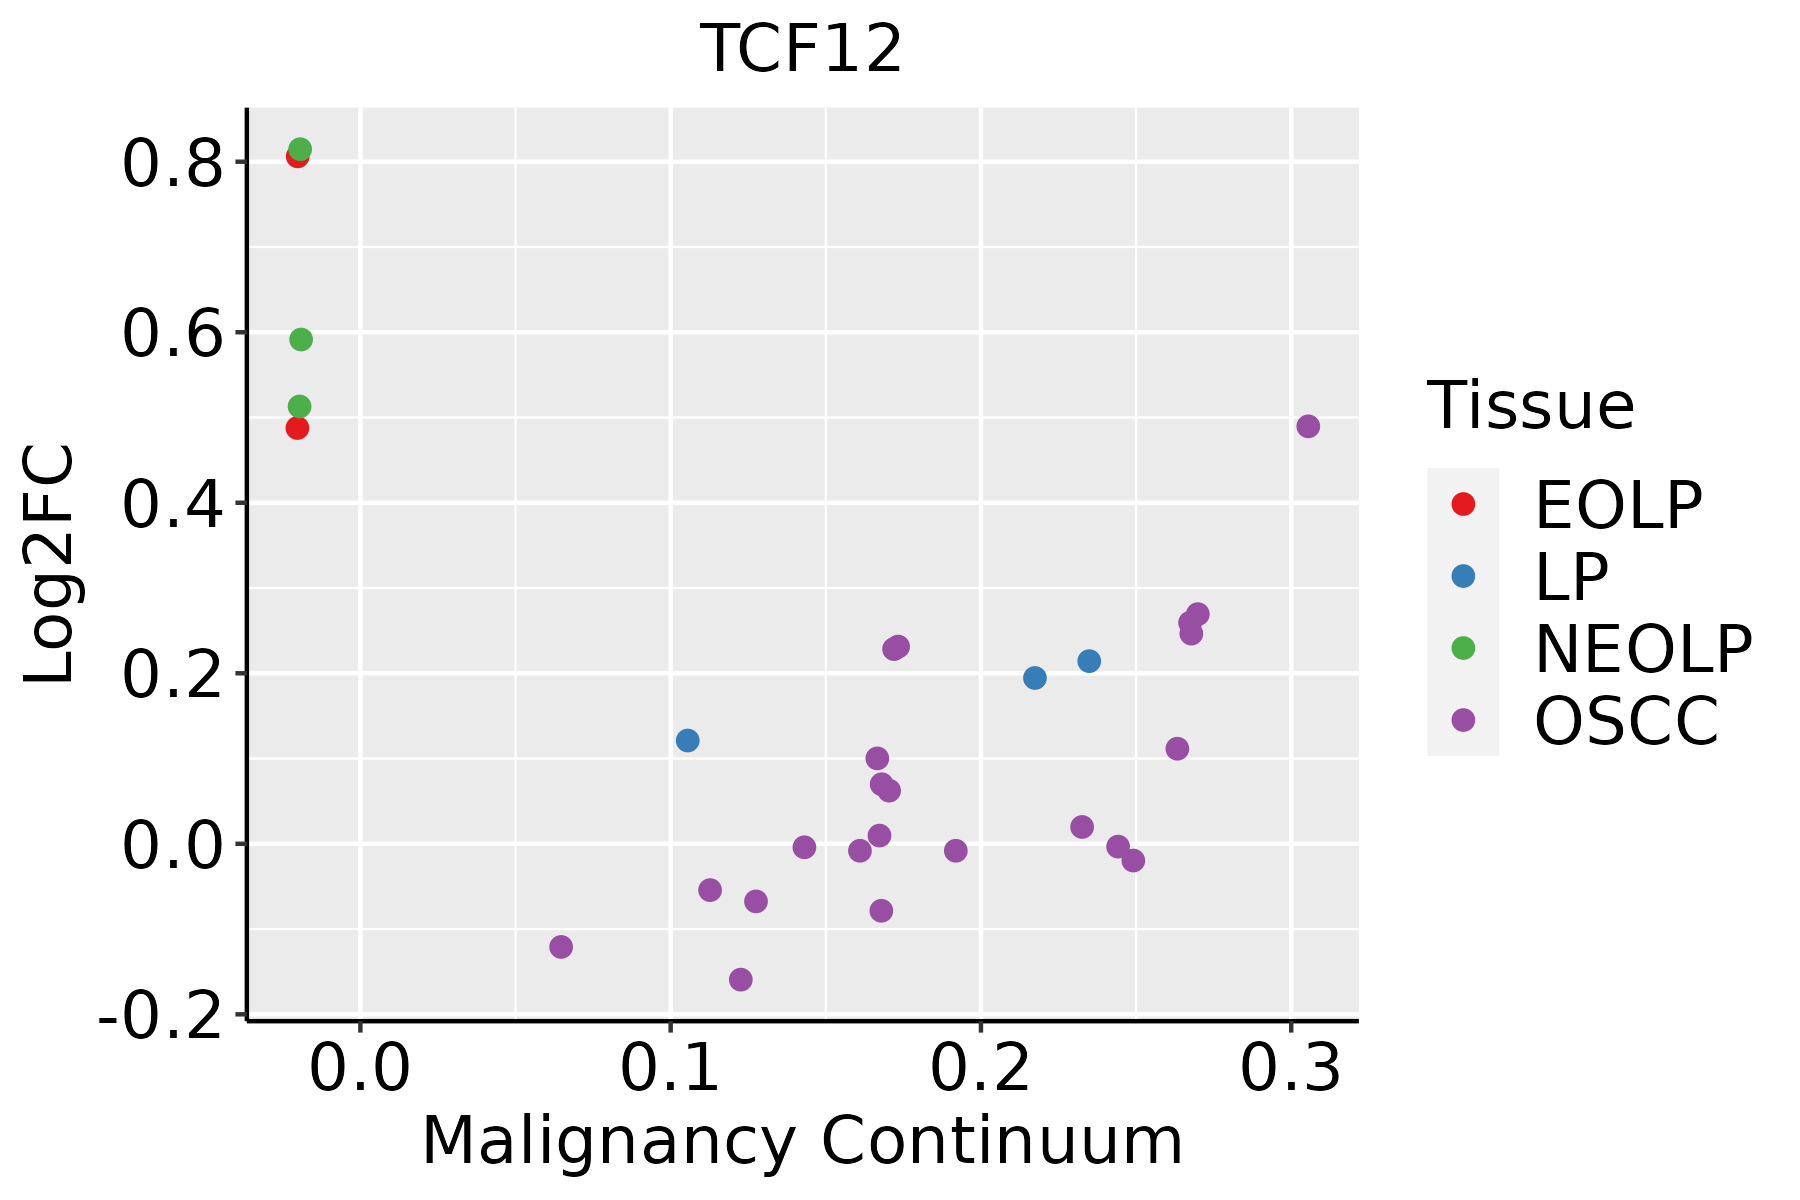 | EOLP: Erosive Oral lichen planus |
| LP: leukoplakia | ||
| NEOLP: Non-erosive oral lichen planus | ||
| OSCC: Oral squamous cell carcinoma | ||
| Prostate |  | BPH: Benign Prostatic Hyperplasia |
| Skin | 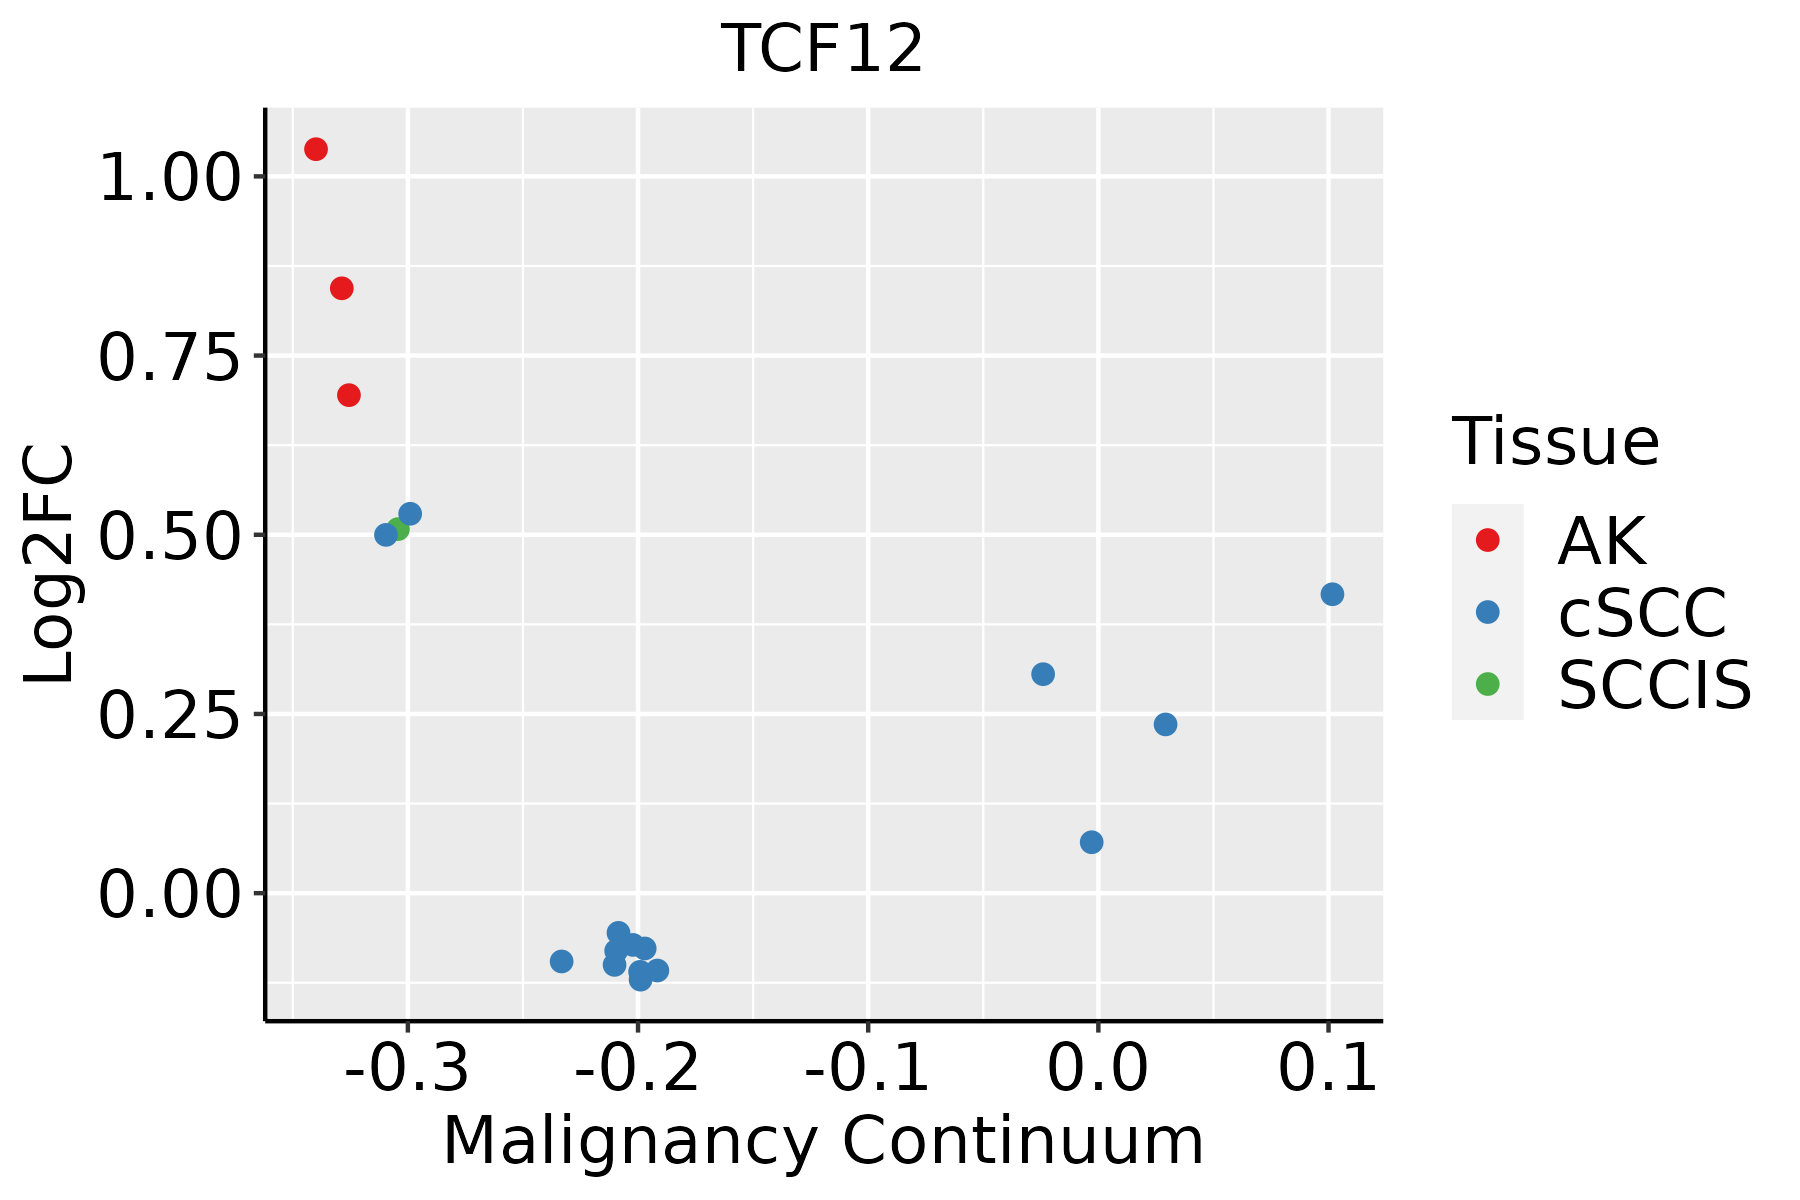 | AK: Actinic keratosis |
| cSCC: Cutaneous squamous cell carcinoma | ||
| SCCIS:squamous cell carcinoma in situ | ||
| Thyroid |  | ATC: Anaplastic thyroid cancer |
| HT: Hashimoto's thyroiditis | ||
| PTC: Papillary thyroid cancer |
| ∗log2FC in expression of this searched gene in stem-like cells from each diseased tissue sample relative to stem-like cells in normal samples in each tissue plotted against the malignancy continuum. Samples are colored based on if they are from different disease stage. |
Top |
Malignant transformation related pathway analysis |
| Find out the enriched GO biological processes and KEGG pathways involved in transition from healthy to precancer to cancer |
| Tissue | Disease Stage | Enriched GO biological Processes |
| Colorectum | AD |  |
| Colorectum | SER |  |
| Colorectum | MSS |  |
| Colorectum | MSI-H |  |
| Colorectum | FAP |  |
| ∗Top 15 enriched GO BP terms are showed in the bar plot of each disease state in each tissue. Each row represents a significant GO biological process which is colored according to the -log10(p.adjust). |
| Page: 1 2 3 4 5 6 7 8 9 |
| GO ID | Tissue | Disease Stage | Description | Gene Ratio | Bg Ratio | pvalue | p.adjust | Count |
| GO:00075173 | Cervix | CC | muscle organ development | 58/2311 | 327/18723 | 2.73e-03 | 1.85e-02 | 58 |
| GO:00075174 | Endometrium | AEH | muscle organ development | 60/2100 | 327/18723 | 8.19e-05 | 1.22e-03 | 60 |
| GO:000751712 | Endometrium | EEC | muscle organ development | 59/2168 | 327/18723 | 3.49e-04 | 3.85e-03 | 59 |
| GO:0007517 | Lung | AAH | muscle organ development | 22/613 | 327/18723 | 1.20e-03 | 3.33e-02 | 22 |
| GO:00075176 | Oral cavity | EOLP | muscle organ development | 57/2218 | 327/18723 | 1.76e-03 | 1.15e-02 | 57 |
| GO:000751714 | Oral cavity | NEOLP | muscle organ development | 56/2005 | 327/18723 | 2.65e-04 | 2.70e-03 | 56 |
| GO:0045664 | Prostate | BPH | regulation of neuron differentiation | 46/3107 | 196/18723 | 7.95e-03 | 3.47e-02 | 46 |
| GO:00075175 | Prostate | BPH | muscle organ development | 71/3107 | 327/18723 | 9.00e-03 | 3.84e-02 | 71 |
| GO:00456641 | Prostate | Tumor | regulation of neuron differentiation | 52/3246 | 196/18723 | 7.90e-04 | 5.38e-03 | 52 |
| GO:000751713 | Prostate | Tumor | muscle organ development | 74/3246 | 327/18723 | 8.03e-03 | 3.54e-02 | 74 |
| GO:00075177 | Skin | AK | muscle organ development | 50/1910 | 327/18723 | 2.38e-03 | 1.56e-02 | 50 |
| GO:000751715 | Skin | SCCIS | muscle organ development | 28/919 | 327/18723 | 3.12e-03 | 2.83e-02 | 28 |
| GO:000751716 | Thyroid | ATC | muscle organ development | 139/6293 | 327/18723 | 4.45e-04 | 2.64e-03 | 139 |
| Page: 1 |
| Pathway ID | Tissue | Disease Stage | Description | Gene Ratio | Bg Ratio | pvalue | p.adjust | qvalue | Count |
| Page: 1 |
Top |
Cell-cell communication analysis |
| Identification of potential cell-cell interactions between two cell types and their ligand-receptor pairs for different disease states |
| Ligand | Receptor | LRpair | Pathway | Tissue | Disease Stage |
| Page: 1 |
Top |
Single-cell gene regulatory network inference analysis |
| Find out the significant the regulons (TFs) and the target genes of each regulon across cell types for different disease states |
| TF | Cell Type | Tissue | Disease Stage | Target Gene | RSS | Regulon Activity |
| TCF12 | STM | Colorectum | MSS | FOXP1,TMTC2,MECOM, etc. | 2.64e-01 |  |
| TCF12 | MSC.SEC | Liver | Cirrhotic | MACF1,PTK2,STK3, etc. | 3.12e-01 |  |
| TCF12 | MSC.SEC | Liver | HCC | MACF1,PTK2,STK3, etc. | 1.45e-01 |  |
| TCF12 | MSC.SEC | Liver | Healthy | MACF1,PTK2,STK3, etc. | 6.19e-01 |  |
| TCF12 | M2MAC | Lung | AAH | FN1,VCAN,NCOA5, etc. | 1.34e-02 |  |
| TCF12 | PVA | Oral cavity | ADJ | LDB2,ADGRL2,LRMDA, etc. | 1.29e-01 |  |
| TCF12 | PVA | Oral cavity | LP | LDB2,ADGRL2,LRMDA, etc. | 1.29e-01 |  |
| TCF12 | PVA | Oral cavity | OSCC | LDB2,ADGRL2,LRMDA, etc. | 9.33e-02 |  |
| TCF12 | M2MAC | Prostate | BPH | FOXN3,DOCK2,C20orf194, etc. | 2.42e-01 |  |
| TCF12 | TH17 | Stomach | Healthy | RNF111,B3GNT5,WDR70, etc. | 8.56e-03 |  |
| ∗The dot plots of a searched regulon are shown for all cell subpopulations in each disease state of each tissue based on the regulon specific score inferred using pySCENIC and by calculating the average expression. |
| Page: 1 |
Top |
Somatic mutation of malignant transformation related genes |
| Annotation of somatic variants for genes involved in malignant transformation |
| Hugo Symbol | Variant Class | Variant Classification | dbSNP RS | HGVSc | HGVSp | HGVSp Short | SWISSPROT | BIOTYPE | SIFT | PolyPhen | Tumor Sample Barcode | Tissue | Histology | Sex | Age | Stage | Therapy Types | Drugs | Outcome |
| TCF12 | SNV | Missense_Mutation | c.1507N>C | p.Asn503His | p.N503H | Q99081 | protein_coding | tolerated(0.15) | benign(0.176) | TCGA-A2-A04N-01 | Breast | breast invasive carcinoma | Female | >=65 | I/II | Chemotherapy | cytoxan | SD | |
| TCF12 | SNV | Missense_Mutation | c.1325C>A | p.Ala442Asp | p.A442D | Q99081 | protein_coding | deleterious(0) | probably_damaging(0.997) | TCGA-A2-A0T0-01 | Breast | breast invasive carcinoma | Female | <65 | I/II | Chemotherapy | taxotere | SD | |
| TCF12 | SNV | Missense_Mutation | c.2110G>T | p.Gly704Cys | p.G704C | Q99081 | protein_coding | deleterious(0) | probably_damaging(0.958) | TCGA-A8-A09Z-01 | Breast | breast invasive carcinoma | Female | >=65 | I/II | Unknown | Unknown | SD | |
| TCF12 | SNV | Missense_Mutation | c.1693G>C | p.Asp565His | p.D565H | Q99081 | protein_coding | deleterious(0.03) | probably_damaging(0.996) | TCGA-AC-A23H-01 | Breast | breast invasive carcinoma | Female | >=65 | I/II | Unknown | Unknown | PD | |
| TCF12 | SNV | Missense_Mutation | c.818N>G | p.Asp273Gly | p.D273G | Q99081 | protein_coding | tolerated(0.06) | possibly_damaging(0.501) | TCGA-D8-A1XK-01 | Breast | breast invasive carcinoma | Female | <65 | I/II | Chemotherapy | doxorubicine+cyclophosphamide | SD | |
| TCF12 | deletion | Frame_Shift_Del | c.142delN | p.Gly48AspfsTer39 | p.G48Dfs*39 | Q99081 | protein_coding | TCGA-A7-A26E-01 | Breast | breast invasive carcinoma | Female | >=65 | III/IV | Chemotherapy | cytoxan | SD | |||
| TCF12 | insertion | Frame_Shift_Ins | novel | c.808_809insT | p.His270LeufsTer4 | p.H270Lfs*4 | Q99081 | protein_coding | TCGA-AO-A0JF-01 | Breast | breast invasive carcinoma | Female | >=65 | I/II | Chemotherapy | doxorubicin | SD | ||
| TCF12 | insertion | Nonsense_Mutation | novel | c.809_810insAGTTTGACATTATTTATGTGGATTTAGGCAGTATTCTT | p.His270GlnfsTer3 | p.H270Qfs*3 | Q99081 | protein_coding | TCGA-AO-A0JF-01 | Breast | breast invasive carcinoma | Female | >=65 | I/II | Chemotherapy | doxorubicin | SD | ||
| TCF12 | SNV | Missense_Mutation | novel | c.1438N>T | p.Leu480Phe | p.L480F | Q99081 | protein_coding | tolerated(0.06) | probably_damaging(0.996) | TCGA-2W-A8YY-01 | Cervix | cervical & endocervical cancer | Female | <65 | I/II | Chemotherapy | cisplatin | CR |
| TCF12 | SNV | Missense_Mutation | rs765920481 | c.1196G>A | p.Arg399Gln | p.R399Q | Q99081 | protein_coding | deleterious(0.04) | probably_damaging(0.986) | TCGA-IR-A3LH-01 | Cervix | cervical & endocervical cancer | Female | <65 | I/II | Chemotherapy | cisplatin | CR |
| Page: 1 2 3 4 5 6 7 8 9 |
Top |
Related drugs of malignant transformation related genes |
| Identification of chemicals and drugs interact with genes involved in malignant transfromation |
| (DGIdb 4.0) |
| Entrez ID | Symbol | Category | Interaction Types | Drug Claim Name | Drug Name | PMIDs |
| Page: 1 |

Copyright 2023-Present -The University of Texas Health Science Center at Houston |