
|
|||||
|
 | |
| |
| |
| |
| |
| |
|
Gene: TCERG1 |
Gene summary for TCERG1 |
| Gene information | Species | Human | Gene symbol | TCERG1 | Gene ID | 10915 |
| Gene name | transcription elongation regulator 1 | |
| Gene Alias | CA150 | |
| Cytomap | 5q32 | |
| Gene Type | protein-coding | GO ID | GO:0000122 | UniProtAcc | O14776 |
Top |
Malignant transformation analysis |
| Identification of the aberrant gene expression in precancerous and cancerous lesions by comparing the gene expression of stem-like cells in diseased tissues with normal stem cells |
| Entrez ID | Symbol | Replicates | Species | Organ | Tissue | Adj P-value | Log2FC | Malignancy |
| 10915 | TCERG1 | CCI_2 | Human | Cervix | CC | 2.23e-07 | 9.12e-01 | 0.5249 |
| 10915 | TCERG1 | CCI_3 | Human | Cervix | CC | 2.76e-08 | 7.22e-01 | 0.516 |
| 10915 | TCERG1 | HTA11_3410_2000001011 | Human | Colorectum | AD | 8.97e-17 | -5.68e-01 | 0.0155 |
| 10915 | TCERG1 | HTA11_2487_2000001011 | Human | Colorectum | SER | 2.07e-08 | -5.60e-01 | -0.1808 |
| 10915 | TCERG1 | HTA11_2951_2000001011 | Human | Colorectum | AD | 1.87e-04 | -8.39e-01 | 0.0216 |
| 10915 | TCERG1 | HTA11_3361_2000001011 | Human | Colorectum | AD | 9.78e-06 | -5.91e-01 | -0.1207 |
| 10915 | TCERG1 | HTA11_696_2000001011 | Human | Colorectum | AD | 8.50e-15 | -4.78e-01 | -0.1464 |
| 10915 | TCERG1 | HTA11_866_2000001011 | Human | Colorectum | AD | 1.89e-10 | -4.59e-01 | -0.1001 |
| 10915 | TCERG1 | HTA11_2992_2000001011 | Human | Colorectum | SER | 1.25e-02 | -5.48e-01 | -0.1706 |
| 10915 | TCERG1 | HTA11_5212_2000001011 | Human | Colorectum | AD | 4.07e-05 | -7.33e-01 | -0.2061 |
| 10915 | TCERG1 | HTA11_866_3004761011 | Human | Colorectum | AD | 3.84e-12 | -5.55e-01 | 0.096 |
| 10915 | TCERG1 | HTA11_4255_2000001011 | Human | Colorectum | SER | 5.65e-03 | -4.32e-01 | 0.0446 |
| 10915 | TCERG1 | HTA11_9408_2000001011 | Human | Colorectum | AD | 8.91e-05 | -9.29e-01 | 0.0451 |
| 10915 | TCERG1 | HTA11_8622_2000001021 | Human | Colorectum | SER | 2.13e-02 | -6.24e-01 | 0.0528 |
| 10915 | TCERG1 | HTA11_10711_2000001011 | Human | Colorectum | AD | 8.87e-05 | -4.94e-01 | 0.0338 |
| 10915 | TCERG1 | HTA11_7696_3000711011 | Human | Colorectum | AD | 4.33e-07 | -3.24e-01 | 0.0674 |
| 10915 | TCERG1 | HTA11_11156_2000001011 | Human | Colorectum | AD | 1.15e-02 | -8.74e-01 | 0.0397 |
| 10915 | TCERG1 | HTA11_6818_2000001021 | Human | Colorectum | AD | 3.25e-02 | -4.13e-01 | 0.0588 |
| 10915 | TCERG1 | HTA11_99999974143_84620 | Human | Colorectum | MSS | 2.18e-21 | -5.64e-01 | 0.3005 |
| 10915 | TCERG1 | F007 | Human | Colorectum | FAP | 2.40e-04 | -2.95e-01 | 0.1176 |
| Page: 1 2 3 4 5 6 7 8 9 |
| Tissue | Expression Dynamics | Abbreviation |
| Cervix | 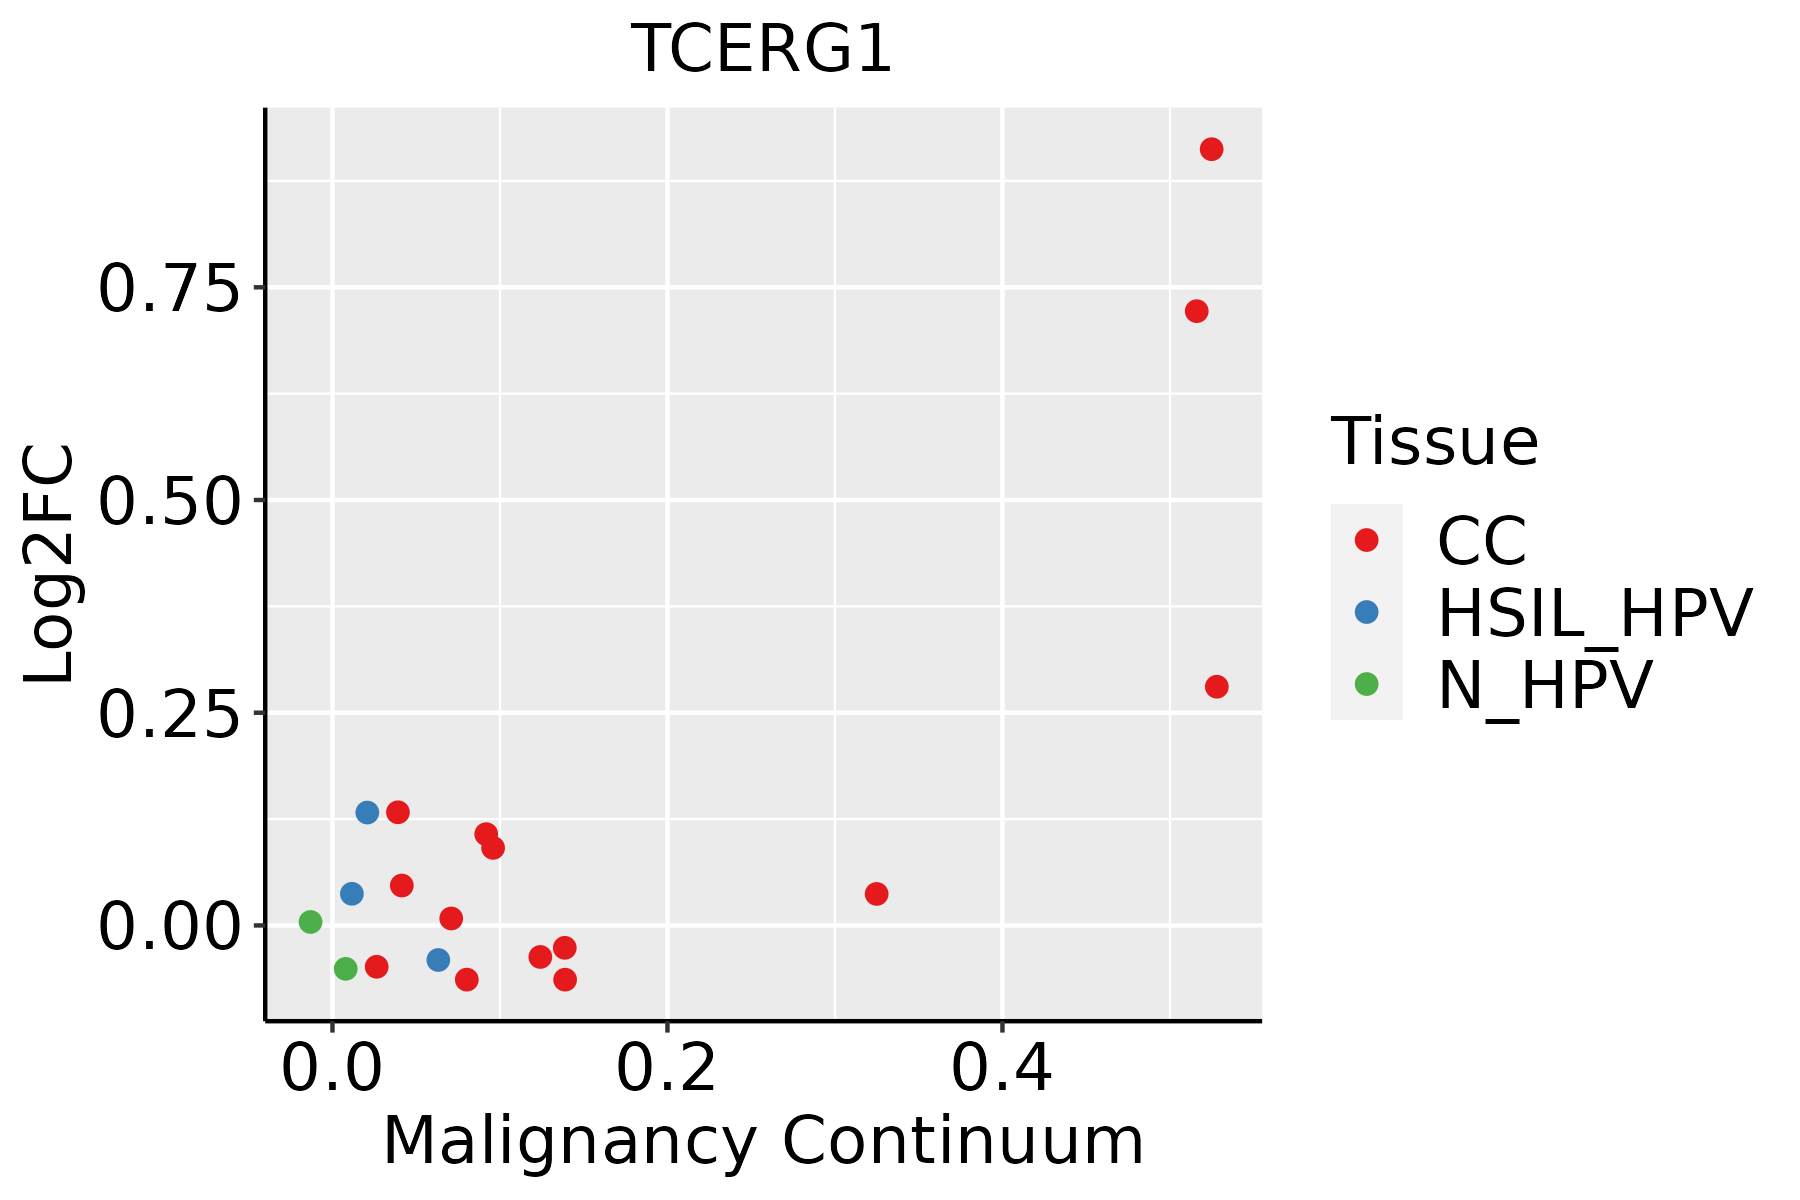 | CC: Cervix cancer |
| HSIL_HPV: HPV-infected high-grade squamous intraepithelial lesions | ||
| N_HPV: HPV-infected normal cervix | ||
| Colorectum (GSE201348) |  | FAP: Familial adenomatous polyposis |
| CRC: Colorectal cancer | ||
| Colorectum (HTA11) |  | AD: Adenomas |
| SER: Sessile serrated lesions | ||
| MSI-H: Microsatellite-high colorectal cancer | ||
| MSS: Microsatellite stable colorectal cancer | ||
| Esophagus | 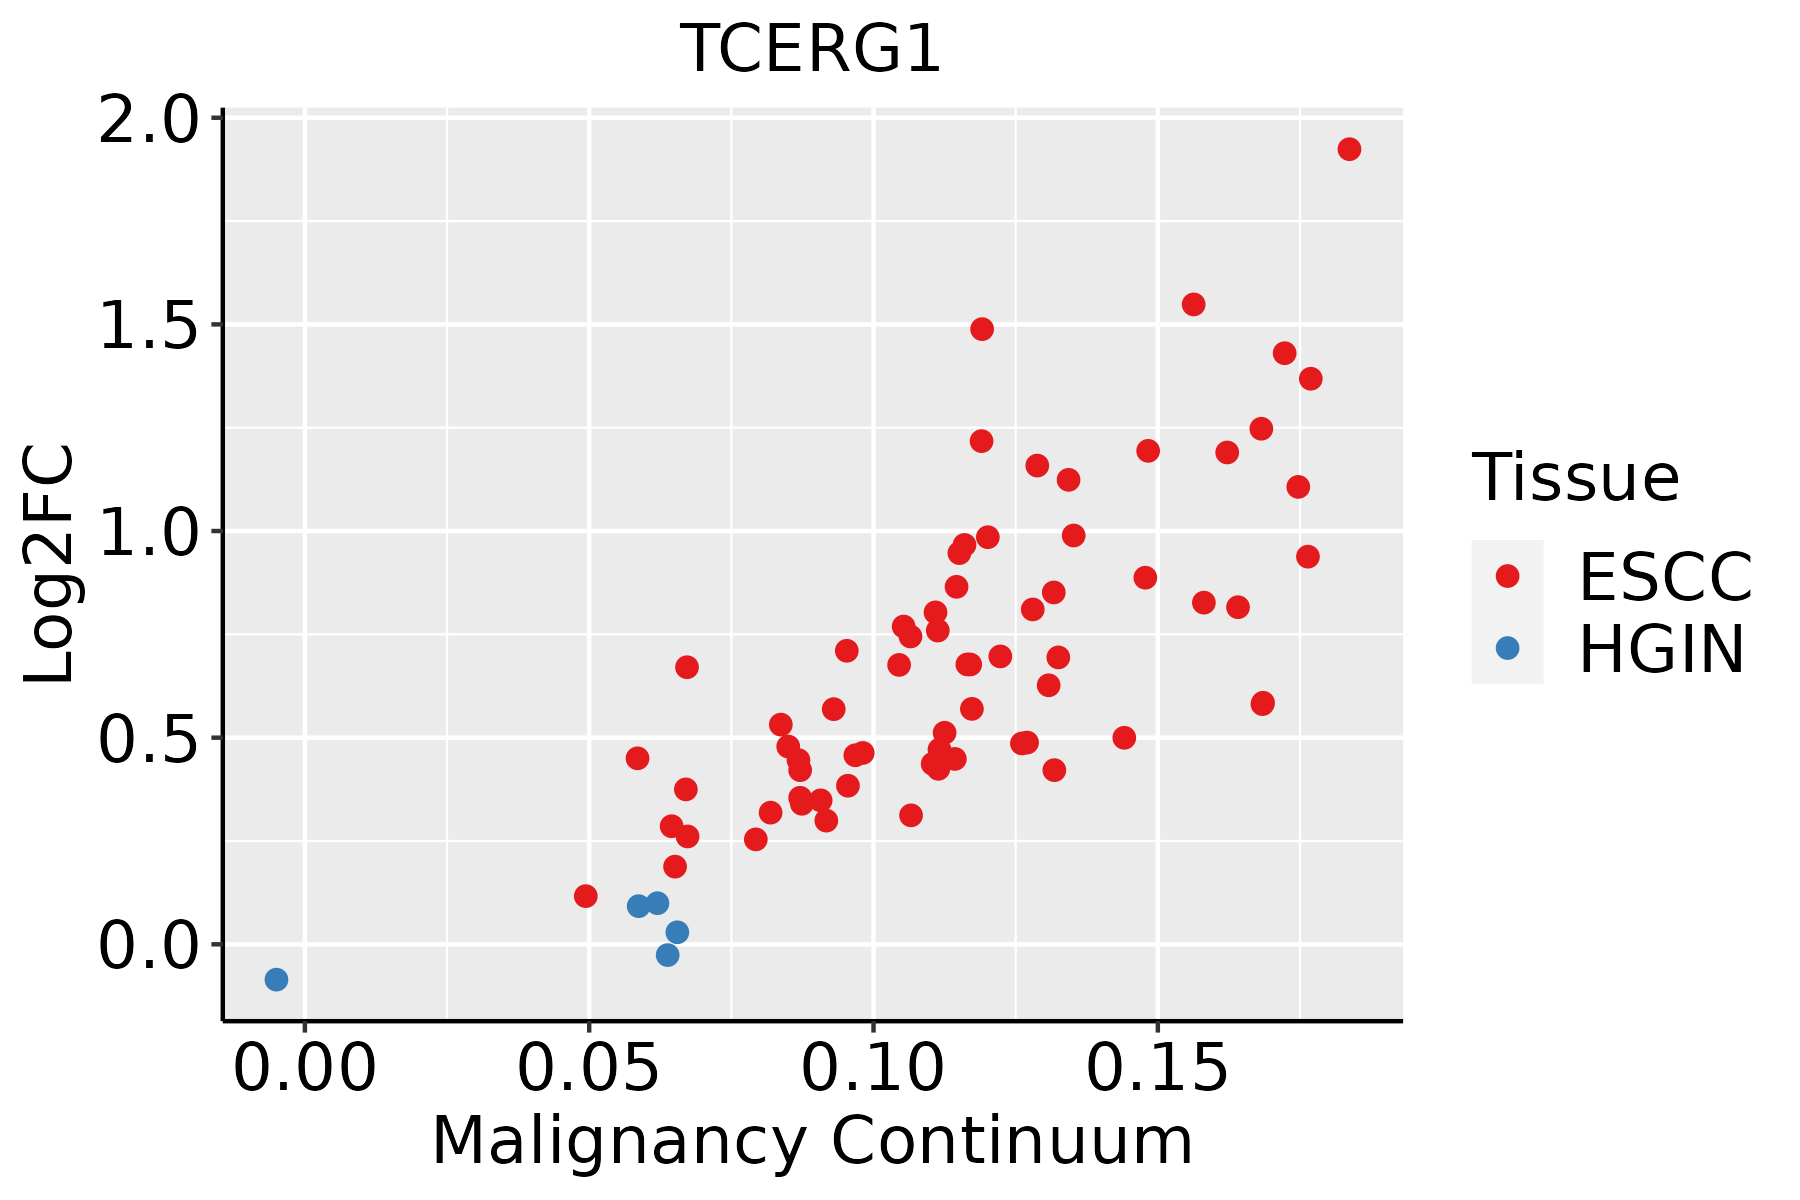 | ESCC: Esophageal squamous cell carcinoma |
| HGIN: High-grade intraepithelial neoplasias | ||
| LGIN: Low-grade intraepithelial neoplasias | ||
| Liver | 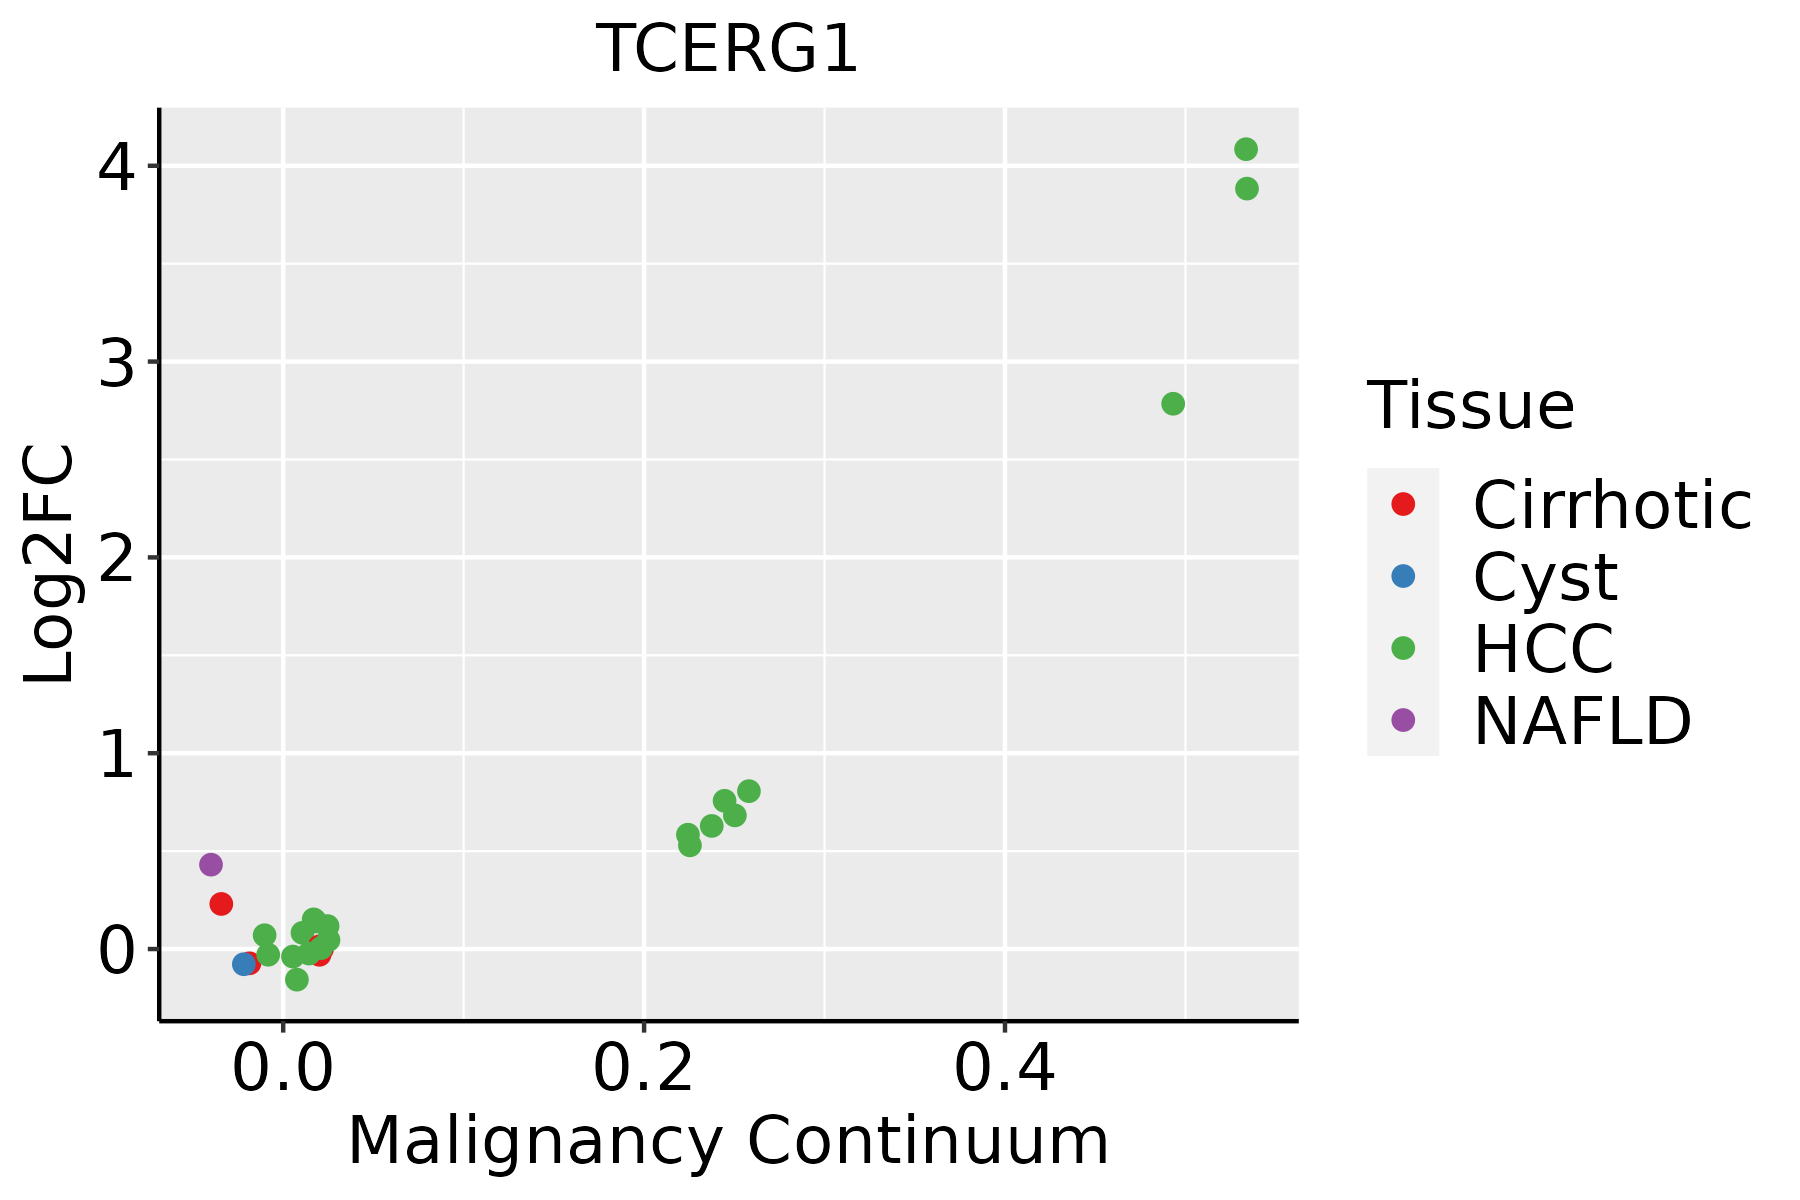 | HCC: Hepatocellular carcinoma |
| NAFLD: Non-alcoholic fatty liver disease | ||
| Oral Cavity |  | EOLP: Erosive Oral lichen planus |
| LP: leukoplakia | ||
| NEOLP: Non-erosive oral lichen planus | ||
| OSCC: Oral squamous cell carcinoma | ||
| Skin | 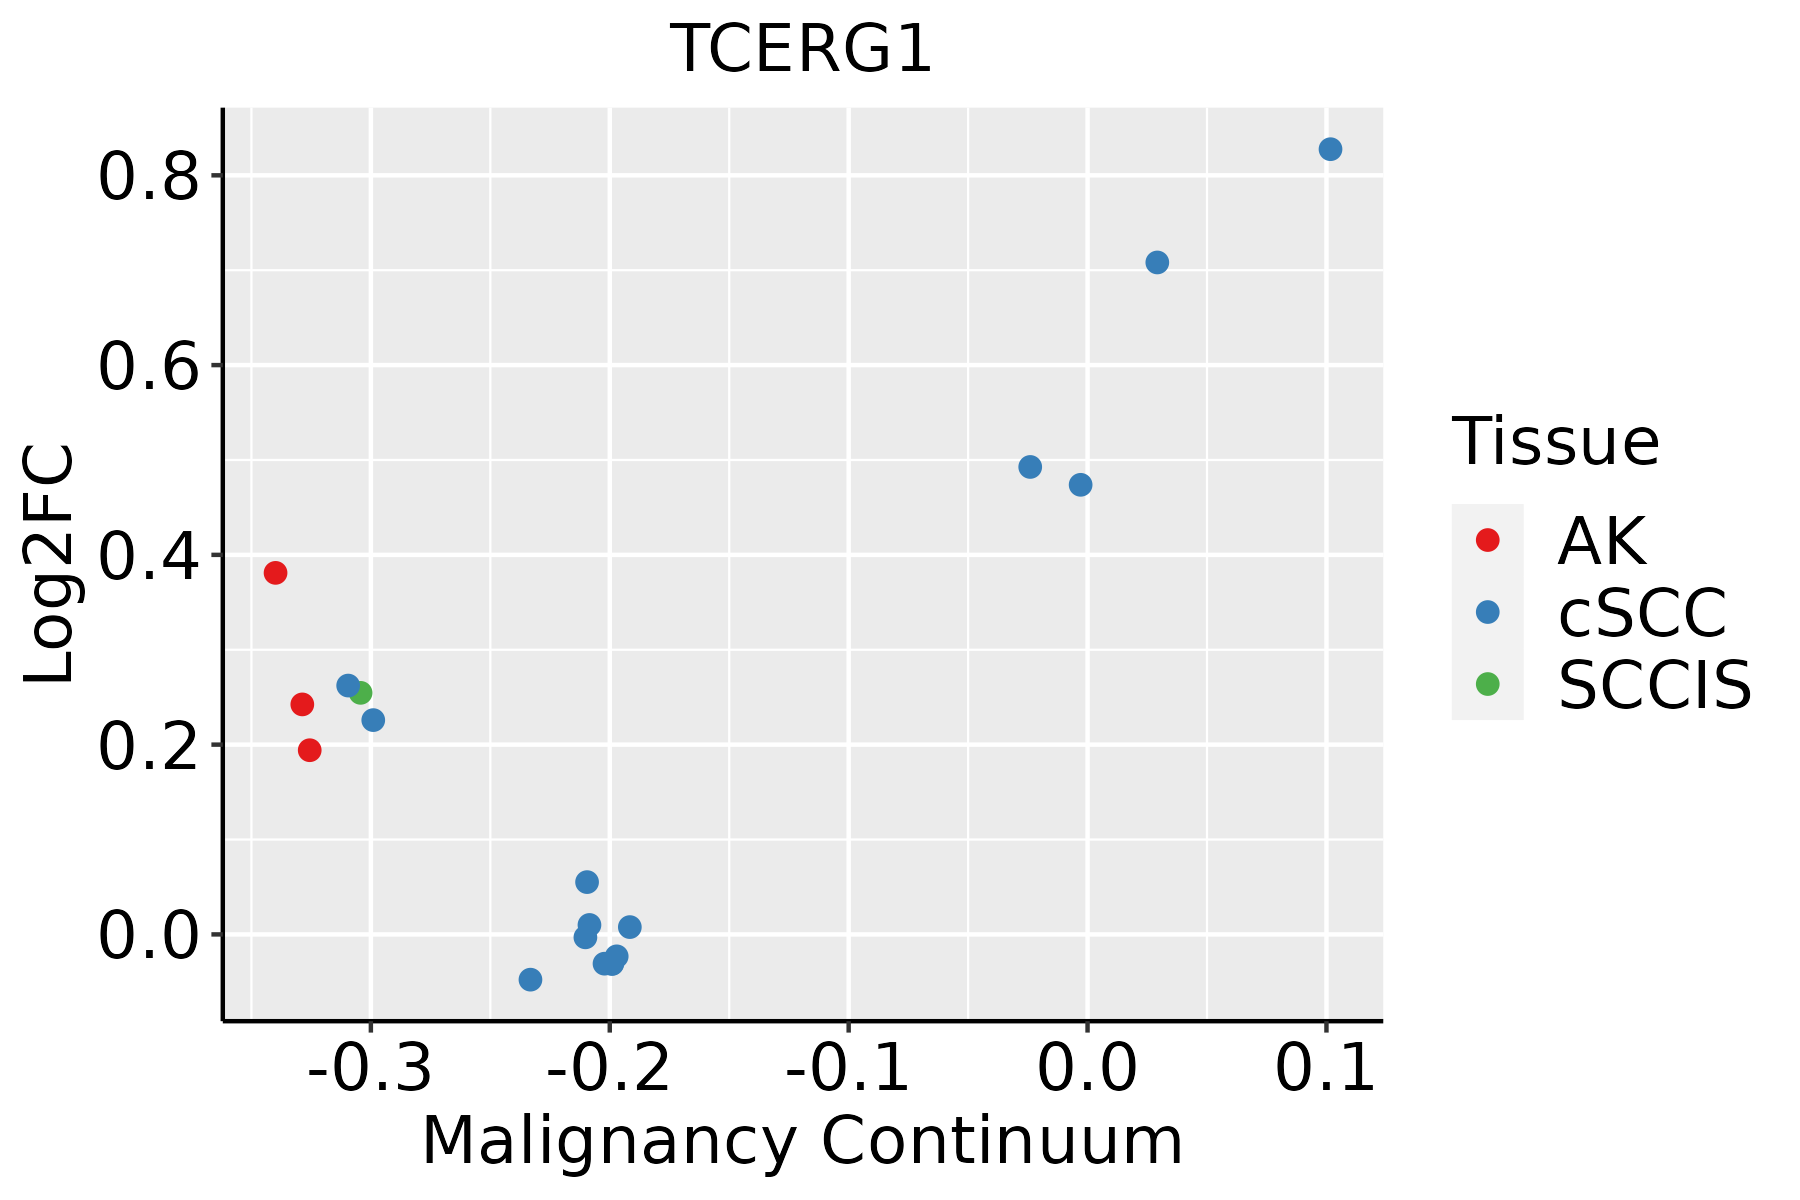 | AK: Actinic keratosis |
| cSCC: Cutaneous squamous cell carcinoma | ||
| SCCIS:squamous cell carcinoma in situ | ||
| Thyroid | 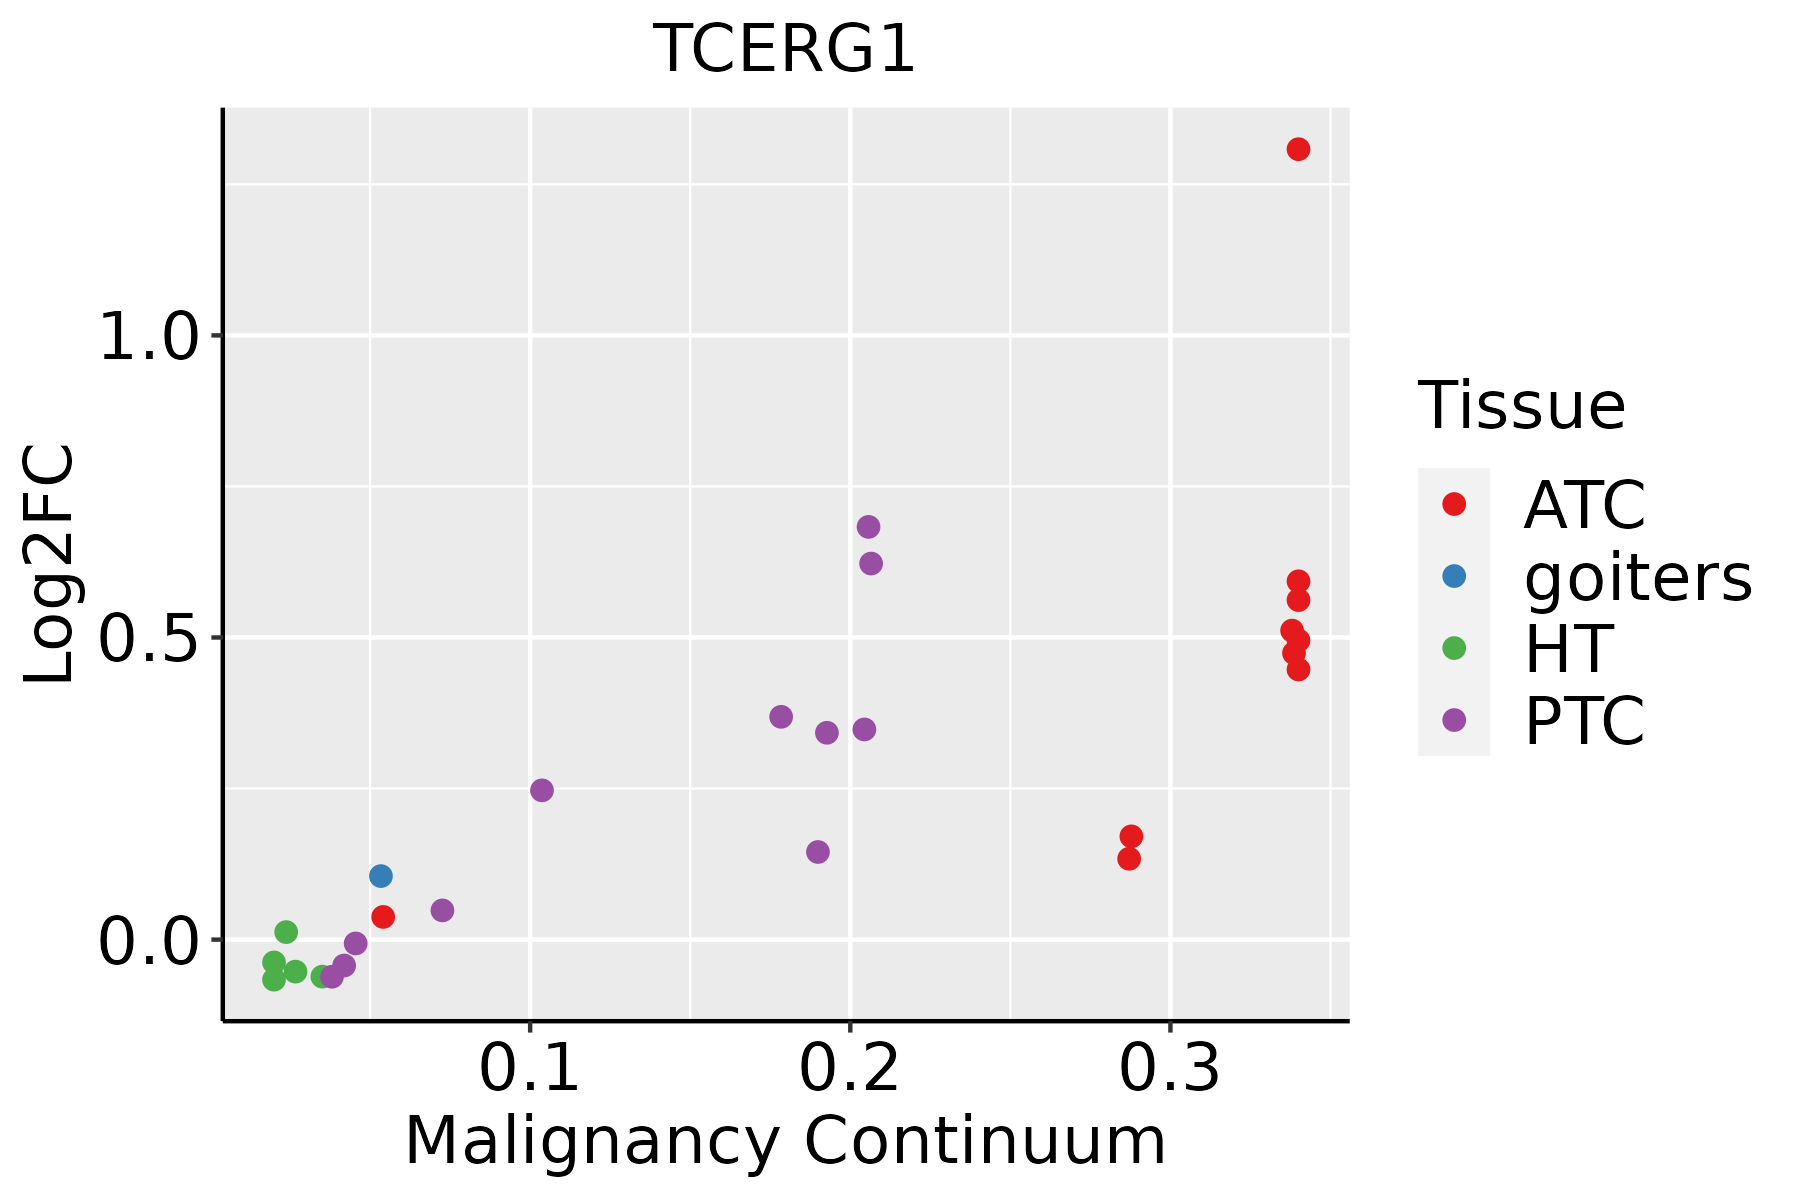 | ATC: Anaplastic thyroid cancer |
| HT: Hashimoto's thyroiditis | ||
| PTC: Papillary thyroid cancer |
| ∗log2FC in expression of this searched gene in stem-like cells from each diseased tissue sample relative to stem-like cells in normal samples in each tissue plotted against the malignancy continuum. Samples are colored based on if they are from different disease stage. |
Top |
Malignant transformation related pathway analysis |
| Find out the enriched GO biological processes and KEGG pathways involved in transition from healthy to precancer to cancer |
| Tissue | Disease Stage | Enriched GO biological Processes |
| Colorectum | AD |  |
| Colorectum | SER |  |
| Colorectum | MSS |  |
| Colorectum | MSI-H |  |
| Colorectum | FAP |  |
| ∗Top 15 enriched GO BP terms are showed in the bar plot of each disease state in each tissue. Each row represents a significant GO biological process which is colored according to the -log10(p.adjust). |
| Page: 1 2 3 4 5 6 7 8 9 |
| GO ID | Tissue | Disease Stage | Description | Gene Ratio | Bg Ratio | pvalue | p.adjust | Count |
| GO:000838010 | Cervix | CC | RNA splicing | 76/2311 | 434/18723 | 9.79e-04 | 8.19e-03 | 76 |
| GO:00063684 | Cervix | CC | transcription elongation from RNA polymerase II promoter | 17/2311 | 69/18723 | 3.65e-03 | 2.33e-02 | 17 |
| GO:00063545 | Cervix | CC | DNA-templated transcription, elongation | 20/2311 | 91/18723 | 6.88e-03 | 3.74e-02 | 20 |
| GO:0008380 | Colorectum | AD | RNA splicing | 169/3918 | 434/18723 | 3.59e-18 | 2.04e-15 | 169 |
| GO:0032786 | Colorectum | AD | positive regulation of DNA-templated transcription, elongation | 13/3918 | 27/18723 | 1.47e-03 | 1.25e-02 | 13 |
| GO:0006354 | Colorectum | AD | DNA-templated transcription, elongation | 31/3918 | 91/18723 | 2.46e-03 | 1.90e-02 | 31 |
| GO:0006368 | Colorectum | AD | transcription elongation from RNA polymerase II promoter | 24/3918 | 69/18723 | 5.35e-03 | 3.52e-02 | 24 |
| GO:00083801 | Colorectum | SER | RNA splicing | 123/2897 | 434/18723 | 3.84e-12 | 8.41e-10 | 123 |
| GO:00083802 | Colorectum | MSS | RNA splicing | 159/3467 | 434/18723 | 1.75e-19 | 1.22e-16 | 159 |
| GO:00063541 | Colorectum | MSS | DNA-templated transcription, elongation | 29/3467 | 91/18723 | 1.52e-03 | 1.39e-02 | 29 |
| GO:00327861 | Colorectum | MSS | positive regulation of DNA-templated transcription, elongation | 12/3467 | 27/18723 | 1.74e-03 | 1.55e-02 | 12 |
| GO:00063681 | Colorectum | MSS | transcription elongation from RNA polymerase II promoter | 22/3467 | 69/18723 | 5.31e-03 | 3.62e-02 | 22 |
| GO:00083804 | Colorectum | FAP | RNA splicing | 108/2622 | 434/18723 | 7.90e-10 | 1.86e-07 | 108 |
| GO:00327862 | Colorectum | FAP | positive regulation of DNA-templated transcription, elongation | 11/2622 | 27/18723 | 5.93e-04 | 6.58e-03 | 11 |
| GO:00063682 | Colorectum | FAP | transcription elongation from RNA polymerase II promoter | 20/2622 | 69/18723 | 9.25e-04 | 9.26e-03 | 20 |
| GO:00063542 | Colorectum | FAP | DNA-templated transcription, elongation | 24/2622 | 91/18723 | 1.32e-03 | 1.22e-02 | 24 |
| GO:0032968 | Colorectum | FAP | positive regulation of transcription elongation from RNA polymerase II promoter | 6/2622 | 13/18723 | 5.32e-03 | 3.49e-02 | 6 |
| GO:00083805 | Colorectum | CRC | RNA splicing | 90/2078 | 434/18723 | 2.80e-09 | 7.97e-07 | 90 |
| GO:00063543 | Colorectum | CRC | DNA-templated transcription, elongation | 19/2078 | 91/18723 | 4.74e-03 | 3.67e-02 | 19 |
| GO:000838026 | Esophagus | HGIN | RNA splicing | 160/2587 | 434/18723 | 3.74e-34 | 1.12e-30 | 160 |
| Page: 1 2 3 4 5 |
| Pathway ID | Tissue | Disease Stage | Description | Gene Ratio | Bg Ratio | pvalue | p.adjust | qvalue | Count |
| hsa03040 | Colorectum | AD | Spliceosome | 73/2092 | 217/8465 | 1.73e-03 | 9.68e-03 | 6.18e-03 | 73 |
| hsa030401 | Colorectum | AD | Spliceosome | 73/2092 | 217/8465 | 1.73e-03 | 9.68e-03 | 6.18e-03 | 73 |
| hsa0304018 | Esophagus | HGIN | Spliceosome | 79/1383 | 217/8465 | 3.22e-13 | 7.00e-12 | 5.56e-12 | 79 |
| hsa0304019 | Esophagus | HGIN | Spliceosome | 79/1383 | 217/8465 | 3.22e-13 | 7.00e-12 | 5.56e-12 | 79 |
| hsa0304027 | Esophagus | ESCC | Spliceosome | 128/4205 | 217/8465 | 3.31e-03 | 8.79e-03 | 4.50e-03 | 128 |
| hsa0304037 | Esophagus | ESCC | Spliceosome | 128/4205 | 217/8465 | 3.31e-03 | 8.79e-03 | 4.50e-03 | 128 |
| hsa0304022 | Liver | HCC | Spliceosome | 122/4020 | 217/8465 | 5.55e-03 | 1.60e-02 | 8.91e-03 | 122 |
| hsa0304032 | Liver | HCC | Spliceosome | 122/4020 | 217/8465 | 5.55e-03 | 1.60e-02 | 8.91e-03 | 122 |
| hsa0304016 | Oral cavity | OSCC | Spliceosome | 123/3704 | 217/8465 | 7.21e-05 | 2.74e-04 | 1.40e-04 | 123 |
| hsa0304017 | Oral cavity | OSCC | Spliceosome | 123/3704 | 217/8465 | 7.21e-05 | 2.74e-04 | 1.40e-04 | 123 |
| Page: 1 |
Top |
Cell-cell communication analysis |
| Identification of potential cell-cell interactions between two cell types and their ligand-receptor pairs for different disease states |
| Ligand | Receptor | LRpair | Pathway | Tissue | Disease Stage |
| Page: 1 |
Top |
Single-cell gene regulatory network inference analysis |
| Find out the significant the regulons (TFs) and the target genes of each regulon across cell types for different disease states |
| TF | Cell Type | Tissue | Disease Stage | Target Gene | RSS | Regulon Activity |
| ∗The dot plots of a searched regulon are shown for all cell subpopulations in each disease state of each tissue based on the regulon specific score inferred using pySCENIC and by calculating the average expression. |
| Page: 1 |
Top |
Somatic mutation of malignant transformation related genes |
| Annotation of somatic variants for genes involved in malignant transformation |
| Hugo Symbol | Variant Class | Variant Classification | dbSNP RS | HGVSc | HGVSp | HGVSp Short | SWISSPROT | BIOTYPE | SIFT | PolyPhen | Tumor Sample Barcode | Tissue | Histology | Sex | Age | Stage | Therapy Types | Drugs | Outcome |
| TCERG1 | SNV | Missense_Mutation | c.1099N>T | p.Arg367Cys | p.R367C | O14776 | protein_coding | deleterious(0.01) | probably_damaging(0.973) | TCGA-AN-A046-01 | Breast | breast invasive carcinoma | Female | >=65 | I/II | Unknown | Unknown | SD | |
| TCERG1 | SNV | Missense_Mutation | c.3142N>A | p.Glu1048Lys | p.E1048K | O14776 | protein_coding | deleterious(0.01) | benign(0.23) | TCGA-BH-A0HF-01 | Breast | breast invasive carcinoma | Female | >=65 | I/II | Hormone Therapy | arimidex | SD | |
| TCERG1 | SNV | Missense_Mutation | c.2896N>T | p.Asp966Tyr | p.D966Y | O14776 | protein_coding | deleterious(0) | probably_damaging(0.989) | TCGA-D8-A1J8-01 | Breast | breast invasive carcinoma | Female | >=65 | I/II | Hormone Therapy | nolvadex | SD | |
| TCERG1 | SNV | Missense_Mutation | rs747728427 | c.832A>C | p.Thr278Pro | p.T278P | O14776 | protein_coding | tolerated_low_confidence(0.26) | benign(0.051) | TCGA-E9-A227-01 | Breast | breast invasive carcinoma | Female | <65 | I/II | Chemotherapy | taxotere | CR |
| TCERG1 | SNV | Missense_Mutation | rs747728427 | c.832N>C | p.Thr278Pro | p.T278P | O14776 | protein_coding | tolerated_low_confidence(0.26) | benign(0.051) | TCGA-E9-A22A-01 | Breast | breast invasive carcinoma | Female | >=65 | I/II | Hormone Therapy | tamoxiphen | SD |
| TCERG1 | SNV | Missense_Mutation | novel | c.308C>T | p.Pro103Leu | p.P103L | O14776 | protein_coding | deleterious(0.01) | benign(0.326) | TCGA-2W-A8YY-01 | Cervix | cervical & endocervical cancer | Female | <65 | I/II | Chemotherapy | cisplatin | CR |
| TCERG1 | SNV | Missense_Mutation | novel | c.1517C>A | p.Pro506His | p.P506H | O14776 | protein_coding | deleterious(0) | possibly_damaging(0.536) | TCGA-2W-A8YY-01 | Cervix | cervical & endocervical cancer | Female | <65 | I/II | Chemotherapy | cisplatin | CR |
| TCERG1 | SNV | Missense_Mutation | c.907G>T | p.Asp303Tyr | p.D303Y | O14776 | protein_coding | deleterious(0.04) | possibly_damaging(0.446) | TCGA-C5-A3HE-01 | Cervix | cervical & endocervical cancer | Female | <65 | I/II | Unknown | Unknown | PD | |
| TCERG1 | SNV | Missense_Mutation | c.2294N>C | p.Lys765Thr | p.K765T | O14776 | protein_coding | deleterious(0) | probably_damaging(0.996) | TCGA-FU-A3HZ-01 | Cervix | cervical & endocervical cancer | Female | <65 | I/II | Chemotherapy | cisplatin | CR | |
| TCERG1 | SNV | Missense_Mutation | novel | c.2263N>A | p.Ala755Thr | p.A755T | O14776 | protein_coding | deleterious(0.01) | benign(0.342) | TCGA-MA-AA41-01 | Cervix | cervical & endocervical cancer | Female | <65 | I/II | Unknown | Unknown | SD |
| Page: 1 2 3 4 5 6 7 8 9 10 11 12 13 14 15 |
Top |
Related drugs of malignant transformation related genes |
| Identification of chemicals and drugs interact with genes involved in malignant transfromation |
| (DGIdb 4.0) |
| Entrez ID | Symbol | Category | Interaction Types | Drug Claim Name | Drug Name | PMIDs |
| Page: 1 |

Copyright 2023-Present -The University of Texas Health Science Center at Houston |