
|
|||||
|
 | |
| |
| |
| |
| |
| |
|
Gene: TCEAL9 |
Gene summary for TCEAL9 |
| Gene information | Species | Human | Gene symbol | TCEAL9 | Gene ID | 51186 |
| Gene name | transcription elongation factor A like 9 | |
| Gene Alias | WBP5 | |
| Cytomap | Xq22.2 | |
| Gene Type | protein-coding | GO ID | GO:0005575 | UniProtAcc | Q9UHQ7 |
Top |
Malignant transformation analysis |
| Identification of the aberrant gene expression in precancerous and cancerous lesions by comparing the gene expression of stem-like cells in diseased tissues with normal stem cells |
| Entrez ID | Symbol | Replicates | Species | Organ | Tissue | Adj P-value | Log2FC | Malignancy |
| 51186 | TCEAL9 | CA_HPV_1 | Human | Cervix | CC | 9.80e-03 | -1.72e-01 | 0.0264 |
| 51186 | TCEAL9 | Tumor | Human | Cervix | CC | 3.32e-13 | -2.63e-01 | 0.1241 |
| 51186 | TCEAL9 | sample1 | Human | Cervix | CC | 8.14e-07 | 5.46e-01 | 0.0959 |
| 51186 | TCEAL9 | sample3 | Human | Cervix | CC | 1.51e-37 | 6.92e-01 | 0.1387 |
| 51186 | TCEAL9 | T1 | Human | Cervix | CC | 7.87e-14 | 5.50e-01 | 0.0918 |
| 51186 | TCEAL9 | T3 | Human | Cervix | CC | 5.21e-33 | 6.96e-01 | 0.1389 |
| 51186 | TCEAL9 | HTA11_1938_2000001011 | Human | Colorectum | AD | 6.90e-04 | 3.14e-01 | -0.0811 |
| 51186 | TCEAL9 | HTA11_78_2000001011 | Human | Colorectum | AD | 3.99e-02 | 2.23e-01 | -0.1088 |
| 51186 | TCEAL9 | HTA11_347_2000001011 | Human | Colorectum | AD | 1.78e-08 | 3.48e-01 | -0.1954 |
| 51186 | TCEAL9 | HTA11_696_2000001011 | Human | Colorectum | AD | 2.23e-03 | 1.69e-01 | -0.1464 |
| 51186 | TCEAL9 | HTA11_866_2000001011 | Human | Colorectum | AD | 1.60e-02 | 1.85e-01 | -0.1001 |
| 51186 | TCEAL9 | HTA11_1391_2000001011 | Human | Colorectum | AD | 2.47e-03 | 3.02e-01 | -0.059 |
| 51186 | TCEAL9 | HTA11_866_3004761011 | Human | Colorectum | AD | 2.17e-04 | 2.35e-01 | 0.096 |
| 51186 | TCEAL9 | HTA11_7663_2000001011 | Human | Colorectum | SER | 9.11e-04 | 4.51e-01 | 0.0131 |
| 51186 | TCEAL9 | HTA11_10711_2000001011 | Human | Colorectum | AD | 2.10e-02 | 2.37e-01 | 0.0338 |
| 51186 | TCEAL9 | HTA11_7696_3000711011 | Human | Colorectum | AD | 1.25e-11 | 3.79e-01 | 0.0674 |
| 51186 | TCEAL9 | HTA11_6818_2000001021 | Human | Colorectum | AD | 9.99e-03 | 3.07e-01 | 0.0588 |
| 51186 | TCEAL9 | HTA11_99999970781_79442 | Human | Colorectum | MSS | 1.41e-21 | 5.02e-01 | 0.294 |
| 51186 | TCEAL9 | AEH-subject1 | Human | Endometrium | AEH | 4.77e-29 | 5.28e-01 | -0.3059 |
| 51186 | TCEAL9 | AEH-subject2 | Human | Endometrium | AEH | 6.42e-16 | 3.36e-01 | -0.2525 |
| Page: 1 2 3 4 5 6 7 8 9 10 |
| Tissue | Expression Dynamics | Abbreviation |
| Cervix | 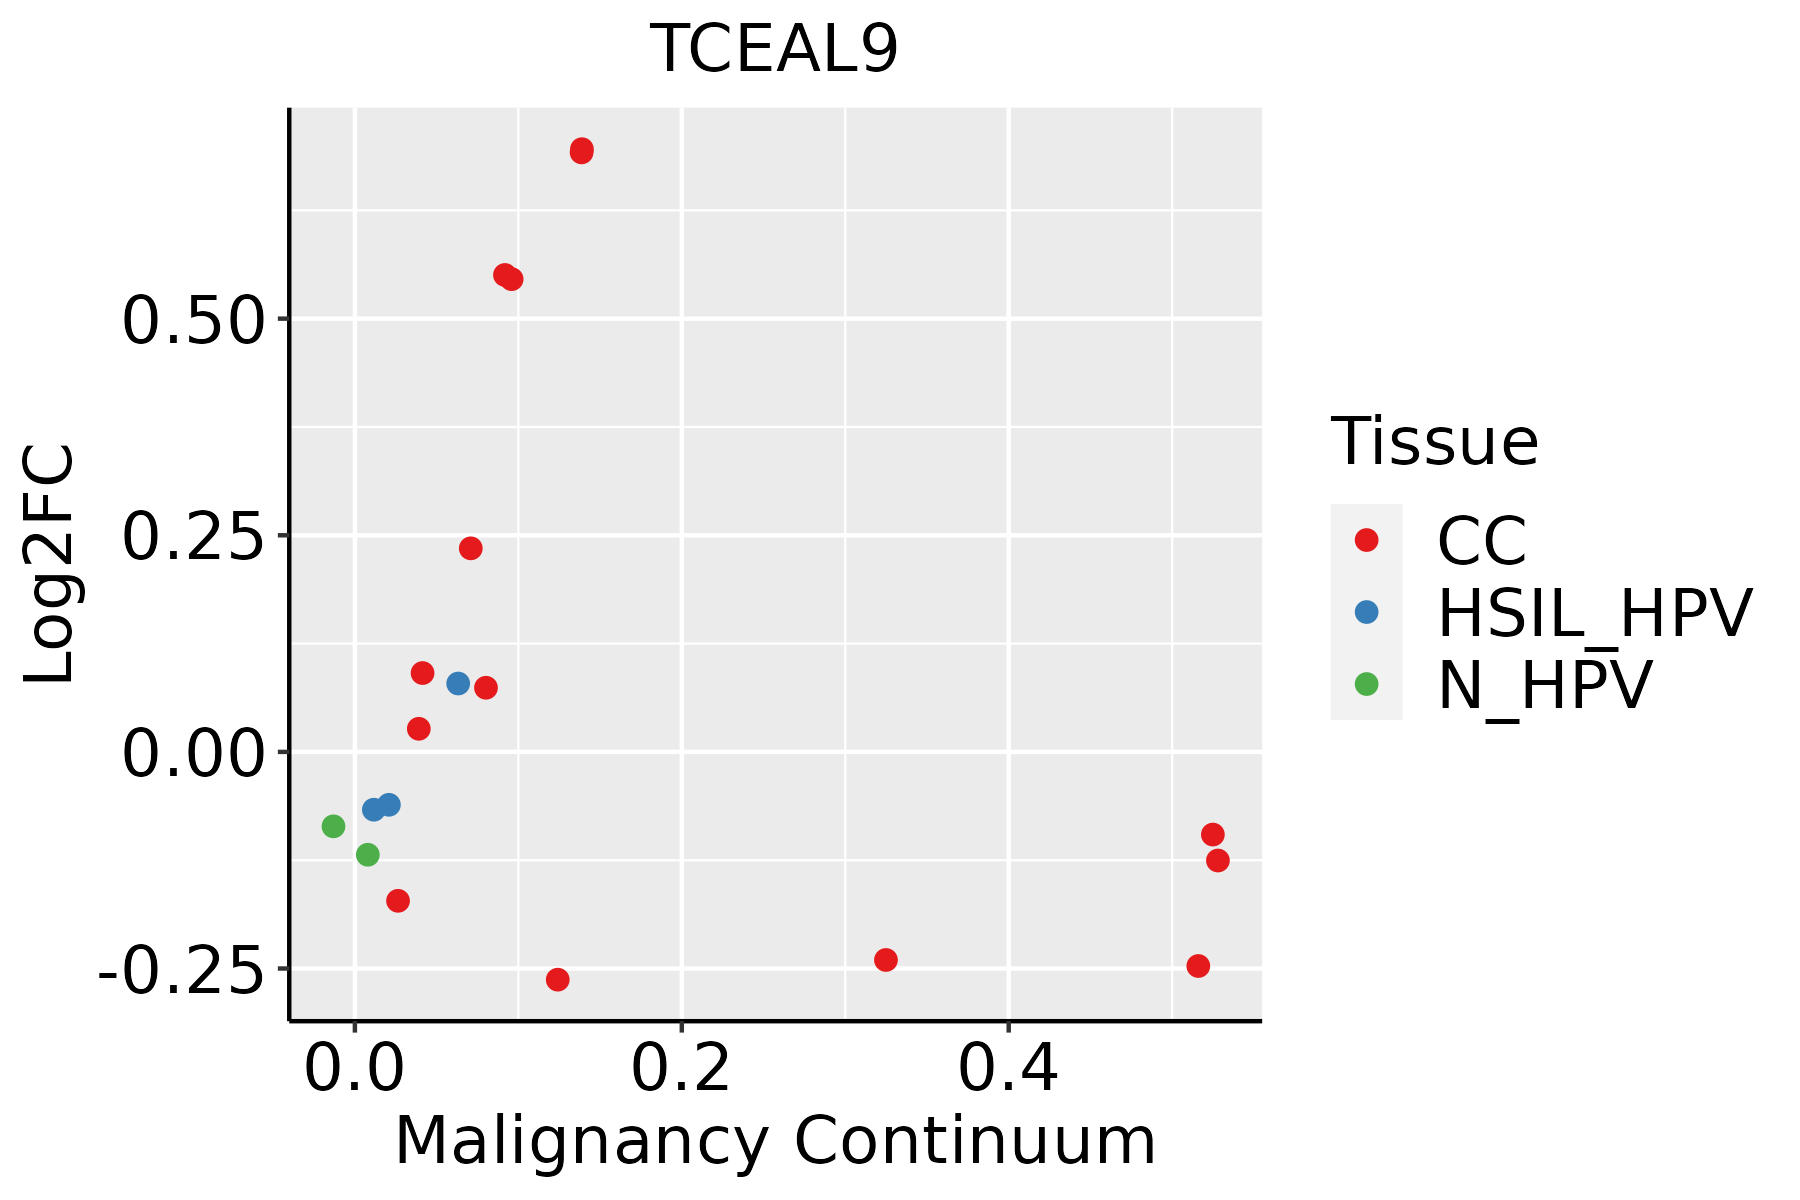 | CC: Cervix cancer |
| HSIL_HPV: HPV-infected high-grade squamous intraepithelial lesions | ||
| N_HPV: HPV-infected normal cervix | ||
| Colorectum (GSE201348) |  | FAP: Familial adenomatous polyposis |
| CRC: Colorectal cancer | ||
| Colorectum (HTA11) |  | AD: Adenomas |
| SER: Sessile serrated lesions | ||
| MSI-H: Microsatellite-high colorectal cancer | ||
| MSS: Microsatellite stable colorectal cancer | ||
| Endometrium | 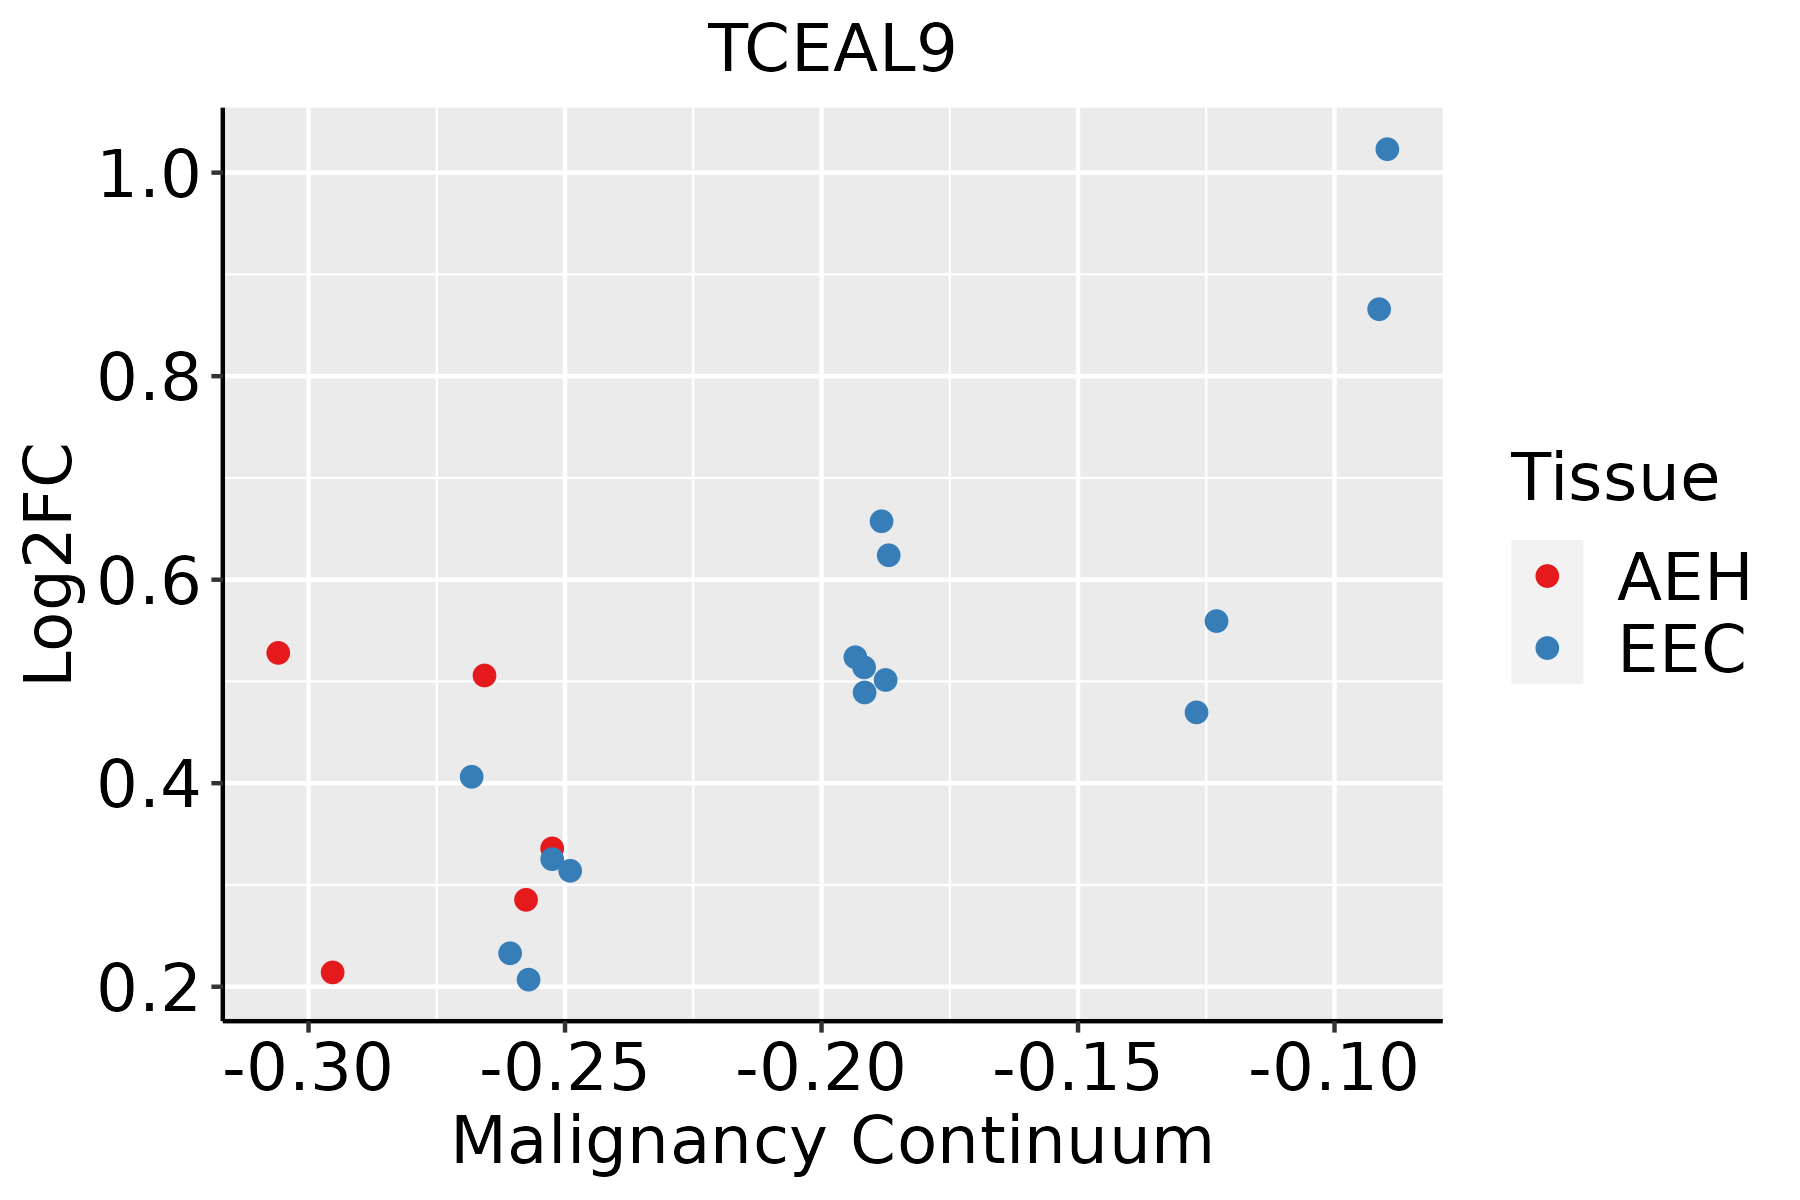 | AEH: Atypical endometrial hyperplasia |
| EEC: Endometrioid Cancer | ||
| Esophagus | 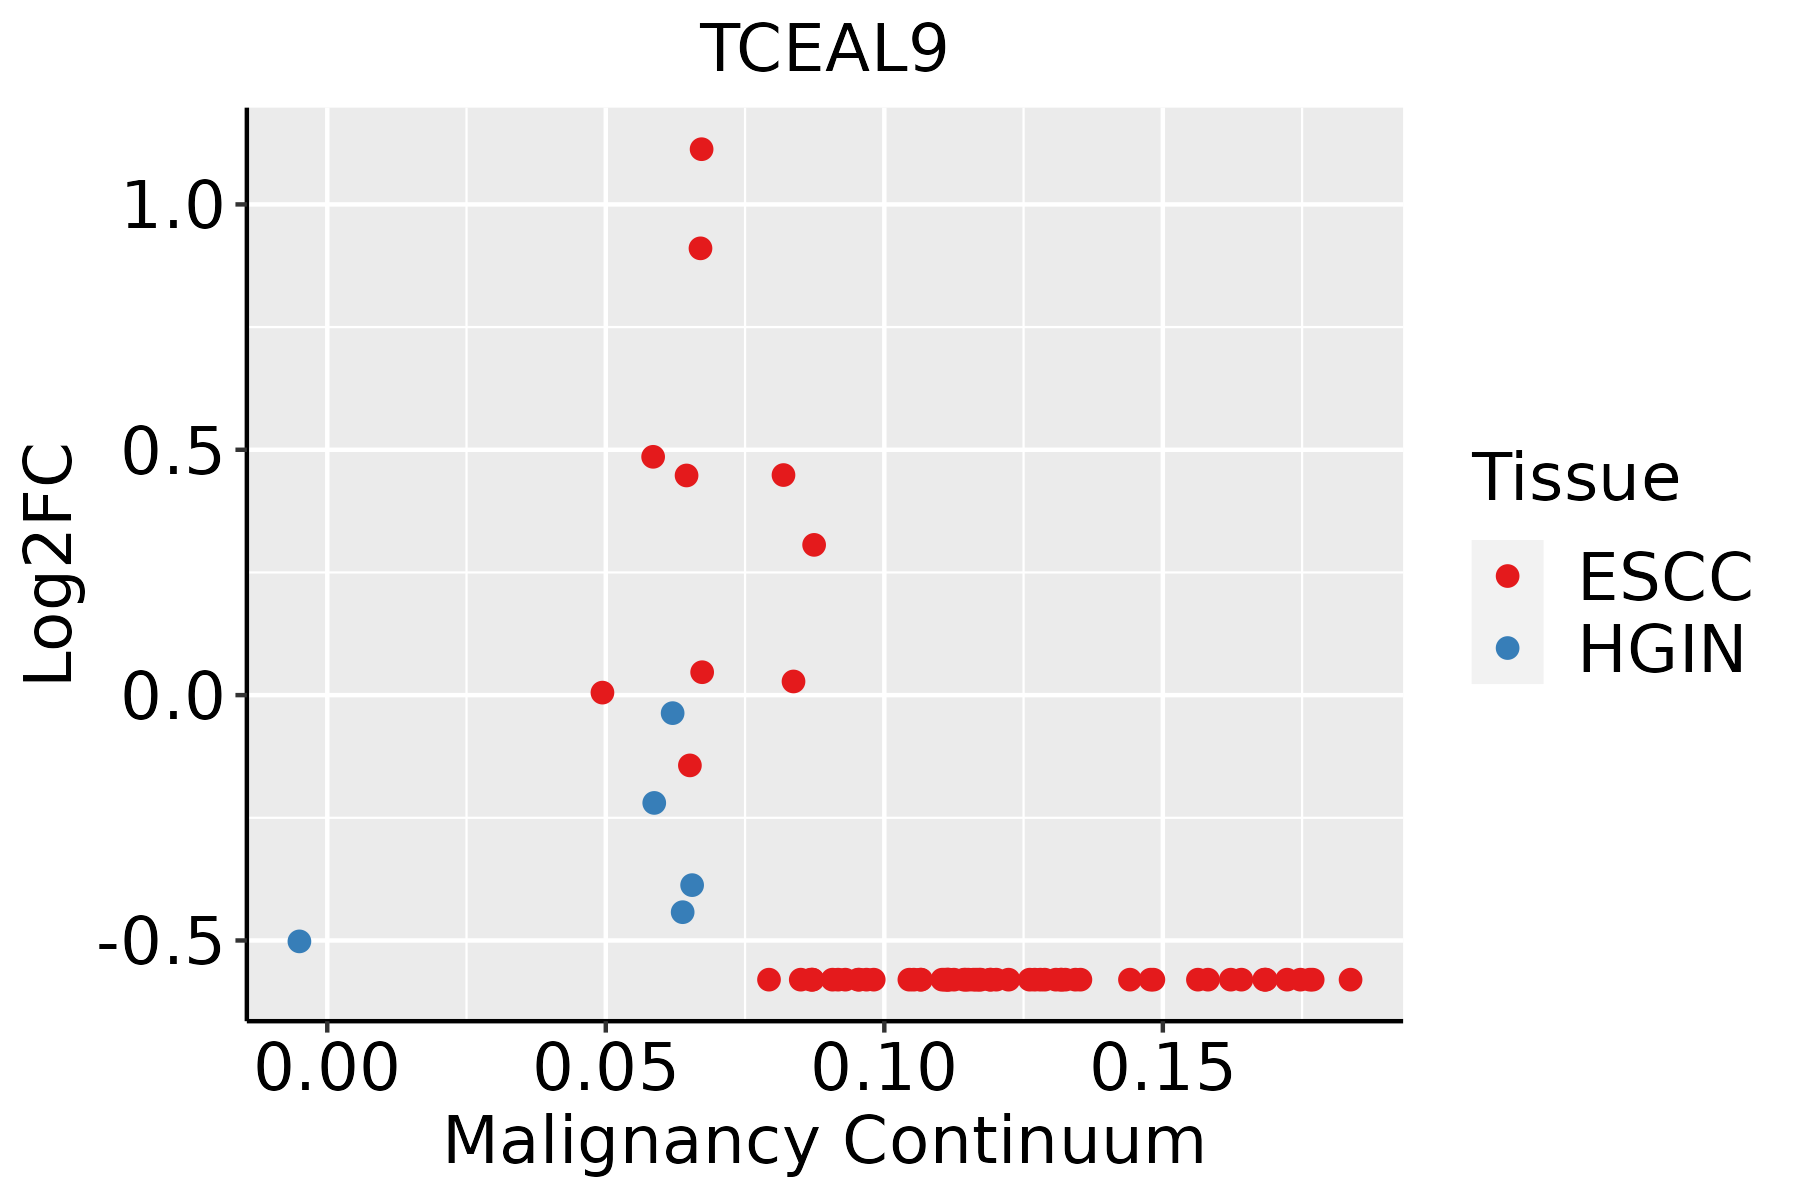 | ESCC: Esophageal squamous cell carcinoma |
| HGIN: High-grade intraepithelial neoplasias | ||
| LGIN: Low-grade intraepithelial neoplasias | ||
| GC | 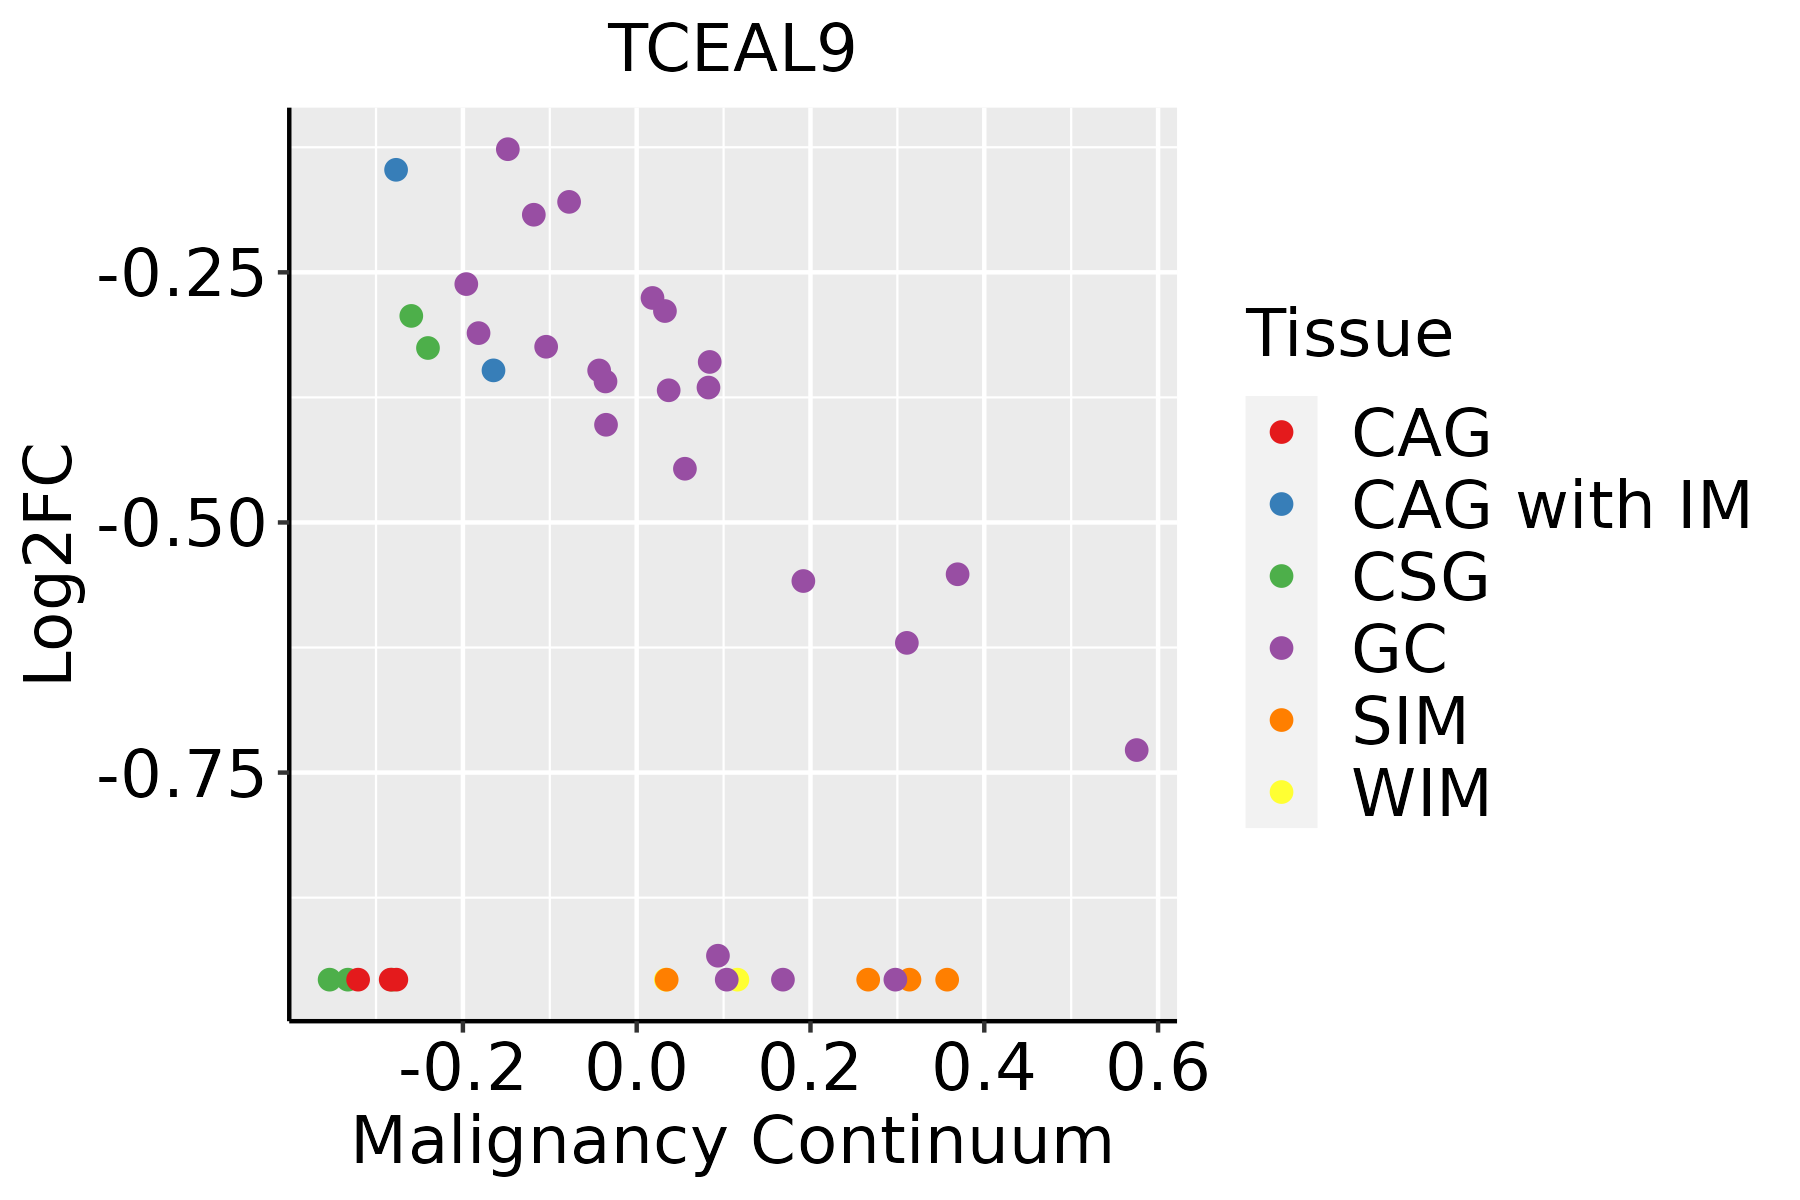 | CAG: Chronic atrophic gastritis |
| CAG with IM: Chronic atrophic gastritis with intestinal metaplasia | ||
| CSG: Chronic superficial gastritis | ||
| GC: Gastric cancer | ||
| SIM: Severe intestinal metaplasia | ||
| WIM: Wild intestinal metaplasia | ||
| Liver |  | HCC: Hepatocellular carcinoma |
| NAFLD: Non-alcoholic fatty liver disease | ||
| Prostate | 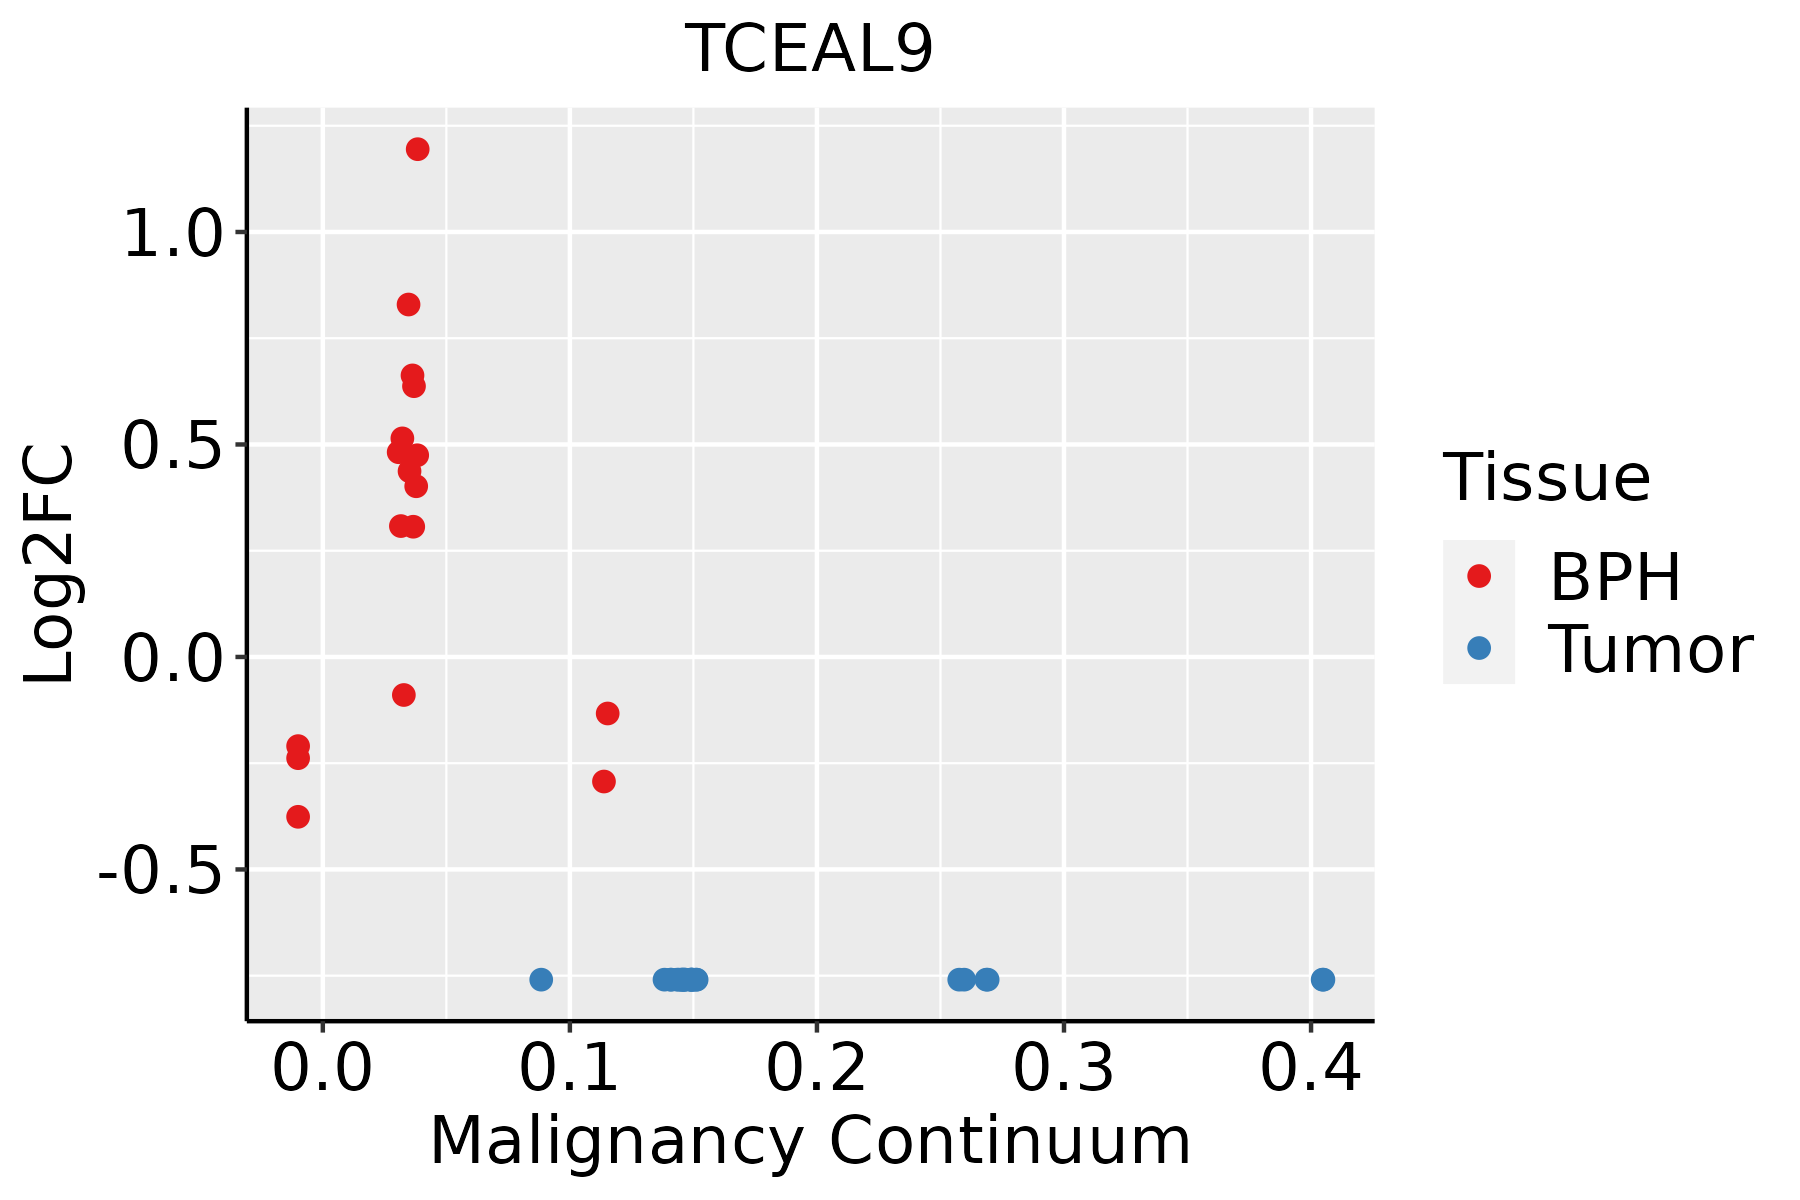 | BPH: Benign Prostatic Hyperplasia |
| Thyroid | 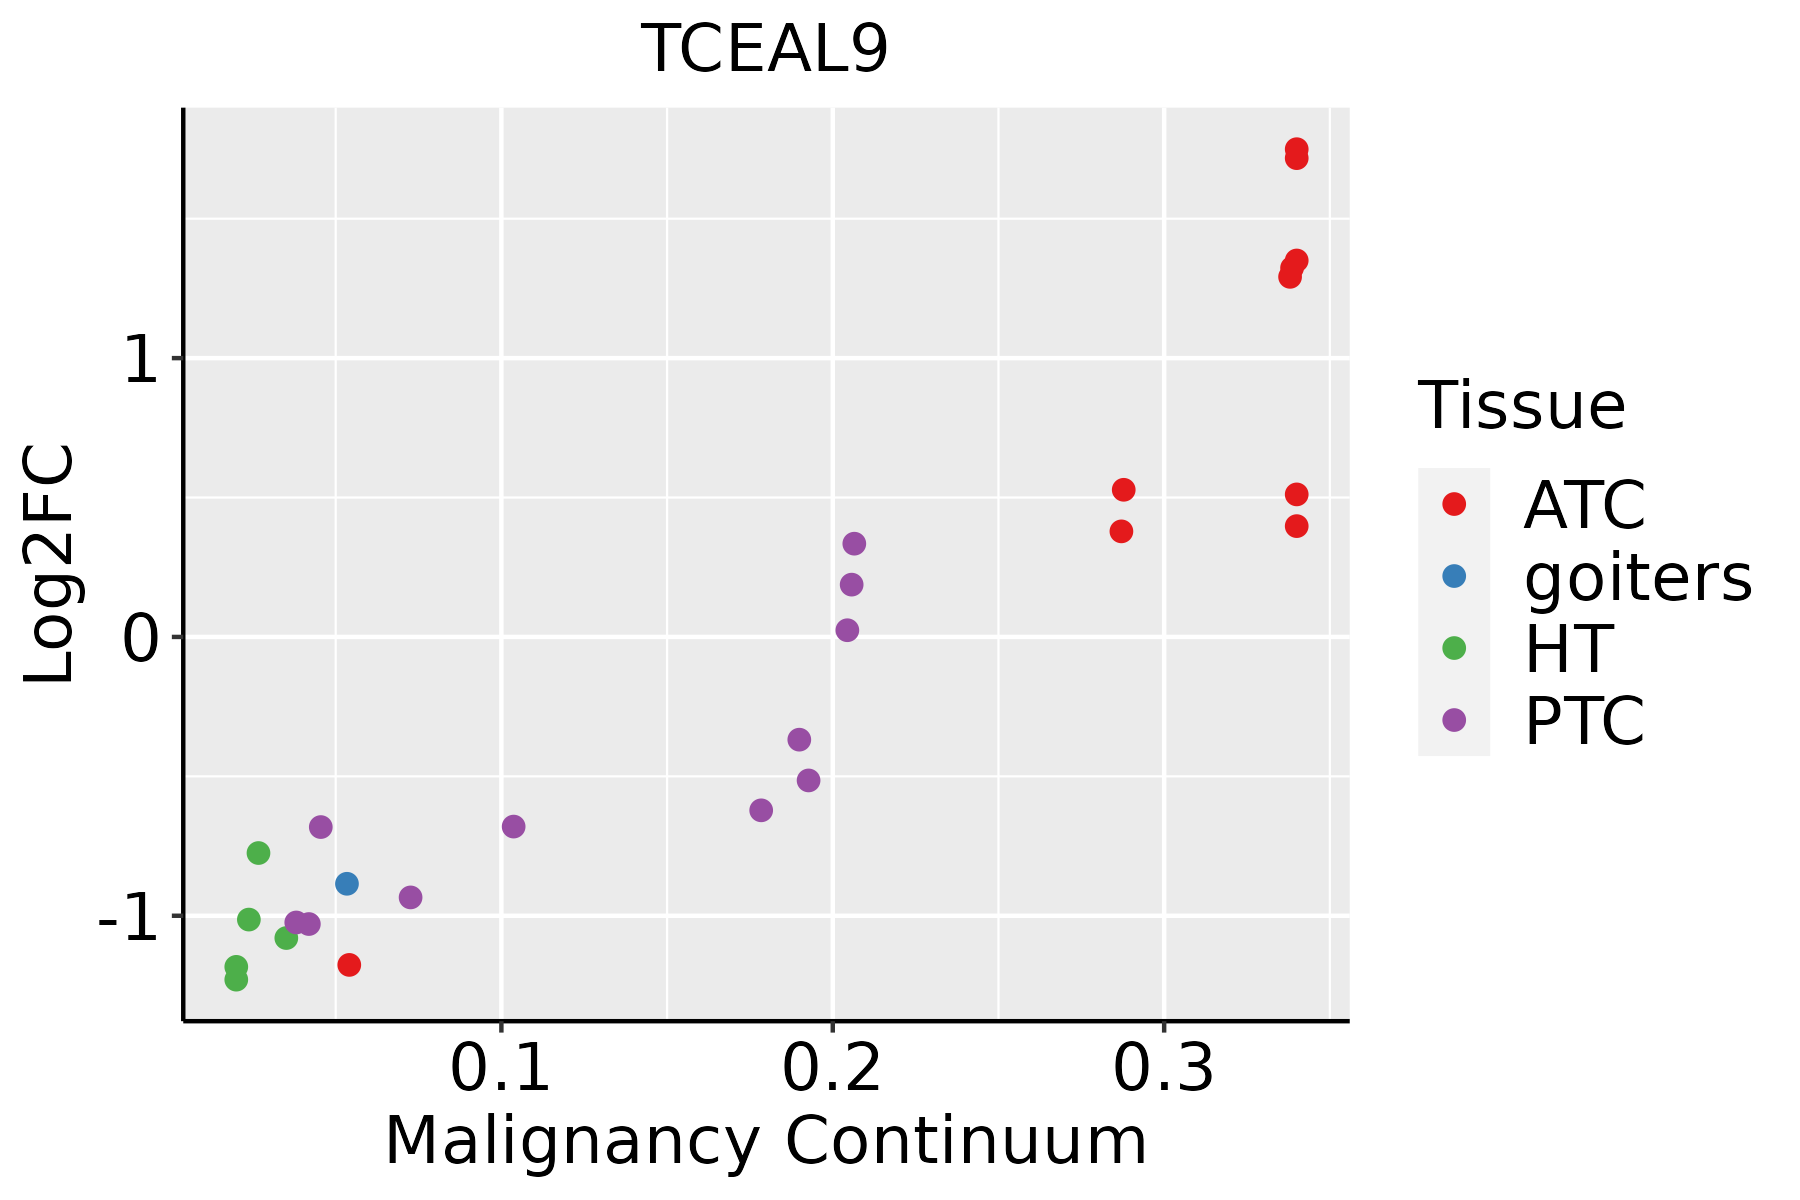 | ATC: Anaplastic thyroid cancer |
| HT: Hashimoto's thyroiditis | ||
| PTC: Papillary thyroid cancer |
| ∗log2FC in expression of this searched gene in stem-like cells from each diseased tissue sample relative to stem-like cells in normal samples in each tissue plotted against the malignancy continuum. Samples are colored based on if they are from different disease stage. |
Top |
Malignant transformation related pathway analysis |
| Find out the enriched GO biological processes and KEGG pathways involved in transition from healthy to precancer to cancer |
| Tissue | Disease Stage | Enriched GO biological Processes |
| Colorectum | AD |  |
| Colorectum | SER |  |
| Colorectum | MSS |  |
| Colorectum | MSI-H |  |
| Colorectum | FAP |  |
| ∗Top 15 enriched GO BP terms are showed in the bar plot of each disease state in each tissue. Each row represents a significant GO biological process which is colored according to the -log10(p.adjust). |
| Page: 1 2 3 4 5 6 7 8 9 |
| GO ID | Tissue | Disease Stage | Description | Gene Ratio | Bg Ratio | pvalue | p.adjust | Count |
| Page: 1 |
| Pathway ID | Tissue | Disease Stage | Description | Gene Ratio | Bg Ratio | pvalue | p.adjust | qvalue | Count |
| Page: 1 |
Top |
Cell-cell communication analysis |
| Identification of potential cell-cell interactions between two cell types and their ligand-receptor pairs for different disease states |
| Ligand | Receptor | LRpair | Pathway | Tissue | Disease Stage |
| Page: 1 |
Top |
Single-cell gene regulatory network inference analysis |
| Find out the significant the regulons (TFs) and the target genes of each regulon across cell types for different disease states |
| TF | Cell Type | Tissue | Disease Stage | Target Gene | RSS | Regulon Activity |
| ∗The dot plots of a searched regulon are shown for all cell subpopulations in each disease state of each tissue based on the regulon specific score inferred using pySCENIC and by calculating the average expression. |
| Page: 1 |
Top |
Somatic mutation of malignant transformation related genes |
| Annotation of somatic variants for genes involved in malignant transformation |
| Hugo Symbol | Variant Class | Variant Classification | dbSNP RS | HGVSc | HGVSp | HGVSp Short | SWISSPROT | BIOTYPE | SIFT | PolyPhen | Tumor Sample Barcode | Tissue | Histology | Sex | Age | Stage | Therapy Types | Drugs | Outcome |
| TCEAL9 | SNV | Missense_Mutation | c.260N>G | p.Leu87Arg | p.L87R | Q9UHQ7 | protein_coding | deleterious(0) | probably_damaging(0.939) | TCGA-A2-A1FW-01 | Breast | breast invasive carcinoma | Female | <65 | III/IV | Chemotherapy | cytoxan | SD | |
| TCEAL9 | SNV | Missense_Mutation | c.287N>A | p.Arg96Gln | p.R96Q | Q9UHQ7 | protein_coding | deleterious(0.02) | benign(0.013) | TCGA-AA-3984-01 | Colorectum | colon adenocarcinoma | Female | <65 | I/II | Unknown | Unknown | SD | |
| TCEAL9 | SNV | Missense_Mutation | c.226N>A | p.Glu76Lys | p.E76K | Q9UHQ7 | protein_coding | deleterious(0) | benign(0.35) | TCGA-AA-A00N-01 | Colorectum | colon adenocarcinoma | Male | >=65 | I/II | Unknown | Unknown | PD | |
| TCEAL9 | SNV | Missense_Mutation | novel | c.38N>T | p.Asn13Ile | p.N13I | Q9UHQ7 | protein_coding | deleterious(0.03) | benign(0.133) | TCGA-AG-3892-01 | Colorectum | rectum adenocarcinoma | Female | <65 | I/II | Unknown | Unknown | SD |
| TCEAL9 | SNV | Missense_Mutation | novel | c.210G>A | p.Met70Ile | p.M70I | Q9UHQ7 | protein_coding | tolerated(0.08) | benign(0.01) | TCGA-AG-A002-01 | Colorectum | rectum adenocarcinoma | Male | <65 | I/II | Unknown | Unknown | SD |
| TCEAL9 | insertion | Frame_Shift_Ins | novel | c.19dupA | p.Met7AsnfsTer8 | p.M7Nfs*8 | Q9UHQ7 | protein_coding | TCGA-G4-6586-01 | Colorectum | colon adenocarcinoma | Female | >=65 | I/II | Unknown | Unknown | SD | ||
| TCEAL9 | SNV | Missense_Mutation | novel | c.67N>T | p.Pro23Ser | p.P23S | Q9UHQ7 | protein_coding | tolerated(0.86) | probably_damaging(0.998) | TCGA-AJ-A3EK-01 | Endometrium | uterine corpus endometrioid carcinoma | Female | <65 | I/II | Chemotherapy | carboplatin | CR |
| TCEAL9 | SNV | Missense_Mutation | c.287N>A | p.Arg96Gln | p.R96Q | Q9UHQ7 | protein_coding | deleterious(0.02) | benign(0.013) | TCGA-AX-A0J0-01 | Endometrium | uterine corpus endometrioid carcinoma | Female | <65 | I/II | Unknown | Unknown | SD | |
| TCEAL9 | SNV | Missense_Mutation | novel | c.291N>A | p.Asn97Lys | p.N97K | Q9UHQ7 | protein_coding | tolerated(0.1) | benign(0.303) | TCGA-B5-A1MR-01 | Endometrium | uterine corpus endometrioid carcinoma | Female | >=65 | III/IV | Unknown | Unknown | SD |
| TCEAL9 | SNV | Missense_Mutation | novel | c.188G>T | p.Arg63Met | p.R63M | Q9UHQ7 | protein_coding | deleterious(0.03) | probably_damaging(0.917) | TCGA-B5-A3FA-01 | Endometrium | uterine corpus endometrioid carcinoma | Female | >=65 | I/II | Unknown | Unknown | SD |
| Page: 1 2 |
Top |
Related drugs of malignant transformation related genes |
| Identification of chemicals and drugs interact with genes involved in malignant transfromation |
| (DGIdb 4.0) |
| Entrez ID | Symbol | Category | Interaction Types | Drug Claim Name | Drug Name | PMIDs |
| Page: 1 |

Copyright 2023-Present -The University of Texas Health Science Center at Houston |