
|
|||||
|
 | |
| |
| |
| |
| |
| |
|
Gene: TCEAL8 |
Gene summary for TCEAL8 |
| Gene information | Species | Human | Gene symbol | TCEAL8 | Gene ID | 90843 |
| Gene name | transcription elongation factor A like 8 | |
| Gene Alias | WEX3 | |
| Cytomap | Xq22.1 | |
| Gene Type | protein-coding | GO ID | GO:0005575 | UniProtAcc | Q8IYN2 |
Top |
Malignant transformation analysis |
| Identification of the aberrant gene expression in precancerous and cancerous lesions by comparing the gene expression of stem-like cells in diseased tissues with normal stem cells |
| Entrez ID | Symbol | Replicates | Species | Organ | Tissue | Adj P-value | Log2FC | Malignancy |
| 90843 | TCEAL8 | AEH-subject1 | Human | Endometrium | AEH | 2.31e-33 | -5.71e-01 | -0.3059 |
| 90843 | TCEAL8 | AEH-subject2 | Human | Endometrium | AEH | 6.53e-22 | -4.90e-01 | -0.2525 |
| 90843 | TCEAL8 | AEH-subject3 | Human | Endometrium | AEH | 1.31e-26 | -5.39e-01 | -0.2576 |
| 90843 | TCEAL8 | AEH-subject4 | Human | Endometrium | AEH | 5.37e-22 | -5.95e-01 | -0.2657 |
| 90843 | TCEAL8 | AEH-subject5 | Human | Endometrium | AEH | 1.12e-26 | -5.77e-01 | -0.2953 |
| 90843 | TCEAL8 | EEC-subject1 | Human | Endometrium | EEC | 1.30e-34 | -5.43e-01 | -0.2682 |
| 90843 | TCEAL8 | EEC-subject2 | Human | Endometrium | EEC | 9.26e-37 | -6.25e-01 | -0.2607 |
| 90843 | TCEAL8 | EEC-subject3 | Human | Endometrium | EEC | 5.40e-57 | -5.95e-01 | -0.2525 |
| 90843 | TCEAL8 | EEC-subject4 | Human | Endometrium | EEC | 7.55e-32 | -6.12e-01 | -0.2571 |
| 90843 | TCEAL8 | EEC-subject5 | Human | Endometrium | EEC | 6.56e-24 | -4.89e-01 | -0.249 |
| 90843 | TCEAL8 | GSM5276934 | Human | Endometrium | EEC | 1.20e-20 | -4.68e-01 | -0.0913 |
| 90843 | TCEAL8 | GSM5276935 | Human | Endometrium | EEC | 9.37e-14 | -4.08e-01 | -0.123 |
| 90843 | TCEAL8 | GSM5276937 | Human | Endometrium | EEC | 1.94e-12 | -4.39e-01 | -0.0897 |
| 90843 | TCEAL8 | GSM6177620_NYU_UCEC1_lib1_lib1 | Human | Endometrium | EEC | 6.86e-30 | -4.80e-01 | -0.1869 |
| 90843 | TCEAL8 | GSM6177620_NYU_UCEC1_lib2_lib2 | Human | Endometrium | EEC | 2.59e-33 | -4.78e-01 | -0.1875 |
| 90843 | TCEAL8 | GSM6177620_NYU_UCEC1_lib3_lib3 | Human | Endometrium | EEC | 5.23e-34 | -4.62e-01 | -0.1883 |
| 90843 | TCEAL8 | GSM6177621_NYU_UCEC2_lib1_lib1 | Human | Endometrium | EEC | 3.25e-42 | -5.25e-01 | -0.1934 |
| 90843 | TCEAL8 | GSM6177622_NYU_UCEC3_lib1_lib1 | Human | Endometrium | EEC | 5.28e-51 | -3.66e-01 | -0.1917 |
| 90843 | TCEAL8 | GSM6177622_NYU_UCEC3_lib2_lib2 | Human | Endometrium | EEC | 6.64e-42 | -4.03e-01 | -0.1916 |
| 90843 | TCEAL8 | GSM6177623_NYU_UCEC3_Vis | Human | Endometrium | EEC | 6.82e-18 | -4.37e-01 | -0.1269 |
| Page: 1 2 3 4 5 6 |
| Tissue | Expression Dynamics | Abbreviation |
| Endometrium | 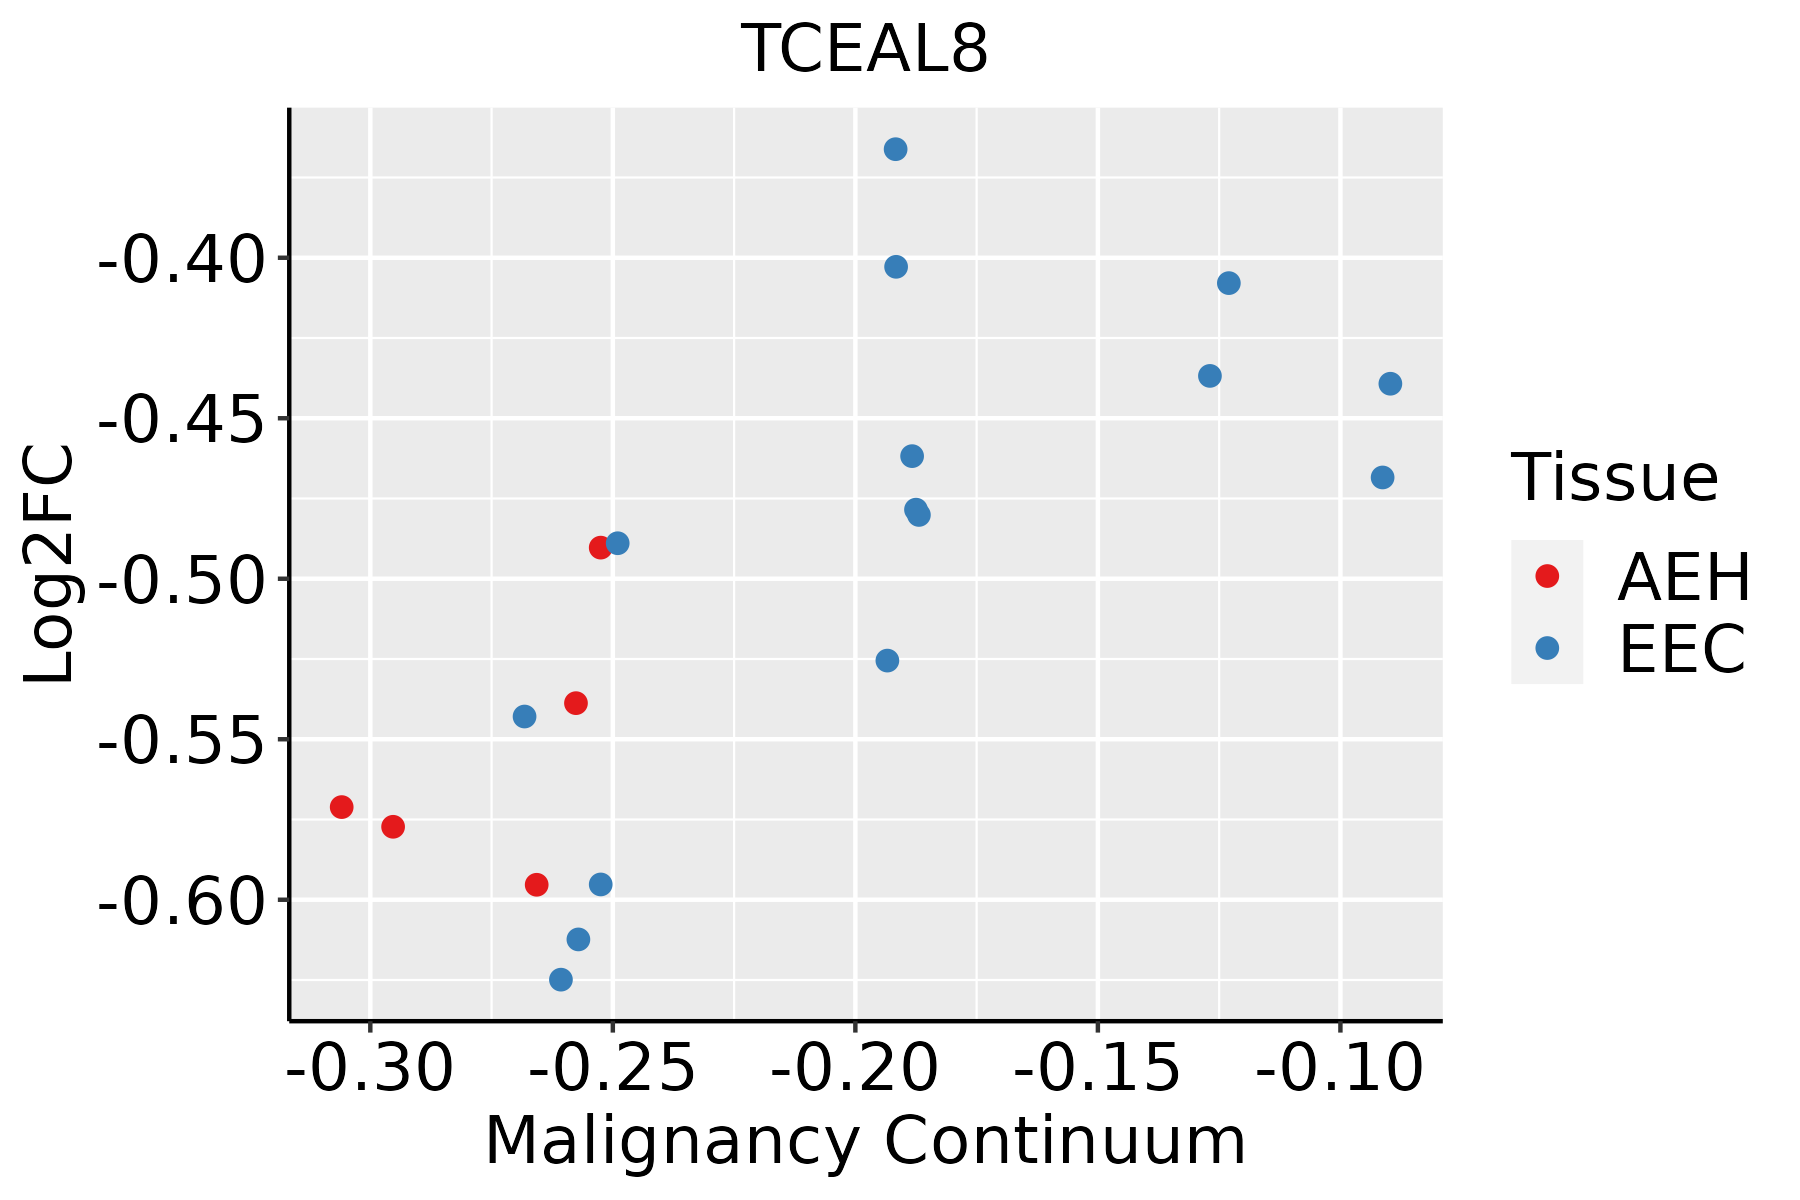 | AEH: Atypical endometrial hyperplasia |
| EEC: Endometrioid Cancer | ||
| Esophagus | 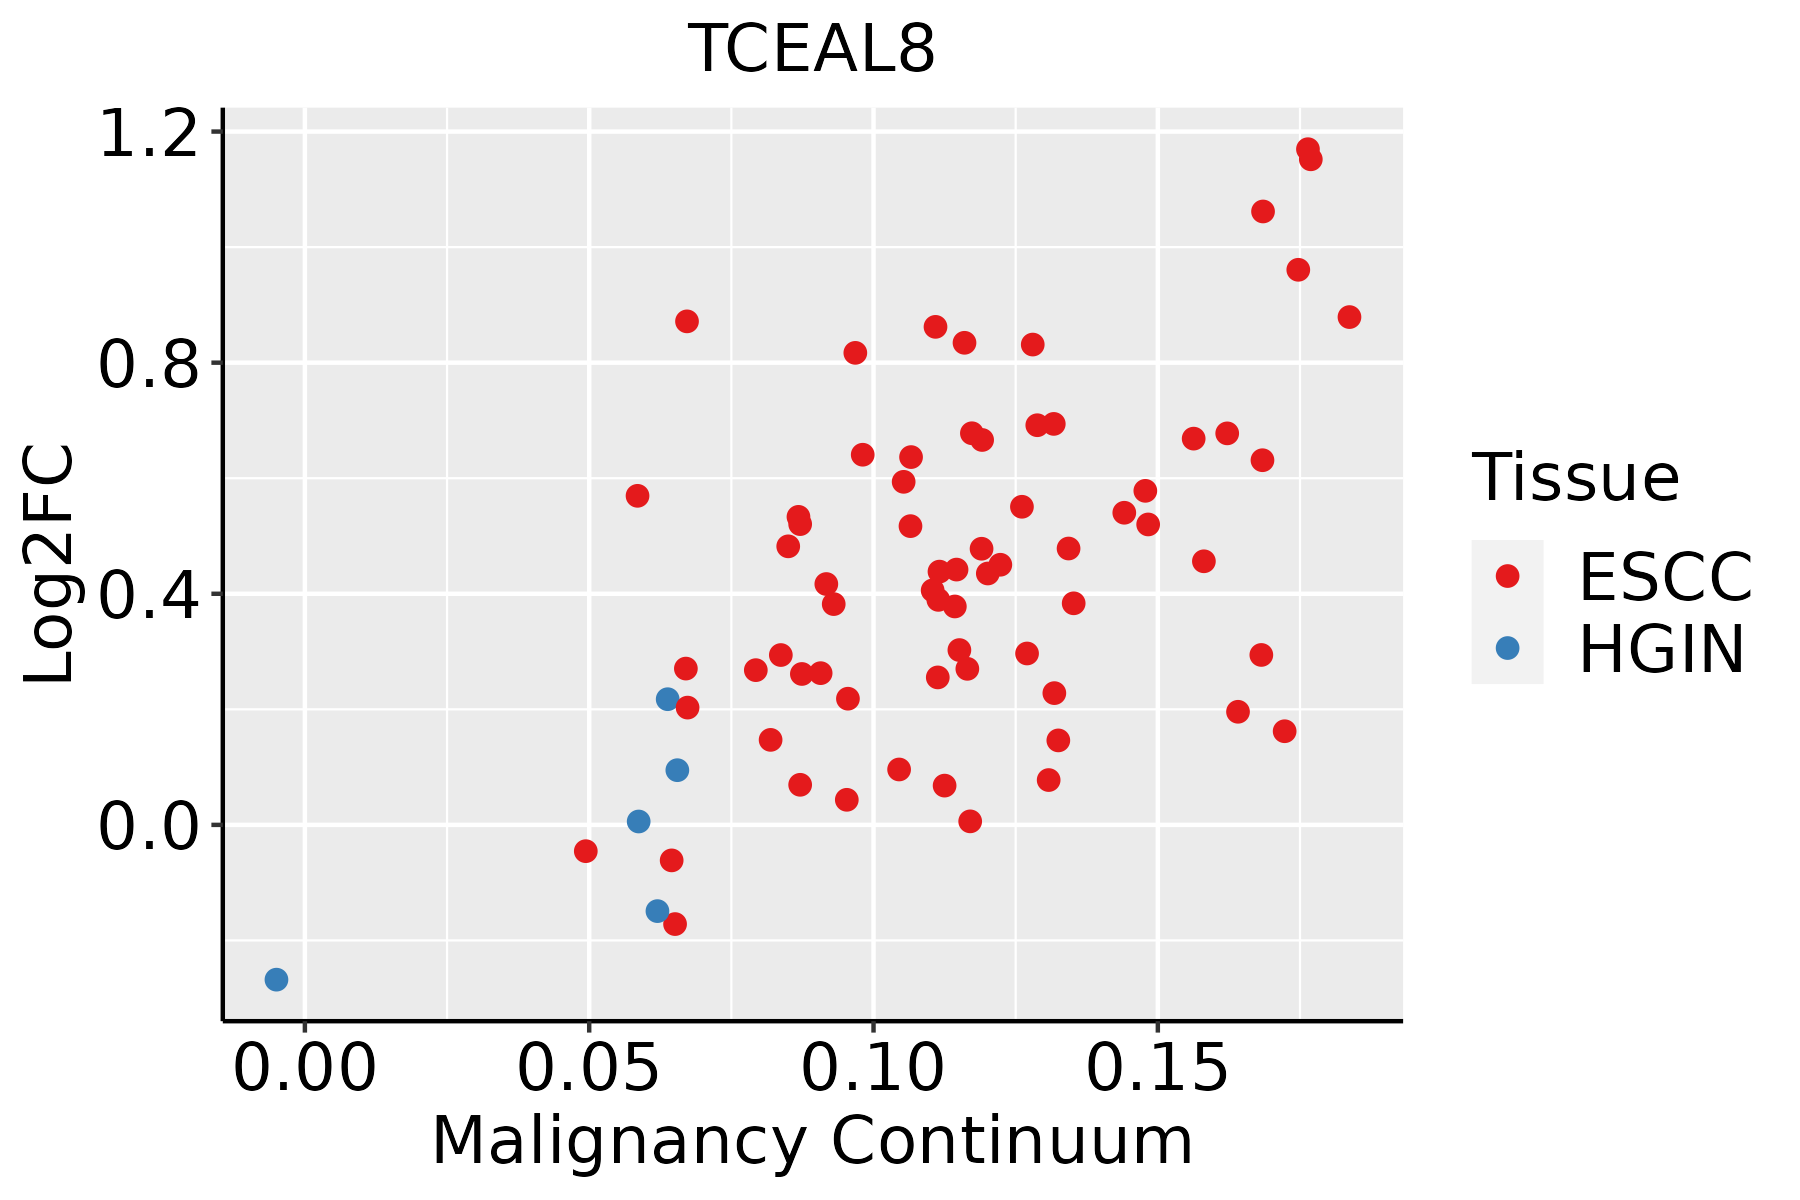 | ESCC: Esophageal squamous cell carcinoma |
| HGIN: High-grade intraepithelial neoplasias | ||
| LGIN: Low-grade intraepithelial neoplasias | ||
| Oral Cavity | 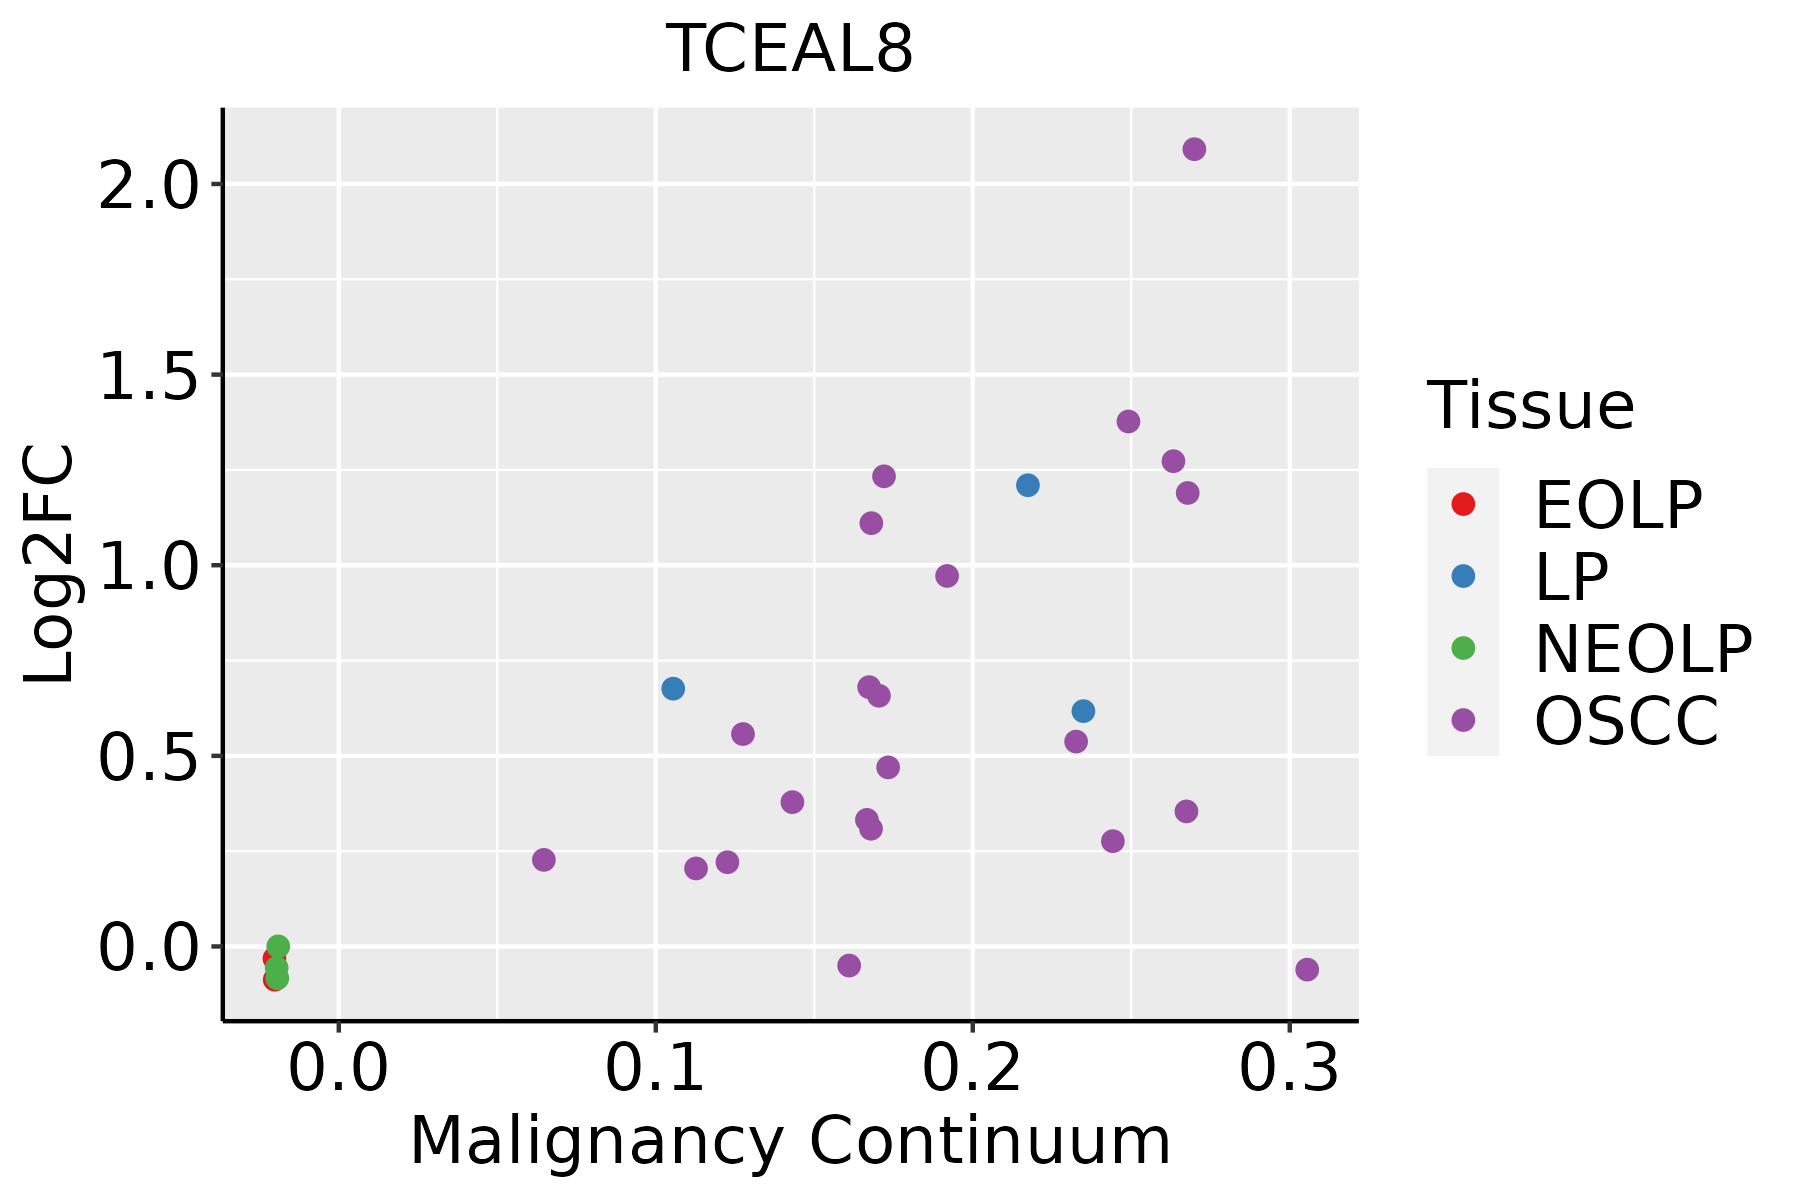 | EOLP: Erosive Oral lichen planus |
| LP: leukoplakia | ||
| NEOLP: Non-erosive oral lichen planus | ||
| OSCC: Oral squamous cell carcinoma | ||
| Prostate |  | BPH: Benign Prostatic Hyperplasia |
| Skin | 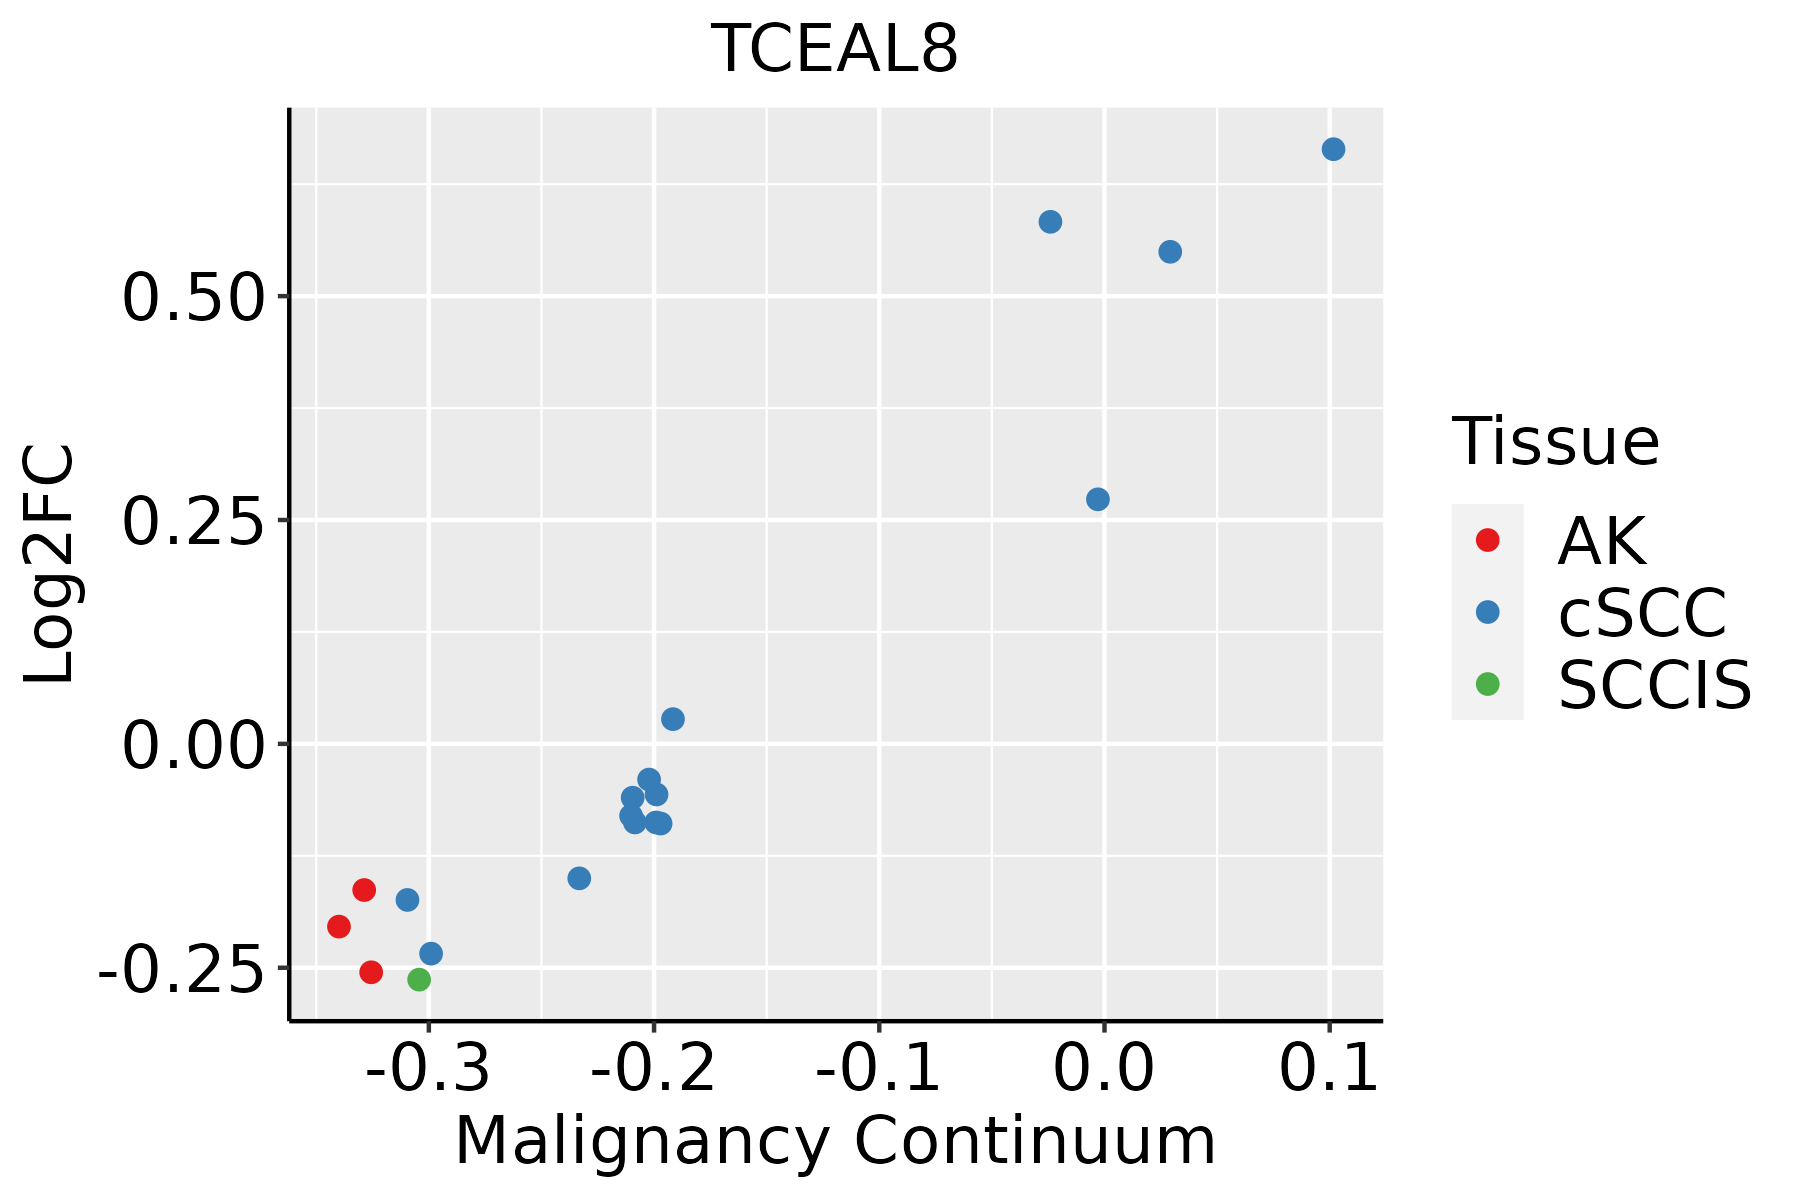 | AK: Actinic keratosis |
| cSCC: Cutaneous squamous cell carcinoma | ||
| SCCIS:squamous cell carcinoma in situ | ||
| Thyroid | 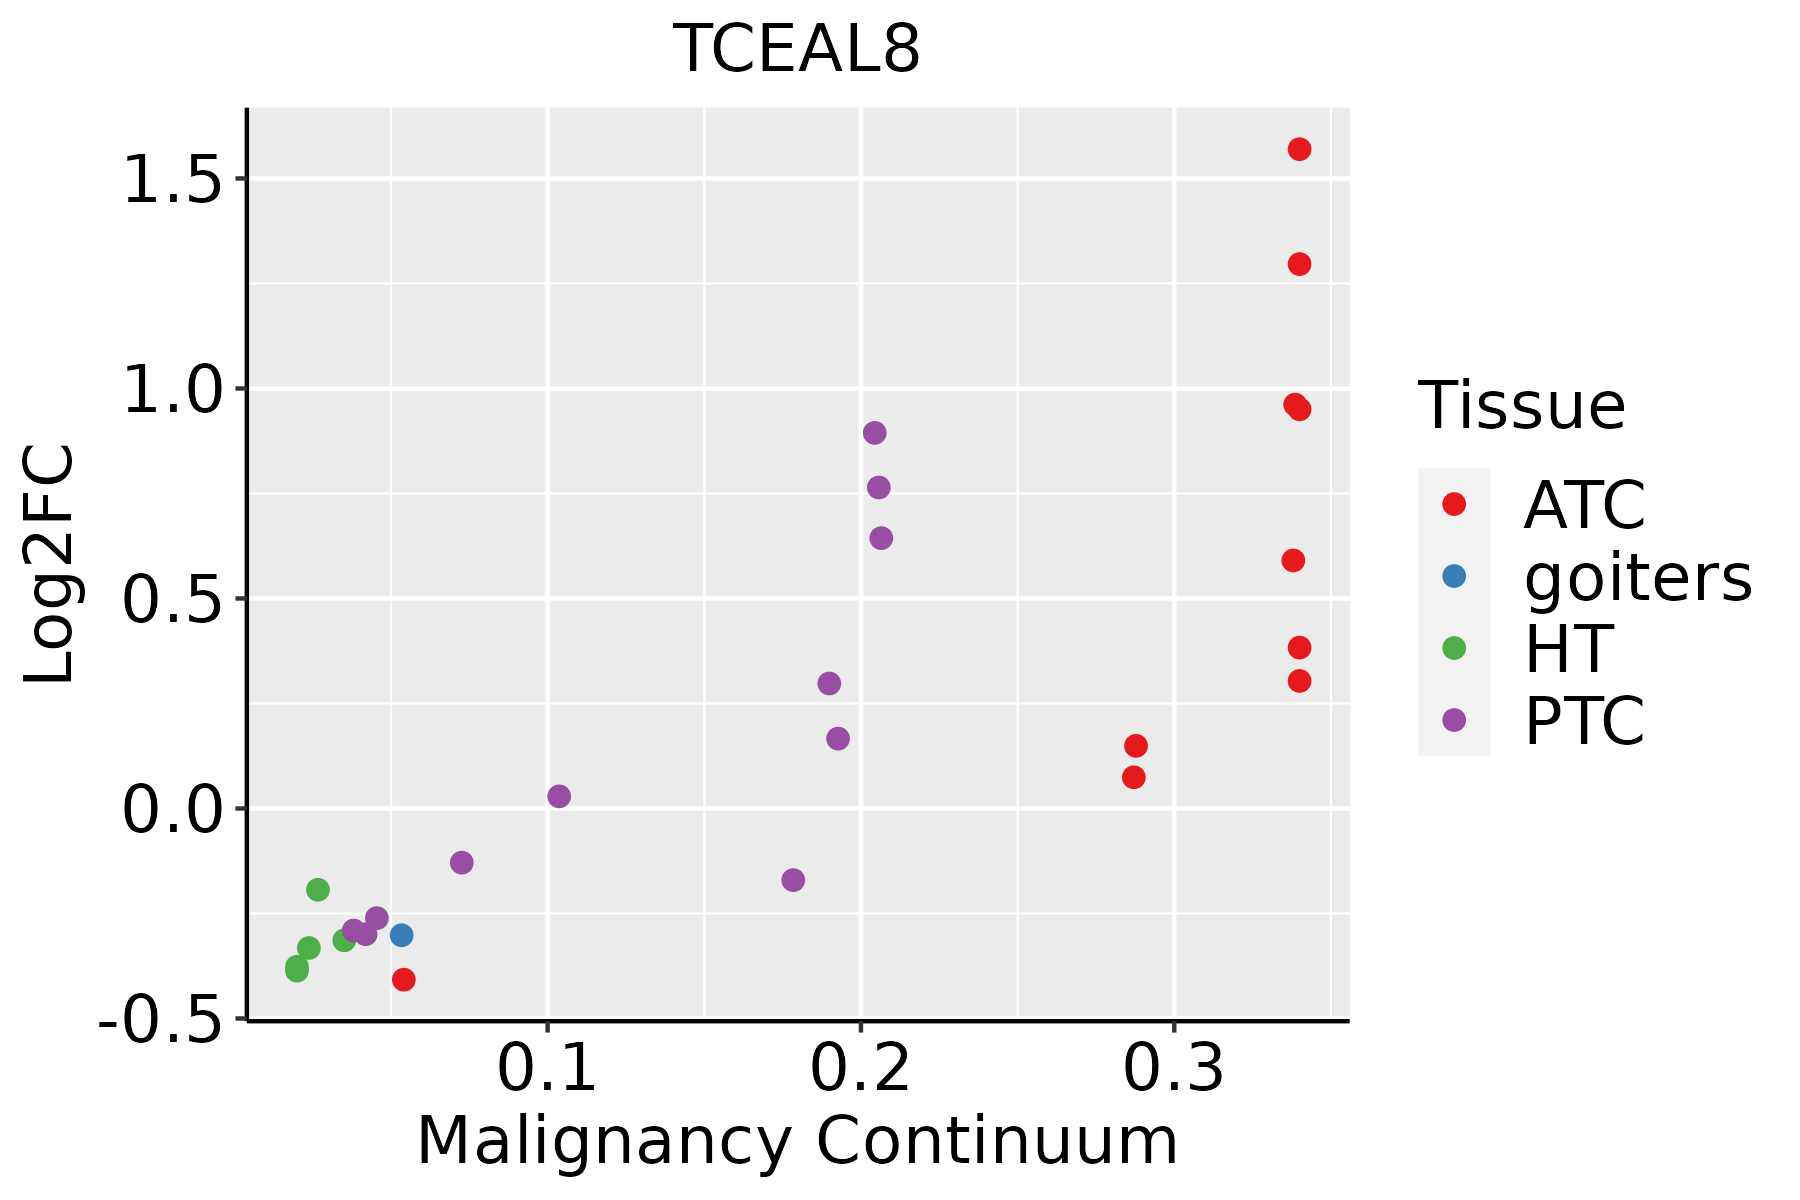 | ATC: Anaplastic thyroid cancer |
| HT: Hashimoto's thyroiditis | ||
| PTC: Papillary thyroid cancer |
| ∗log2FC in expression of this searched gene in stem-like cells from each diseased tissue sample relative to stem-like cells in normal samples in each tissue plotted against the malignancy continuum. Samples are colored based on if they are from different disease stage. |
Top |
Malignant transformation related pathway analysis |
| Find out the enriched GO biological processes and KEGG pathways involved in transition from healthy to precancer to cancer |
| Tissue | Disease Stage | Enriched GO biological Processes |
| Colorectum | AD |  |
| Colorectum | SER |  |
| Colorectum | MSS |  |
| Colorectum | MSI-H |  |
| Colorectum | FAP |  |
| ∗Top 15 enriched GO BP terms are showed in the bar plot of each disease state in each tissue. Each row represents a significant GO biological process which is colored according to the -log10(p.adjust). |
| Page: 1 2 3 4 5 6 7 8 9 |
| GO ID | Tissue | Disease Stage | Description | Gene Ratio | Bg Ratio | pvalue | p.adjust | Count |
| Page: 1 |
| Pathway ID | Tissue | Disease Stage | Description | Gene Ratio | Bg Ratio | pvalue | p.adjust | qvalue | Count |
| Page: 1 |
Top |
Cell-cell communication analysis |
| Identification of potential cell-cell interactions between two cell types and their ligand-receptor pairs for different disease states |
| Ligand | Receptor | LRpair | Pathway | Tissue | Disease Stage |
| Page: 1 |
Top |
Single-cell gene regulatory network inference analysis |
| Find out the significant the regulons (TFs) and the target genes of each regulon across cell types for different disease states |
| TF | Cell Type | Tissue | Disease Stage | Target Gene | RSS | Regulon Activity |
| ∗The dot plots of a searched regulon are shown for all cell subpopulations in each disease state of each tissue based on the regulon specific score inferred using pySCENIC and by calculating the average expression. |
| Page: 1 |
Top |
Somatic mutation of malignant transformation related genes |
| Annotation of somatic variants for genes involved in malignant transformation |
| Hugo Symbol | Variant Class | Variant Classification | dbSNP RS | HGVSc | HGVSp | HGVSp Short | SWISSPROT | BIOTYPE | SIFT | PolyPhen | Tumor Sample Barcode | Tissue | Histology | Sex | Age | Stage | Therapy Types | Drugs | Outcome |
| TCEAL8 | SNV | Missense_Mutation | novel | c.262N>A | p.Glu88Lys | p.E88K | Q8IYN2 | protein_coding | deleterious(0) | probably_damaging(0.992) | TCGA-AC-A23G-01 | Breast | breast invasive carcinoma | Female | >=65 | I/II | Chemotherapy | cytoxan | CR |
| TCEAL8 | insertion | Frame_Shift_Ins | novel | c.18_19insTTGAAAAATAGACCTG | p.Glu7LeufsTer8 | p.E7Lfs*8 | Q8IYN2 | protein_coding | TCGA-AR-A0U0-01 | Breast | breast invasive carcinoma | Female | >=65 | I/II | Unknown | Unknown | SD | ||
| TCEAL8 | SNV | Missense_Mutation | c.317N>T | p.Ser106Leu | p.S106L | Q8IYN2 | protein_coding | deleterious(0) | probably_damaging(0.995) | TCGA-CA-6719-01 | Colorectum | colon adenocarcinoma | Male | >=65 | I/II | Unknown | Unknown | PD | |
| TCEAL8 | SNV | Missense_Mutation | novel | c.130C>A | p.Gln44Lys | p.Q44K | Q8IYN2 | protein_coding | tolerated(0.06) | benign(0.067) | TCGA-A5-A0G1-01 | Endometrium | uterine corpus endometrioid carcinoma | Female | >=65 | I/II | Unknown | Unknown | SD |
| TCEAL8 | SNV | Missense_Mutation | novel | c.297N>A | p.Met99Ile | p.M99I | Q8IYN2 | protein_coding | deleterious(0.03) | probably_damaging(0.95) | TCGA-AJ-A3EK-01 | Endometrium | uterine corpus endometrioid carcinoma | Female | <65 | I/II | Chemotherapy | carboplatin | CR |
| TCEAL8 | SNV | Missense_Mutation | novel | c.262N>A | p.Glu88Lys | p.E88K | Q8IYN2 | protein_coding | deleterious(0) | probably_damaging(0.992) | TCGA-AJ-A3TW-01 | Endometrium | uterine corpus endometrioid carcinoma | Female | >=65 | I/II | Unknown | Unknown | SD |
| TCEAL8 | SNV | Missense_Mutation | novel | c.244C>T | p.Leu82Phe | p.L82F | Q8IYN2 | protein_coding | deleterious(0.01) | possibly_damaging(0.709) | TCGA-AX-A2HD-01 | Endometrium | uterine corpus endometrioid carcinoma | Female | >=65 | III/IV | Unknown | Unknown | SD |
| TCEAL8 | SNV | Missense_Mutation | c.340N>C | p.Cys114Arg | p.C114R | Q8IYN2 | protein_coding | deleterious(0) | probably_damaging(0.99) | TCGA-B5-A11E-01 | Endometrium | uterine corpus endometrioid carcinoma | Female | <65 | I/II | Unknown | Unknown | SD | |
| TCEAL8 | SNV | Missense_Mutation | c.51N>T | p.Lys17Asn | p.K17N | Q8IYN2 | protein_coding | deleterious(0.01) | benign(0.366) | TCGA-B5-A11E-01 | Endometrium | uterine corpus endometrioid carcinoma | Female | <65 | I/II | Unknown | Unknown | SD | |
| TCEAL8 | SNV | Missense_Mutation | rs770282422 | c.115N>A | p.Glu39Lys | p.E39K | Q8IYN2 | protein_coding | tolerated(0.68) | benign(0.011) | TCGA-E6-A1LX-01 | Endometrium | uterine corpus endometrioid carcinoma | Female | <65 | I/II | Unknown | Unknown | SD |
| Page: 1 2 |
Top |
Related drugs of malignant transformation related genes |
| Identification of chemicals and drugs interact with genes involved in malignant transfromation |
| (DGIdb 4.0) |
| Entrez ID | Symbol | Category | Interaction Types | Drug Claim Name | Drug Name | PMIDs |
| Page: 1 |

Copyright 2023-Present -The University of Texas Health Science Center at Houston |