
|
|||||
|
 | |
| |
| |
| |
| |
| |
|
Gene: TCEAL4 |
Gene summary for TCEAL4 |
| Gene information | Species | Human | Gene symbol | TCEAL4 | Gene ID | 79921 |
| Gene name | transcription elongation factor A like 4 | |
| Gene Alias | NPD017 | |
| Cytomap | Xq22.2 | |
| Gene Type | protein-coding | GO ID | GO:0005575 | UniProtAcc | Q96EI5 |
Top |
Malignant transformation analysis |
| Identification of the aberrant gene expression in precancerous and cancerous lesions by comparing the gene expression of stem-like cells in diseased tissues with normal stem cells |
| Entrez ID | Symbol | Replicates | Species | Organ | Tissue | Adj P-value | Log2FC | Malignancy |
| 79921 | TCEAL4 | GSM4909285 | Human | Breast | IDC | 6.20e-06 | 1.73e-01 | 0.21 |
| 79921 | TCEAL4 | GSM4909286 | Human | Breast | IDC | 4.03e-02 | -1.55e-01 | 0.1081 |
| 79921 | TCEAL4 | GSM4909293 | Human | Breast | IDC | 1.36e-05 | 3.36e-01 | 0.1581 |
| 79921 | TCEAL4 | GSM4909296 | Human | Breast | IDC | 2.19e-07 | 8.84e-02 | 0.1524 |
| 79921 | TCEAL4 | GSM4909297 | Human | Breast | IDC | 4.61e-20 | 3.60e-01 | 0.1517 |
| 79921 | TCEAL4 | GSM4909298 | Human | Breast | IDC | 2.09e-04 | 2.71e-01 | 0.1551 |
| 79921 | TCEAL4 | GSM4909301 | Human | Breast | IDC | 4.32e-48 | 9.27e-01 | 0.1577 |
| 79921 | TCEAL4 | GSM4909302 | Human | Breast | IDC | 5.08e-08 | 3.21e-01 | 0.1545 |
| 79921 | TCEAL4 | GSM4909304 | Human | Breast | IDC | 9.61e-06 | 3.03e-01 | 0.1636 |
| 79921 | TCEAL4 | GSM4909306 | Human | Breast | IDC | 6.44e-51 | 1.05e+00 | 0.1564 |
| 79921 | TCEAL4 | GSM4909307 | Human | Breast | IDC | 8.04e-04 | 3.35e-01 | 0.1569 |
| 79921 | TCEAL4 | GSM4909308 | Human | Breast | IDC | 2.23e-12 | 4.23e-01 | 0.158 |
| 79921 | TCEAL4 | GSM4909311 | Human | Breast | IDC | 1.81e-26 | -9.01e-03 | 0.1534 |
| 79921 | TCEAL4 | GSM4909312 | Human | Breast | IDC | 9.09e-10 | 9.41e-02 | 0.1552 |
| 79921 | TCEAL4 | GSM4909313 | Human | Breast | IDC | 4.72e-06 | 2.51e-01 | 0.0391 |
| 79921 | TCEAL4 | GSM4909319 | Human | Breast | IDC | 1.73e-45 | 3.30e-01 | 0.1563 |
| 79921 | TCEAL4 | GSM4909320 | Human | Breast | IDC | 3.54e-08 | 1.10e-01 | 0.1575 |
| 79921 | TCEAL4 | GSM4909321 | Human | Breast | IDC | 6.10e-09 | -1.95e-02 | 0.1559 |
| 79921 | TCEAL4 | brca2 | Human | Breast | Precancer | 8.35e-07 | 2.57e-01 | -0.024 |
| 79921 | TCEAL4 | brca3 | Human | Breast | Precancer | 5.87e-04 | 1.66e-01 | -0.0263 |
| Page: 1 2 3 4 5 6 7 8 9 10 |
| Tissue | Expression Dynamics | Abbreviation |
| Breast | 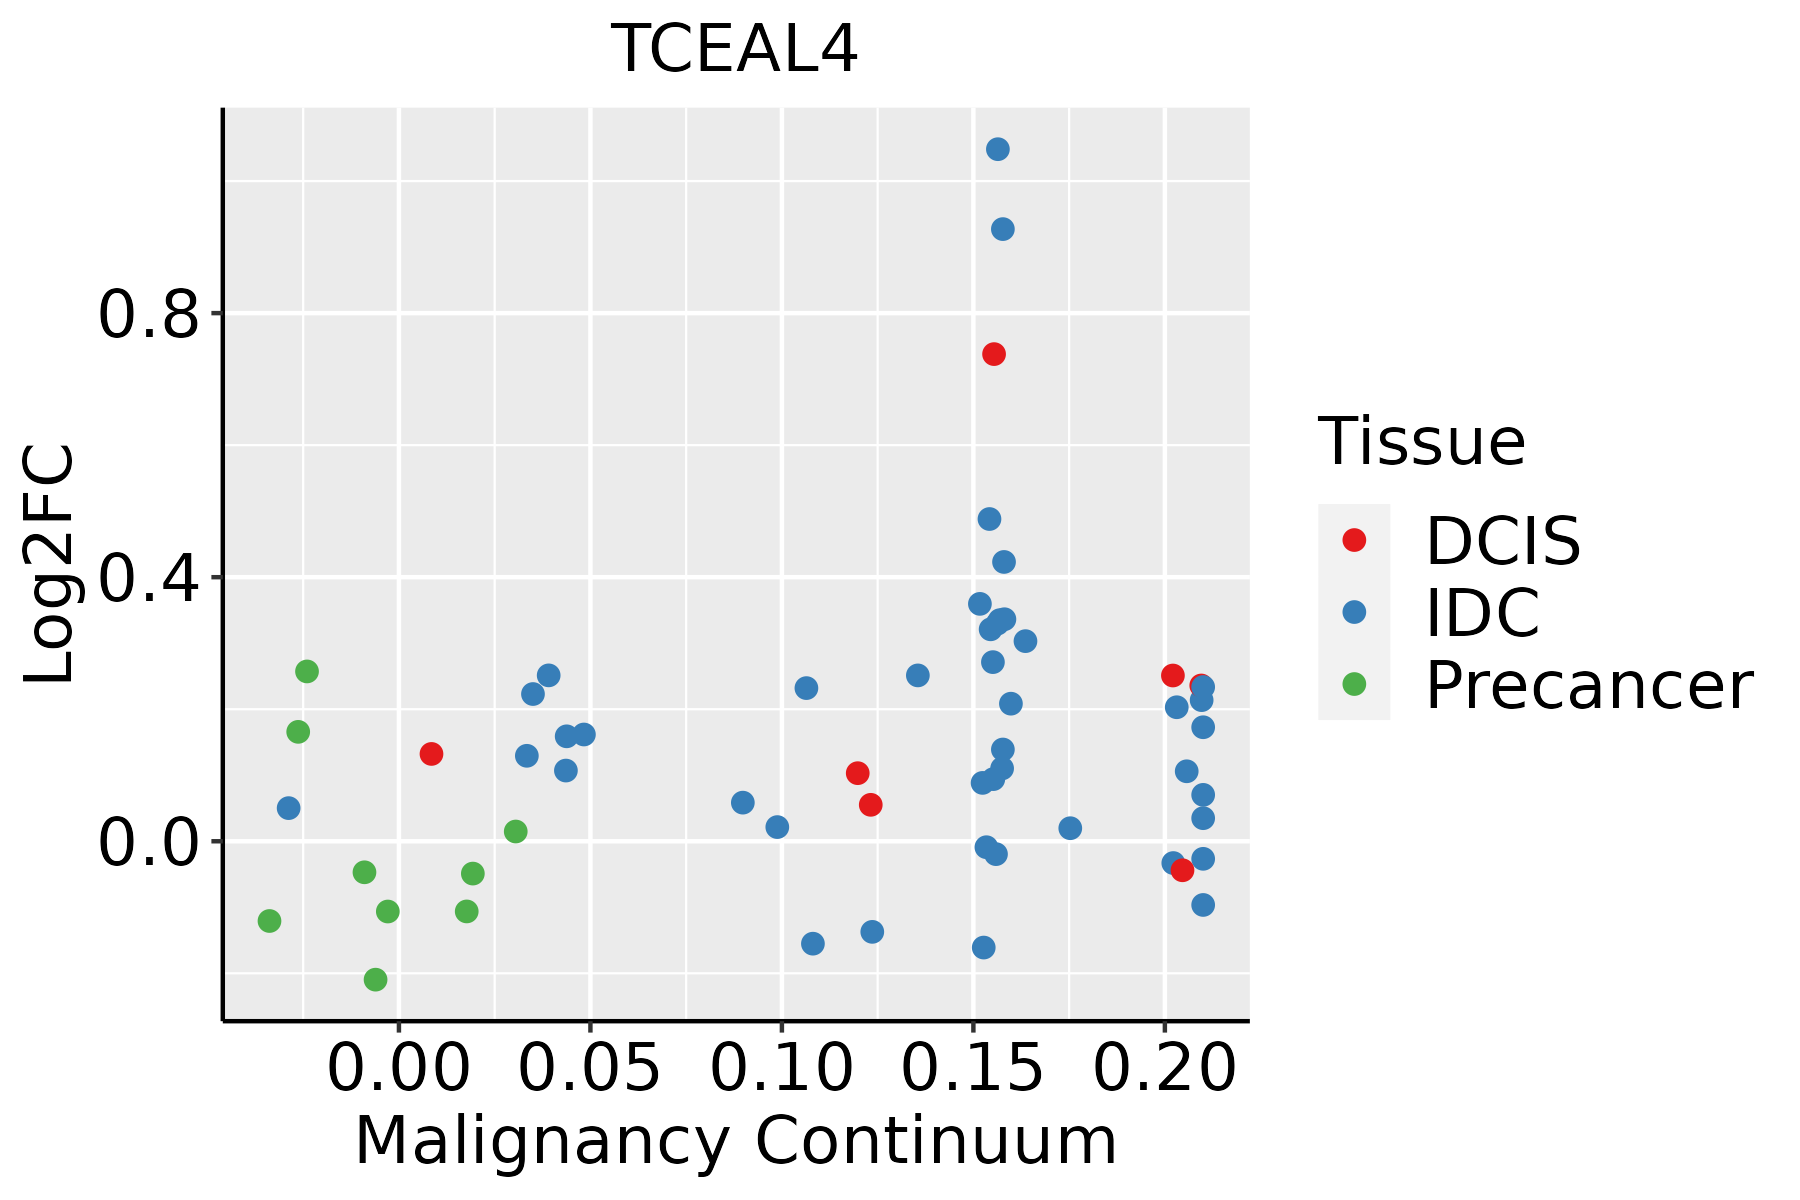 | IDC: Invasive ductal carcinoma |
| DCIS: Ductal carcinoma in situ | ||
| Precancer(BRCA1-mut): Precancerous lesion from BRCA1 mutation carriers | ||
| Endometrium | 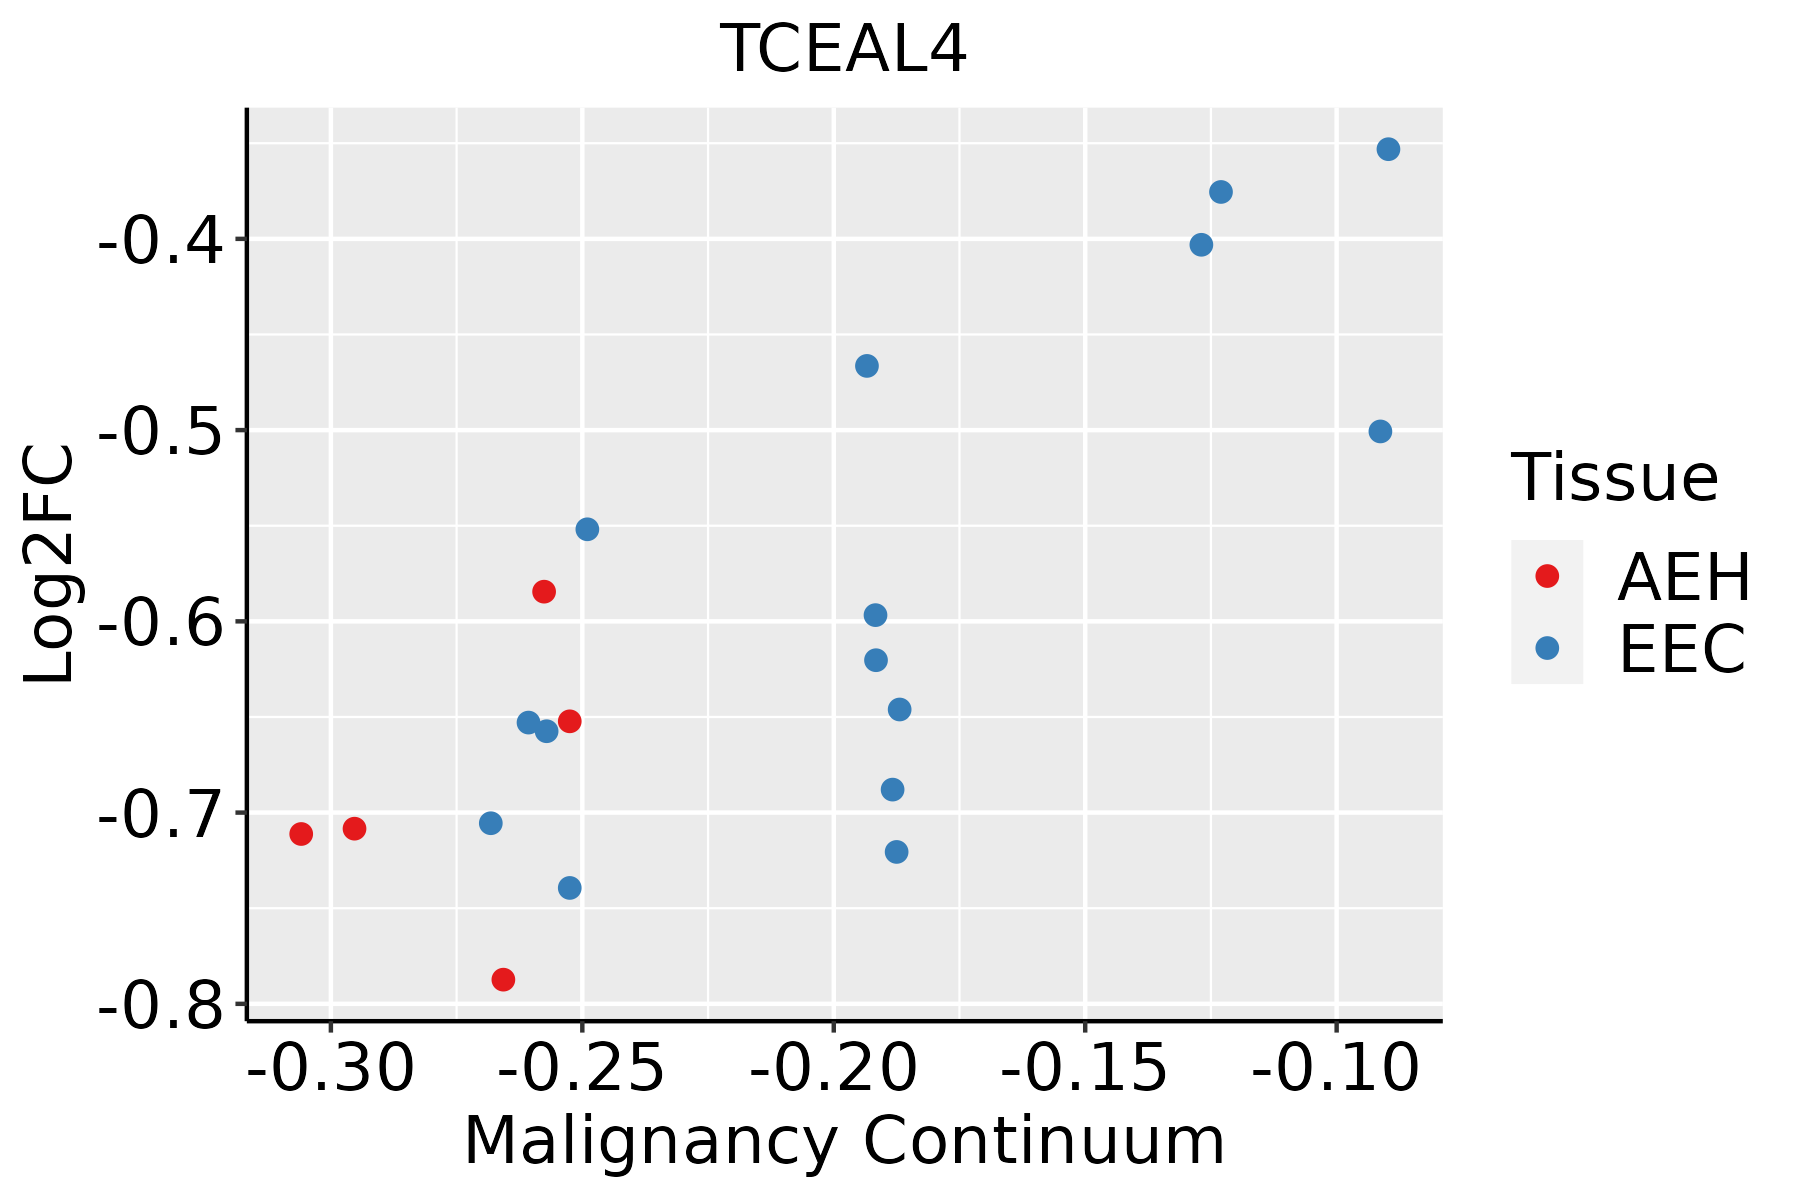 | AEH: Atypical endometrial hyperplasia |
| EEC: Endometrioid Cancer | ||
| Esophagus |  | ESCC: Esophageal squamous cell carcinoma |
| HGIN: High-grade intraepithelial neoplasias | ||
| LGIN: Low-grade intraepithelial neoplasias | ||
| Liver |  | HCC: Hepatocellular carcinoma |
| NAFLD: Non-alcoholic fatty liver disease | ||
| Oral Cavity | 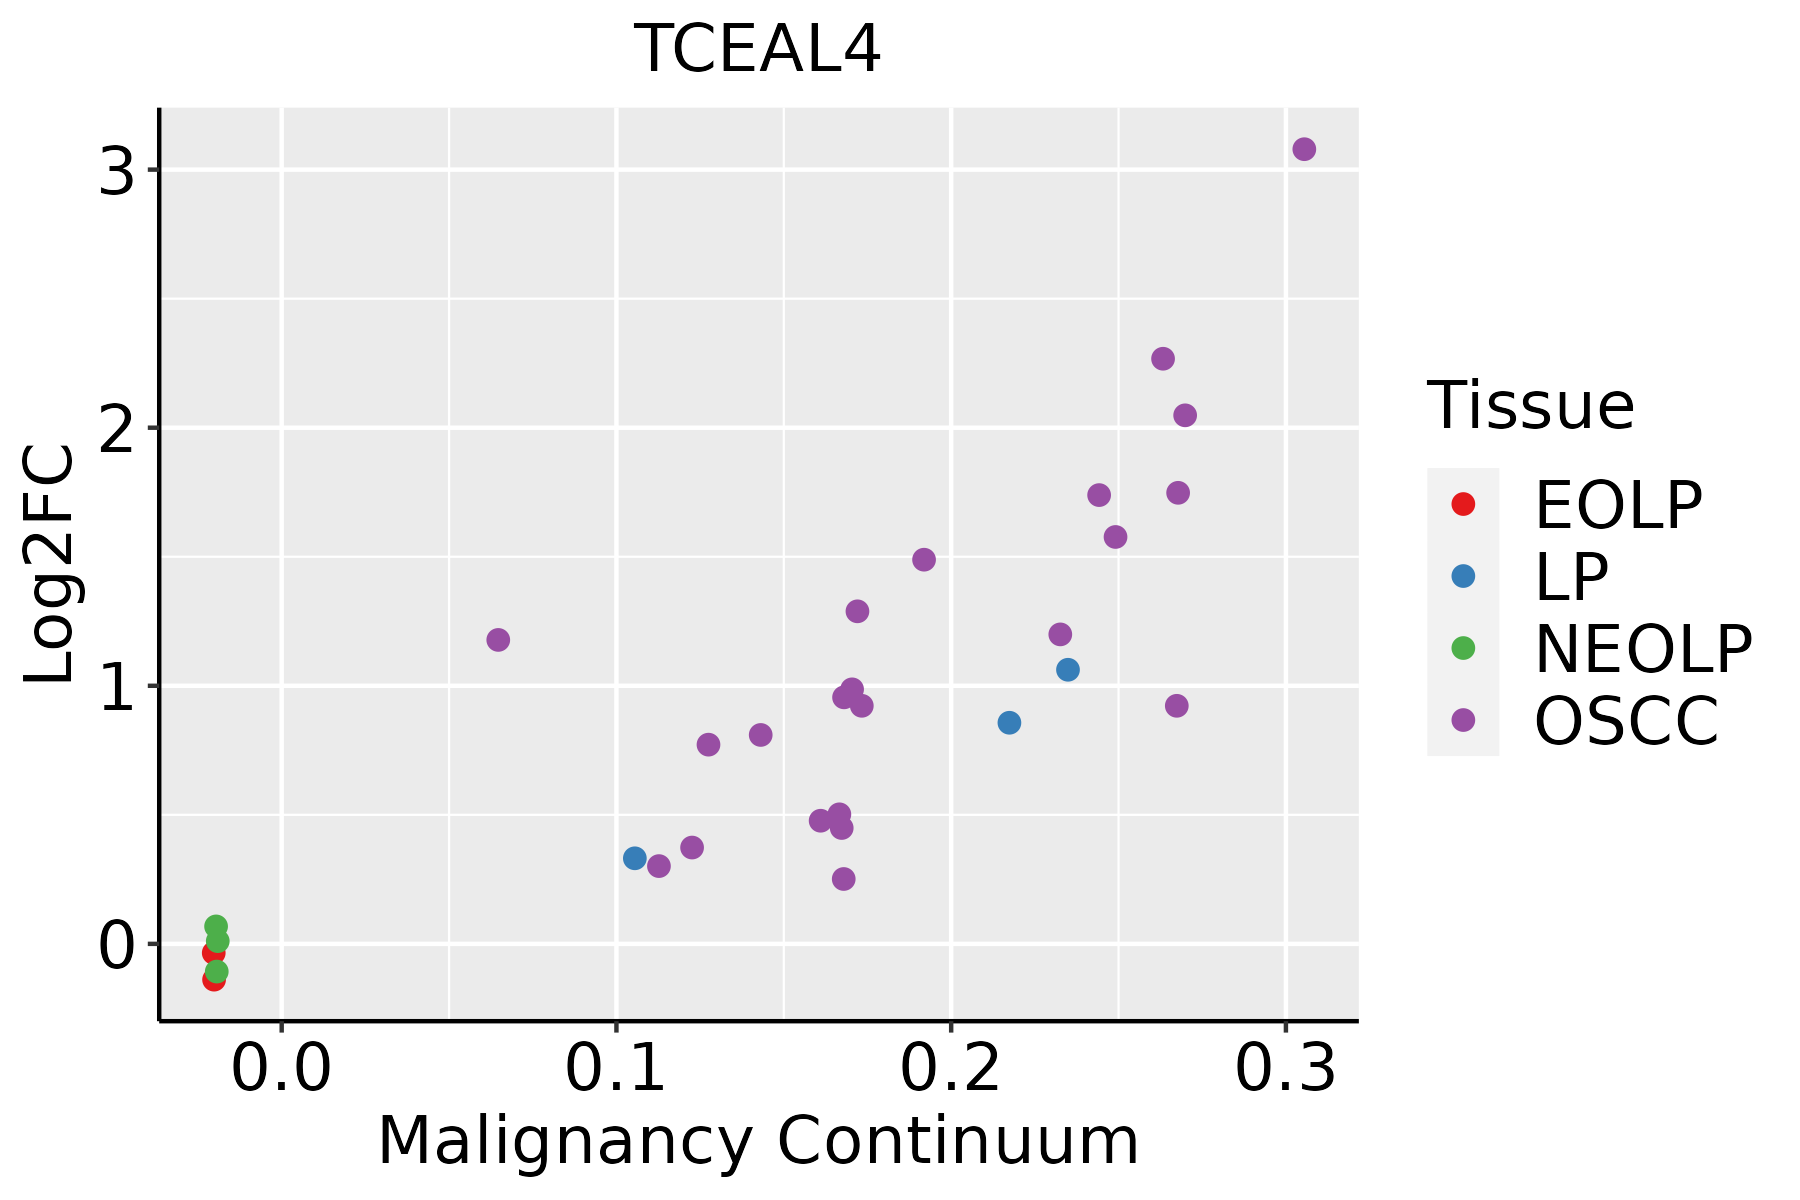 | EOLP: Erosive Oral lichen planus |
| LP: leukoplakia | ||
| NEOLP: Non-erosive oral lichen planus | ||
| OSCC: Oral squamous cell carcinoma | ||
| Prostate | 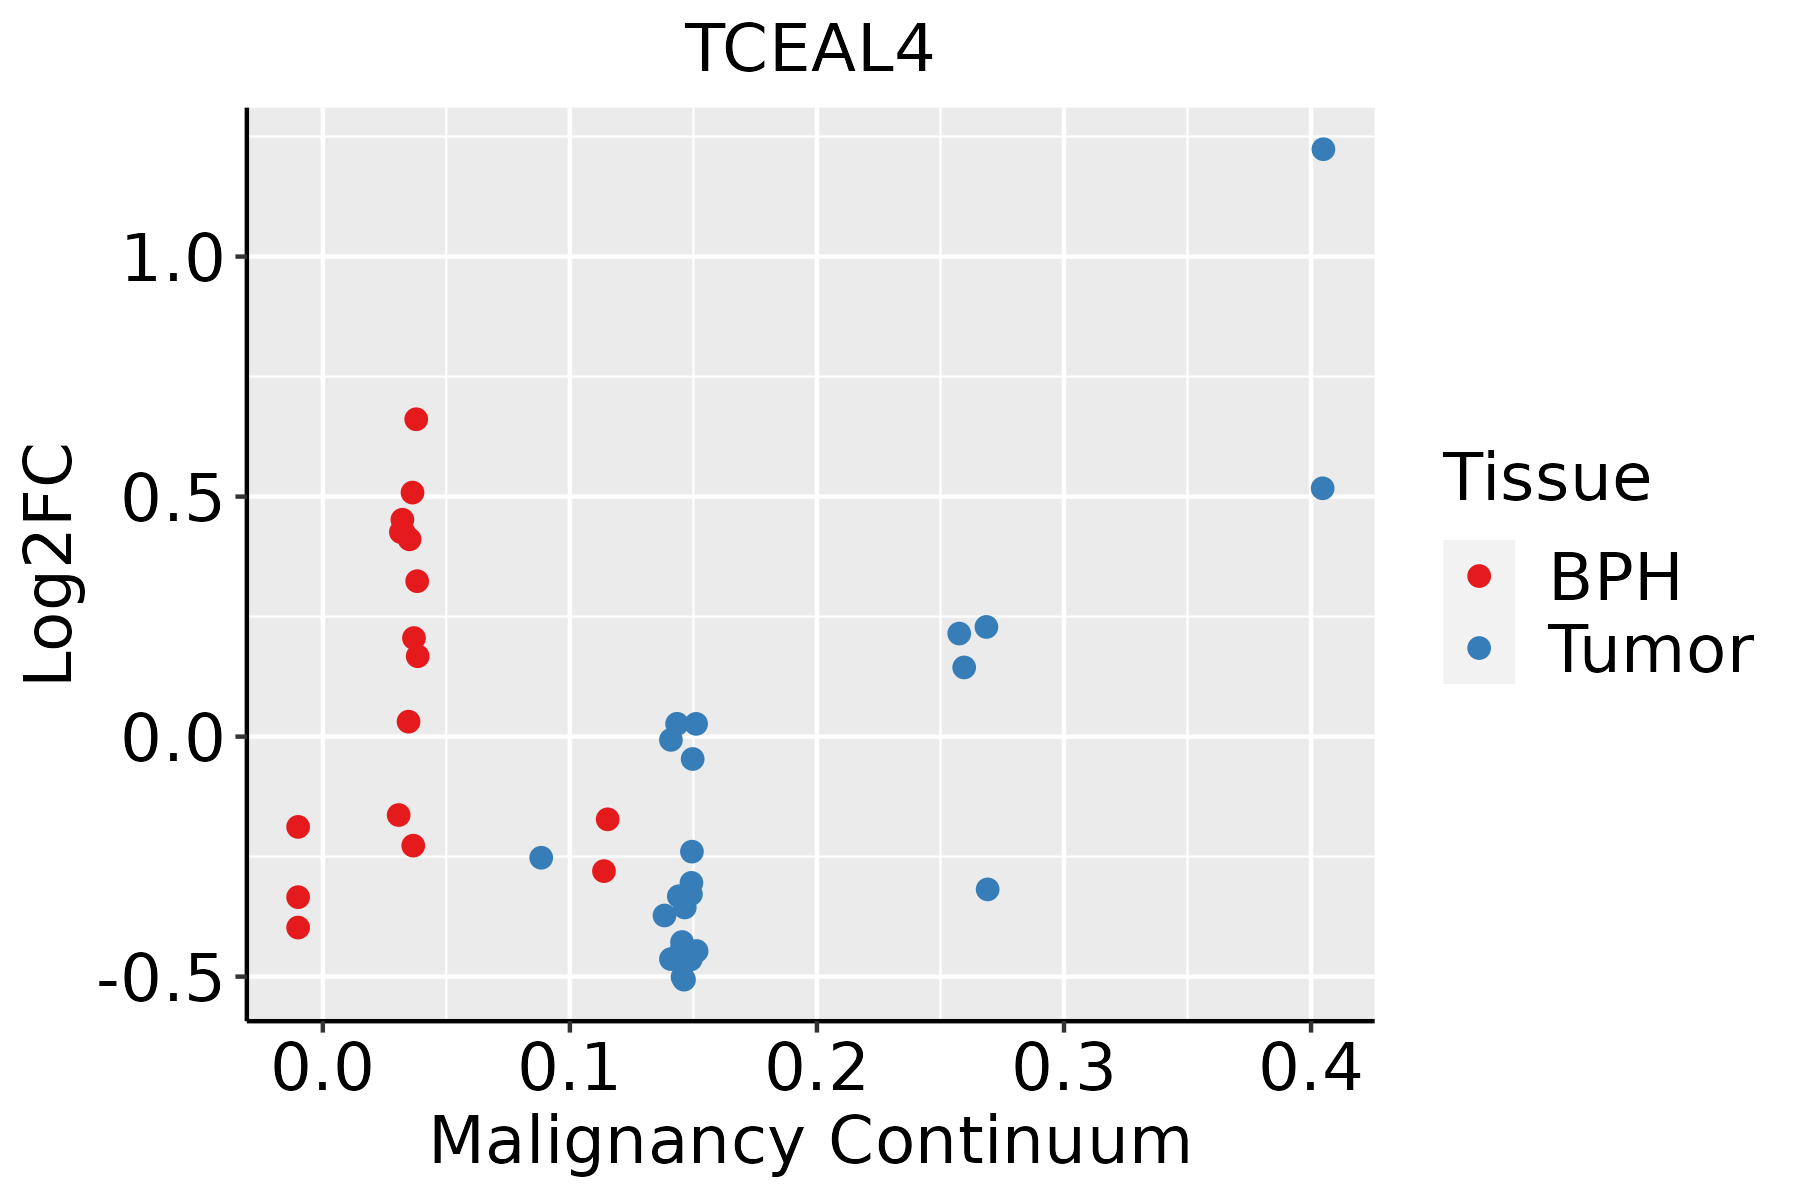 | BPH: Benign Prostatic Hyperplasia |
| Skin |  | AK: Actinic keratosis |
| cSCC: Cutaneous squamous cell carcinoma | ||
| SCCIS:squamous cell carcinoma in situ | ||
| Thyroid | 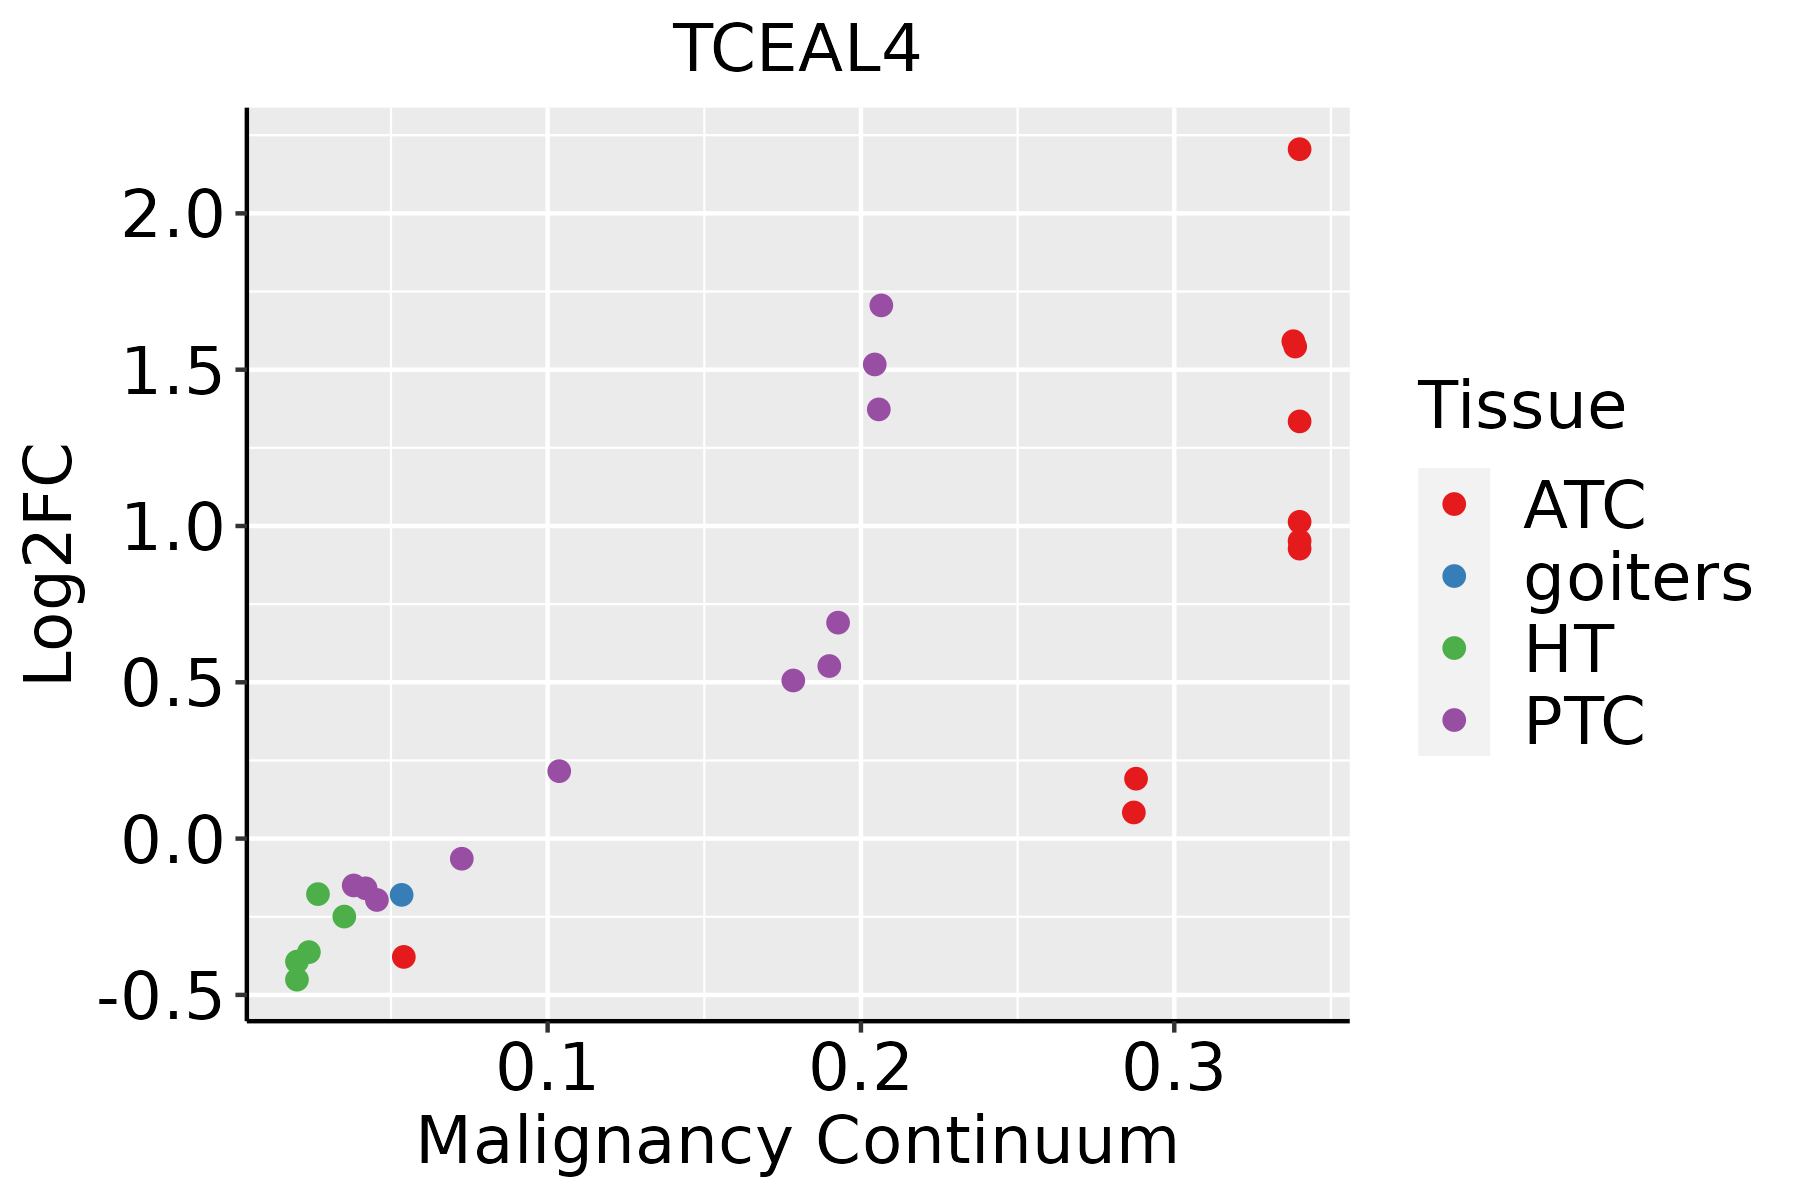 | ATC: Anaplastic thyroid cancer |
| HT: Hashimoto's thyroiditis | ||
| PTC: Papillary thyroid cancer |
| ∗log2FC in expression of this searched gene in stem-like cells from each diseased tissue sample relative to stem-like cells in normal samples in each tissue plotted against the malignancy continuum. Samples are colored based on if they are from different disease stage. |
Top |
Malignant transformation related pathway analysis |
| Find out the enriched GO biological processes and KEGG pathways involved in transition from healthy to precancer to cancer |
| Tissue | Disease Stage | Enriched GO biological Processes |
| Colorectum | AD |  |
| Colorectum | SER |  |
| Colorectum | MSS |  |
| Colorectum | MSI-H |  |
| Colorectum | FAP |  |
| ∗Top 15 enriched GO BP terms are showed in the bar plot of each disease state in each tissue. Each row represents a significant GO biological process which is colored according to the -log10(p.adjust). |
| Page: 1 2 3 4 5 6 7 8 9 |
| GO ID | Tissue | Disease Stage | Description | Gene Ratio | Bg Ratio | pvalue | p.adjust | Count |
| Page: 1 |
| Pathway ID | Tissue | Disease Stage | Description | Gene Ratio | Bg Ratio | pvalue | p.adjust | qvalue | Count |
| Page: 1 |
Top |
Cell-cell communication analysis |
| Identification of potential cell-cell interactions between two cell types and their ligand-receptor pairs for different disease states |
| Ligand | Receptor | LRpair | Pathway | Tissue | Disease Stage |
| Page: 1 |
Top |
Single-cell gene regulatory network inference analysis |
| Find out the significant the regulons (TFs) and the target genes of each regulon across cell types for different disease states |
| TF | Cell Type | Tissue | Disease Stage | Target Gene | RSS | Regulon Activity |
| ∗The dot plots of a searched regulon are shown for all cell subpopulations in each disease state of each tissue based on the regulon specific score inferred using pySCENIC and by calculating the average expression. |
| Page: 1 |
Top |
Somatic mutation of malignant transformation related genes |
| Annotation of somatic variants for genes involved in malignant transformation |
| Hugo Symbol | Variant Class | Variant Classification | dbSNP RS | HGVSc | HGVSp | HGVSp Short | SWISSPROT | BIOTYPE | SIFT | PolyPhen | Tumor Sample Barcode | Tissue | Histology | Sex | Age | Stage | Therapy Types | Drugs | Outcome |
| TCEAL4 | SNV | Missense_Mutation | novel | c.347C>A | p.Ser116Tyr | p.S116Y | Q96EI5 | protein_coding | deleterious_low_confidence(0) | possibly_damaging(0.811) | TCGA-C5-A8XH-01 | Cervix | cervical & endocervical cancer | Female | <65 | I/II | Unknown | Unknown | SD |
| TCEAL4 | SNV | Missense_Mutation | novel | c.512N>A | p.Arg171Lys | p.R171K | Q96EI5 | protein_coding | tolerated_low_confidence(0.32) | benign(0.074) | TCGA-VS-A9UL-01 | Cervix | cervical & endocervical cancer | Female | >=65 | III/IV | Unknown | Unknown | PD |
| TCEAL4 | SNV | Missense_Mutation | rs200167143 | c.730N>C | p.Glu244Gln | p.E244Q | Q96EI5 | protein_coding | deleterious(0.04) | possibly_damaging(0.656) | TCGA-VS-A9UZ-01 | Cervix | cervical & endocervical cancer | Female | <65 | I/II | Unknown | Unknown | SD |
| TCEAL4 | SNV | Missense_Mutation | novel | c.322N>A | p.Leu108Met | p.L108M | Q96EI5 | protein_coding | deleterious_low_confidence(0.01) | possibly_damaging(0.645) | TCGA-5M-AAT5-01 | Colorectum | colon adenocarcinoma | Unknown | Unknown | I/II | Unknown | Unknown | Unknown |
| TCEAL4 | SNV | Missense_Mutation | c.173N>A | p.Ser58Tyr | p.S58Y | Q96EI5 | protein_coding | deleterious_low_confidence(0) | benign(0.149) | TCGA-AA-3510-01 | Colorectum | colon adenocarcinoma | Male | >=65 | I/II | Unknown | Unknown | SD | |
| TCEAL4 | SNV | Missense_Mutation | c.494N>G | p.Glu165Gly | p.E165G | Q96EI5 | protein_coding | tolerated_low_confidence(0.28) | benign(0.146) | TCGA-AA-3663-01 | Colorectum | colon adenocarcinoma | Male | <65 | I/II | Unknown | Unknown | SD | |
| TCEAL4 | SNV | Missense_Mutation | c.936N>T | p.Lys312Asn | p.K312N | Q96EI5 | protein_coding | tolerated_low_confidence(0.31) | possibly_damaging(0.627) | TCGA-AA-3715-01 | Colorectum | colon adenocarcinoma | Male | >=65 | I/II | Unknown | Unknown | PD | |
| TCEAL4 | SNV | Missense_Mutation | c.145N>T | p.Arg49Trp | p.R49W | Q96EI5 | protein_coding | tolerated_low_confidence(0.24) | benign(0) | TCGA-AA-3811-01 | Colorectum | colon adenocarcinoma | Female | >=65 | III/IV | Unknown | Unknown | PD | |
| TCEAL4 | SNV | Missense_Mutation | c.397N>A | p.Val133Met | p.V133M | Q96EI5 | protein_coding | tolerated_low_confidence(0.49) | benign(0.001) | TCGA-AA-3952-01 | Colorectum | colon adenocarcinoma | Male | >=65 | III/IV | Unknown | Unknown | PD | |
| TCEAL4 | SNV | Missense_Mutation | c.595N>A | p.Glu199Lys | p.E199K | Q96EI5 | protein_coding | tolerated(0.13) | possibly_damaging(0.776) | TCGA-AA-A010-01 | Colorectum | colon adenocarcinoma | Female | <65 | I/II | Chemotherapy | folinic | CR |
| Page: 1 2 3 4 5 |
Top |
Related drugs of malignant transformation related genes |
| Identification of chemicals and drugs interact with genes involved in malignant transfromation |
| (DGIdb 4.0) |
| Entrez ID | Symbol | Category | Interaction Types | Drug Claim Name | Drug Name | PMIDs |
| Page: 1 |

Copyright 2023-Present -The University of Texas Health Science Center at Houston |