
|
|||||
|
 | |
| |
| |
| |
| |
| |
|
Gene: TCEAL3 |
Gene summary for TCEAL3 |
| Gene information | Species | Human | Gene symbol | TCEAL3 | Gene ID | 85012 |
| Gene name | transcription elongation factor A like 3 | |
| Gene Alias | WEX8 | |
| Cytomap | Xq22.2 | |
| Gene Type | protein-coding | GO ID | GO:0005575 | UniProtAcc | Q969E4 |
Top |
Malignant transformation analysis |
| Identification of the aberrant gene expression in precancerous and cancerous lesions by comparing the gene expression of stem-like cells in diseased tissues with normal stem cells |
| Entrez ID | Symbol | Replicates | Species | Organ | Tissue | Adj P-value | Log2FC | Malignancy |
| 85012 | TCEAL3 | GSM4909293 | Human | Breast | IDC | 1.92e-08 | 3.37e-01 | 0.1581 |
| 85012 | TCEAL3 | GSM4909296 | Human | Breast | IDC | 1.41e-03 | -8.71e-02 | 0.1524 |
| 85012 | TCEAL3 | GSM4909297 | Human | Breast | IDC | 1.20e-09 | 2.49e-01 | 0.1517 |
| 85012 | TCEAL3 | GSM4909301 | Human | Breast | IDC | 1.34e-44 | 9.13e-01 | 0.1577 |
| 85012 | TCEAL3 | GSM4909306 | Human | Breast | IDC | 1.15e-36 | 8.35e-01 | 0.1564 |
| 85012 | TCEAL3 | GSM4909307 | Human | Breast | IDC | 2.94e-08 | 4.00e-01 | 0.1569 |
| 85012 | TCEAL3 | GSM4909308 | Human | Breast | IDC | 2.13e-17 | 5.31e-01 | 0.158 |
| 85012 | TCEAL3 | GSM4909311 | Human | Breast | IDC | 2.08e-12 | -5.45e-02 | 0.1534 |
| 85012 | TCEAL3 | GSM4909312 | Human | Breast | IDC | 2.59e-03 | 7.18e-02 | 0.1552 |
| 85012 | TCEAL3 | GSM4909319 | Human | Breast | IDC | 1.72e-25 | 3.50e-01 | 0.1563 |
| 85012 | TCEAL3 | GSM4909321 | Human | Breast | IDC | 1.20e-03 | -1.37e-02 | 0.1559 |
| 85012 | TCEAL3 | NCCBC14 | Human | Breast | DCIS | 7.57e-05 | 2.37e-01 | 0.2021 |
| 85012 | TCEAL3 | NCCBC2 | Human | Breast | DCIS | 4.60e-08 | 5.95e-01 | 0.1554 |
| 85012 | TCEAL3 | P1 | Human | Breast | IDC | 7.64e-03 | -8.48e-02 | 0.1527 |
| 85012 | TCEAL3 | DCIS2 | Human | Breast | DCIS | 1.31e-34 | 7.25e-02 | 0.0085 |
| 85012 | TCEAL3 | LZE4T | Human | Esophagus | ESCC | 1.90e-14 | 5.38e-01 | 0.0811 |
| 85012 | TCEAL3 | LZE5T | Human | Esophagus | ESCC | 4.41e-03 | 4.92e-01 | 0.0514 |
| 85012 | TCEAL3 | LZE7T | Human | Esophagus | ESCC | 5.58e-09 | 6.29e-01 | 0.0667 |
| 85012 | TCEAL3 | LZE24T | Human | Esophagus | ESCC | 1.33e-26 | 7.55e-01 | 0.0596 |
| 85012 | TCEAL3 | LZE6T | Human | Esophagus | ESCC | 5.89e-15 | 7.87e-01 | 0.0845 |
| Page: 1 2 3 4 5 |
| Tissue | Expression Dynamics | Abbreviation |
| Breast | 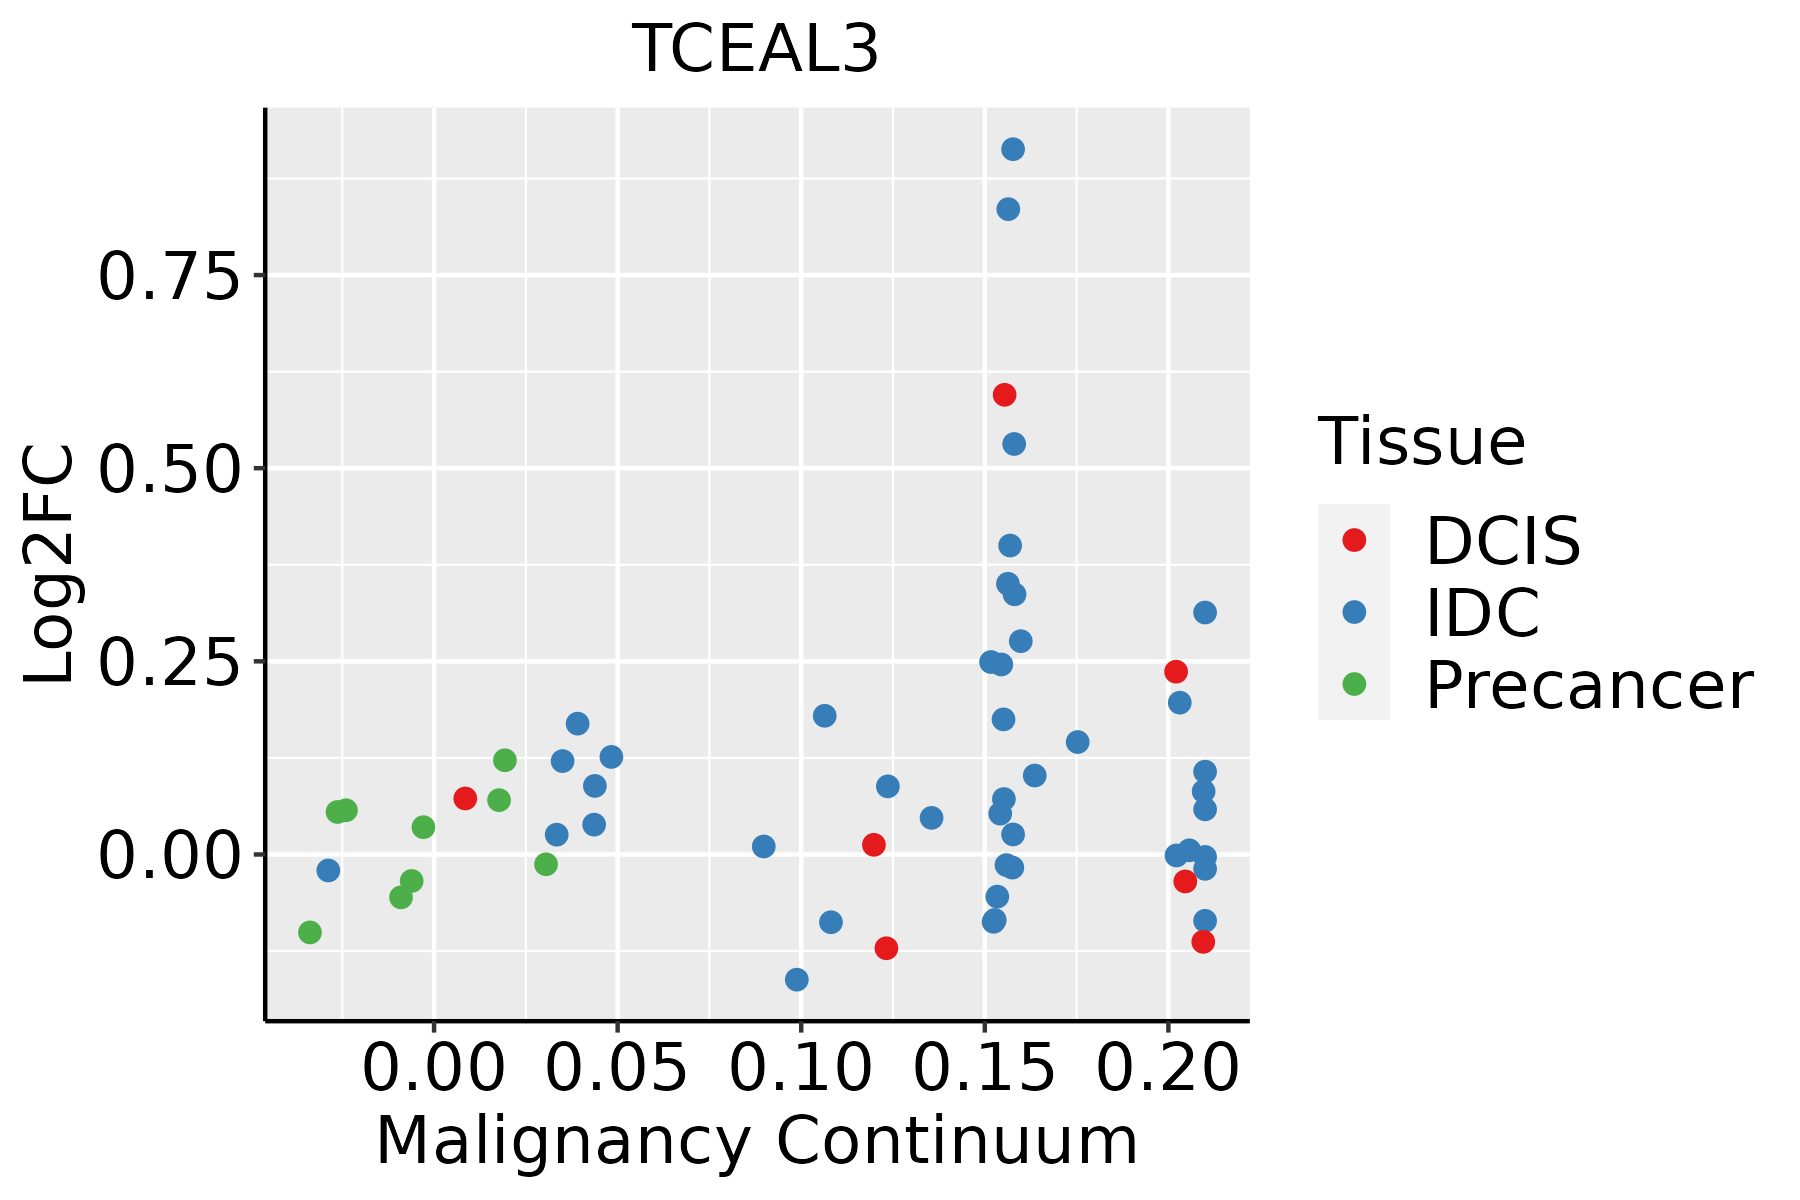 | IDC: Invasive ductal carcinoma |
| DCIS: Ductal carcinoma in situ | ||
| Precancer(BRCA1-mut): Precancerous lesion from BRCA1 mutation carriers | ||
| Esophagus |  | ESCC: Esophageal squamous cell carcinoma |
| HGIN: High-grade intraepithelial neoplasias | ||
| LGIN: Low-grade intraepithelial neoplasias | ||
| Oral Cavity | 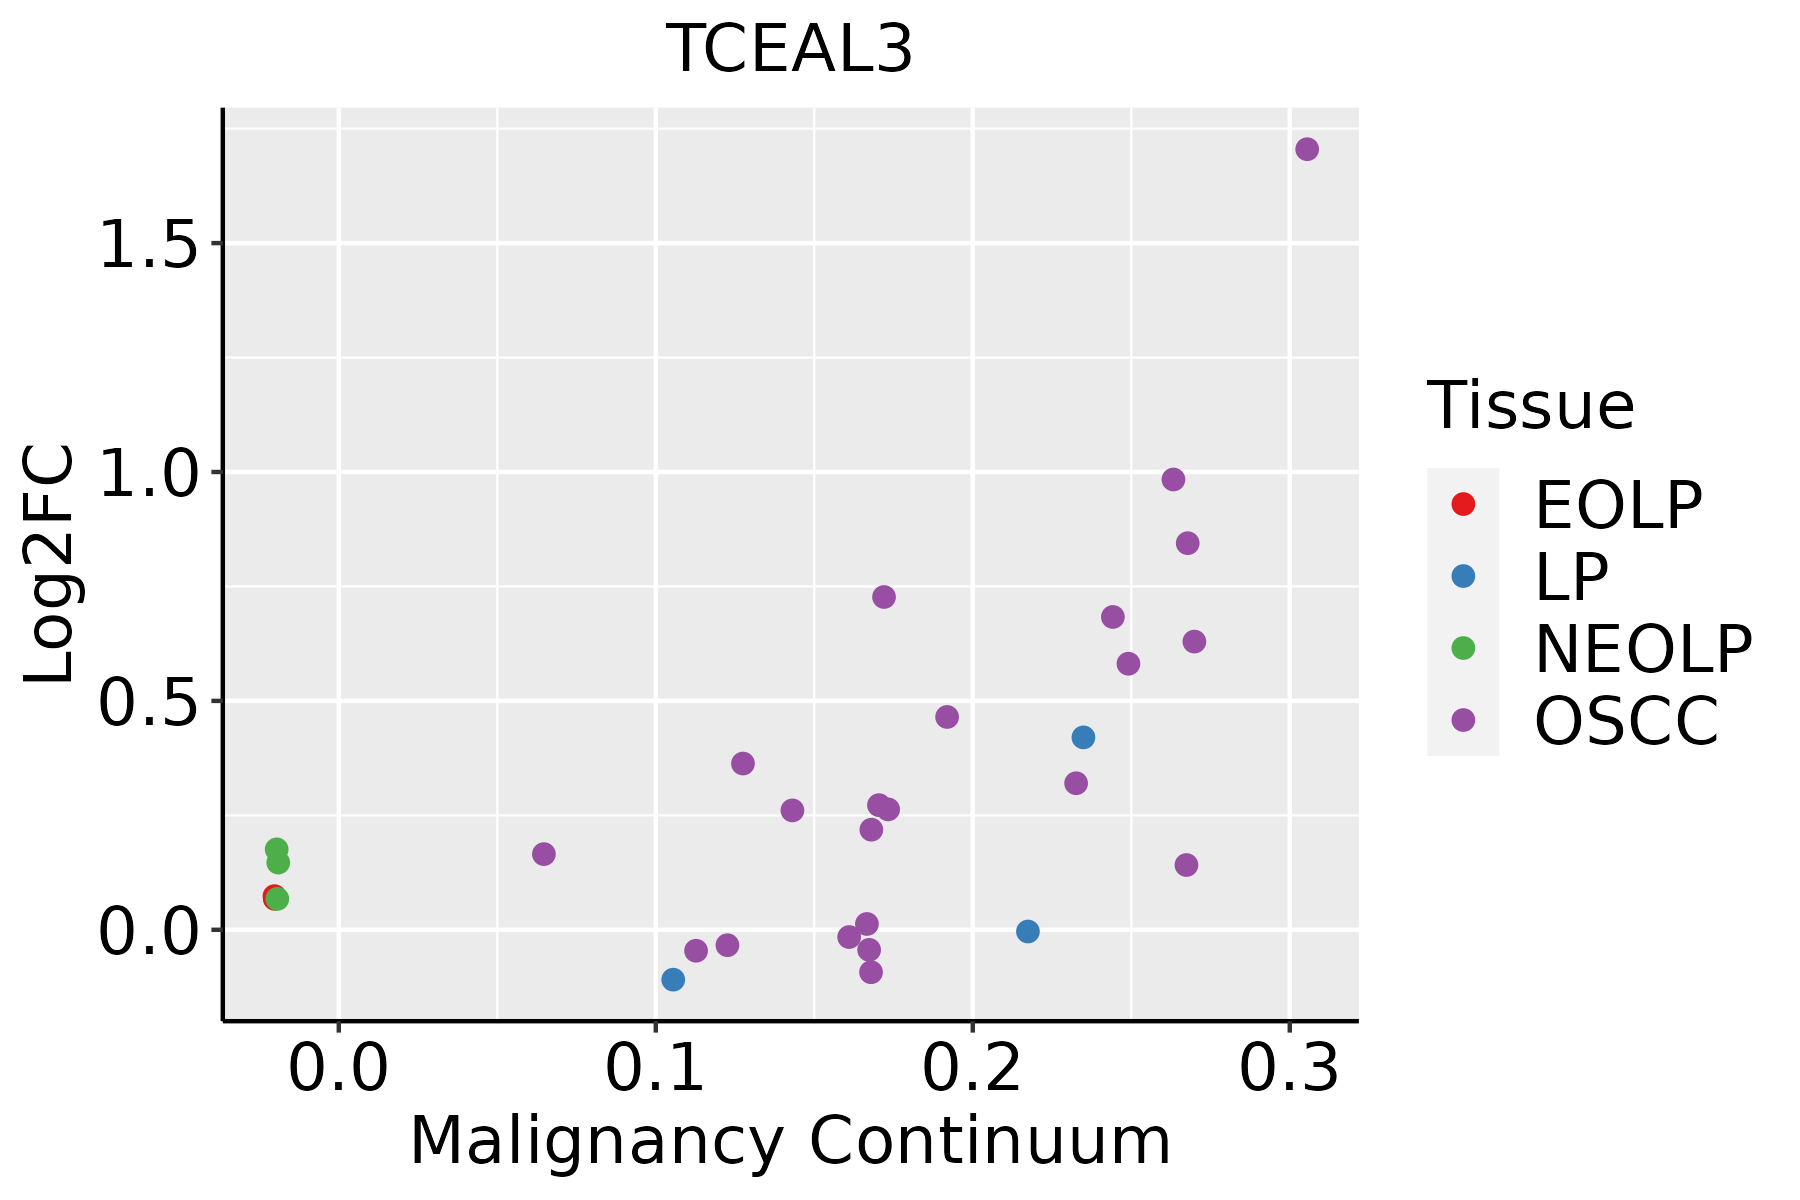 | EOLP: Erosive Oral lichen planus |
| LP: leukoplakia | ||
| NEOLP: Non-erosive oral lichen planus | ||
| OSCC: Oral squamous cell carcinoma | ||
| Thyroid | 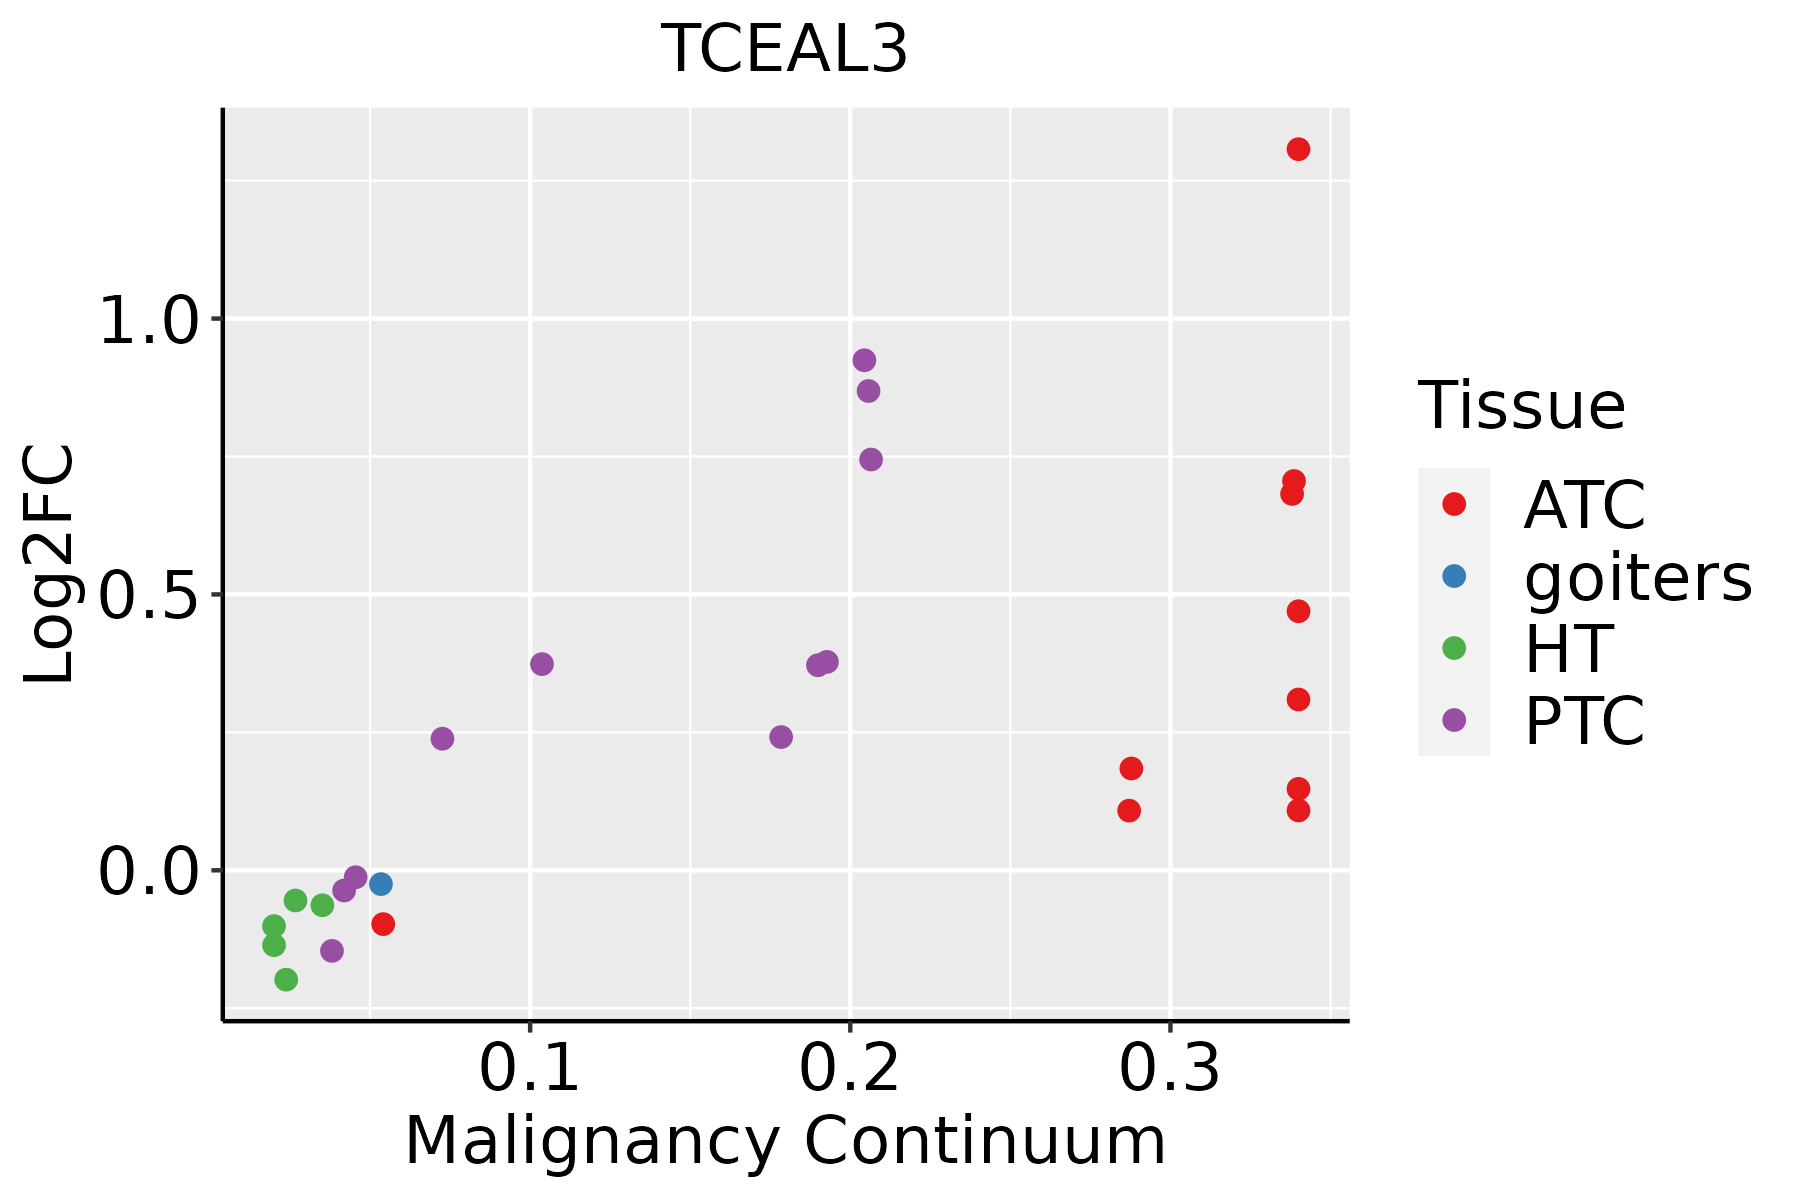 | ATC: Anaplastic thyroid cancer |
| HT: Hashimoto's thyroiditis | ||
| PTC: Papillary thyroid cancer |
| ∗log2FC in expression of this searched gene in stem-like cells from each diseased tissue sample relative to stem-like cells in normal samples in each tissue plotted against the malignancy continuum. Samples are colored based on if they are from different disease stage. |
Top |
Malignant transformation related pathway analysis |
| Find out the enriched GO biological processes and KEGG pathways involved in transition from healthy to precancer to cancer |
| Tissue | Disease Stage | Enriched GO biological Processes |
| Colorectum | AD |  |
| Colorectum | SER |  |
| Colorectum | MSS |  |
| Colorectum | MSI-H |  |
| Colorectum | FAP |  |
| ∗Top 15 enriched GO BP terms are showed in the bar plot of each disease state in each tissue. Each row represents a significant GO biological process which is colored according to the -log10(p.adjust). |
| Page: 1 2 3 4 5 6 7 8 9 |
| GO ID | Tissue | Disease Stage | Description | Gene Ratio | Bg Ratio | pvalue | p.adjust | Count |
| Page: 1 |
| Pathway ID | Tissue | Disease Stage | Description | Gene Ratio | Bg Ratio | pvalue | p.adjust | qvalue | Count |
| Page: 1 |
Top |
Cell-cell communication analysis |
| Identification of potential cell-cell interactions between two cell types and their ligand-receptor pairs for different disease states |
| Ligand | Receptor | LRpair | Pathway | Tissue | Disease Stage |
| Page: 1 |
Top |
Single-cell gene regulatory network inference analysis |
| Find out the significant the regulons (TFs) and the target genes of each regulon across cell types for different disease states |
| TF | Cell Type | Tissue | Disease Stage | Target Gene | RSS | Regulon Activity |
| ∗The dot plots of a searched regulon are shown for all cell subpopulations in each disease state of each tissue based on the regulon specific score inferred using pySCENIC and by calculating the average expression. |
| Page: 1 |
Top |
Somatic mutation of malignant transformation related genes |
| Annotation of somatic variants for genes involved in malignant transformation |
| Hugo Symbol | Variant Class | Variant Classification | dbSNP RS | HGVSc | HGVSp | HGVSp Short | SWISSPROT | BIOTYPE | SIFT | PolyPhen | Tumor Sample Barcode | Tissue | Histology | Sex | Age | Stage | Therapy Types | Drugs | Outcome |
| TCEAL3 | SNV | Missense_Mutation | c.58N>C | p.Asp20His | p.D20H | Q969E4 | protein_coding | deleterious(0.01) | possibly_damaging(0.657) | TCGA-A2-A0YK-01 | Breast | breast invasive carcinoma | Female | <65 | I/II | Chemotherapy | cytoxan | SD | |
| TCEAL3 | SNV | Missense_Mutation | c.451N>C | p.Glu151Gln | p.E151Q | Q969E4 | protein_coding | deleterious(0.03) | possibly_damaging(0.835) | TCGA-AC-A23H-01 | Breast | breast invasive carcinoma | Female | >=65 | I/II | Unknown | Unknown | PD | |
| TCEAL3 | SNV | Missense_Mutation | c.244N>A | p.Gly82Ser | p.G82S | Q969E4 | protein_coding | tolerated(0.07) | benign(0.123) | TCGA-E2-A1LS-01 | Breast | breast invasive carcinoma | Female | <65 | I/II | Unspecific | Cyclophosphamide | SD | |
| TCEAL3 | SNV | Missense_Mutation | novel | c.271N>C | p.Glu91Gln | p.E91Q | Q969E4 | protein_coding | tolerated(0.07) | probably_damaging(0.956) | TCGA-UC-A7PG-06 | Cervix | cervical & endocervical cancer | Female | <65 | III/IV | Chemotherapy | cisplatin | PD |
| TCEAL3 | SNV | Missense_Mutation | c.4N>A | p.Glu2Lys | p.E2K | Q969E4 | protein_coding | deleterious(0.04) | possibly_damaging(0.737) | TCGA-A5-A0GN-01 | Endometrium | uterine corpus endometrioid carcinoma | Female | >=65 | I/II | Unknown | Unknown | SD | |
| TCEAL3 | SNV | Missense_Mutation | novel | c.52N>T | p.Pro18Ser | p.P18S | Q969E4 | protein_coding | tolerated(0.47) | benign(0.02) | TCGA-AJ-A23O-01 | Endometrium | uterine corpus endometrioid carcinoma | Female | >=65 | I/II | Unknown | Unknown | SD |
| TCEAL3 | SNV | Missense_Mutation | novel | c.289N>A | p.Ala97Thr | p.A97T | Q969E4 | protein_coding | tolerated(0.09) | probably_damaging(0.999) | TCGA-AJ-A3EL-01 | Endometrium | uterine corpus endometrioid carcinoma | Female | <65 | I/II | Unknown | Unknown | SD |
| TCEAL3 | SNV | Missense_Mutation | novel | c.56N>G | p.Glu19Gly | p.E19G | Q969E4 | protein_coding | deleterious(0.01) | benign(0.247) | TCGA-AP-A0LM-01 | Endometrium | uterine corpus endometrioid carcinoma | Female | <65 | III/IV | Chemotherapy | cisplatin | SD |
| TCEAL3 | SNV | Missense_Mutation | novel | c.382N>A | p.Asp128Asn | p.D128N | Q969E4 | protein_coding | tolerated(0.66) | benign(0.086) | TCGA-AX-A05Z-01 | Endometrium | uterine corpus endometrioid carcinoma | Female | <65 | III/IV | Chemotherapy | adriamycin | SD |
| TCEAL3 | SNV | Missense_Mutation | c.514N>T | p.Pro172Ser | p.P172S | Q969E4 | protein_coding | tolerated(0.11) | benign(0.036) | TCGA-AX-A1CE-01 | Endometrium | uterine corpus endometrioid carcinoma | Female | <65 | I/II | Unspecific | Paclitaxel | SD |
| Page: 1 2 3 |
Top |
Related drugs of malignant transformation related genes |
| Identification of chemicals and drugs interact with genes involved in malignant transfromation |
| (DGIdb 4.0) |
| Entrez ID | Symbol | Category | Interaction Types | Drug Claim Name | Drug Name | PMIDs |
| Page: 1 |

Copyright 2023-Present -The University of Texas Health Science Center at Houston |