
|
|||||
|
 | |
| |
| |
| |
| |
| |
|
Gene: TCEA1 |
Gene summary for TCEA1 |
| Gene information | Species | Human | Gene symbol | TCEA1 | Gene ID | 6917 |
| Gene name | transcription elongation factor A1 | |
| Gene Alias | GTF2S | |
| Cytomap | 8q11.23 | |
| Gene Type | protein-coding | GO ID | GO:0006139 | UniProtAcc | P23193 |
Top |
Malignant transformation analysis |
| Identification of the aberrant gene expression in precancerous and cancerous lesions by comparing the gene expression of stem-like cells in diseased tissues with normal stem cells |
| Entrez ID | Symbol | Replicates | Species | Organ | Tissue | Adj P-value | Log2FC | Malignancy |
| 6917 | TCEA1 | GSM4909281 | Human | Breast | IDC | 1.16e-03 | 2.79e-01 | 0.21 |
| 6917 | TCEA1 | GSM4909288 | Human | Breast | IDC | 2.43e-06 | 5.99e-03 | 0.0988 |
| 6917 | TCEA1 | GSM4909293 | Human | Breast | IDC | 1.24e-07 | 3.10e-01 | 0.1581 |
| 6917 | TCEA1 | GSM4909294 | Human | Breast | IDC | 1.38e-07 | 2.45e-01 | 0.2022 |
| 6917 | TCEA1 | GSM4909296 | Human | Breast | IDC | 7.51e-10 | -1.86e-01 | 0.1524 |
| 6917 | TCEA1 | GSM4909297 | Human | Breast | IDC | 3.24e-15 | -4.75e-02 | 0.1517 |
| 6917 | TCEA1 | GSM4909309 | Human | Breast | IDC | 1.14e-04 | -1.02e-01 | 0.0483 |
| 6917 | TCEA1 | GSM4909311 | Human | Breast | IDC | 9.77e-32 | -5.86e-02 | 0.1534 |
| 6917 | TCEA1 | GSM4909312 | Human | Breast | IDC | 1.10e-25 | 4.55e-01 | 0.1552 |
| 6917 | TCEA1 | GSM4909313 | Human | Breast | IDC | 4.69e-05 | 6.05e-02 | 0.0391 |
| 6917 | TCEA1 | GSM4909317 | Human | Breast | IDC | 1.87e-57 | 1.01e+00 | 0.1355 |
| 6917 | TCEA1 | GSM4909318 | Human | Breast | IDC | 6.73e-50 | 1.33e+00 | 0.2031 |
| 6917 | TCEA1 | GSM4909319 | Human | Breast | IDC | 5.76e-43 | -6.62e-02 | 0.1563 |
| 6917 | TCEA1 | GSM4909320 | Human | Breast | IDC | 1.66e-06 | -1.55e-01 | 0.1575 |
| 6917 | TCEA1 | GSM4909321 | Human | Breast | IDC | 8.06e-15 | -2.12e-01 | 0.1559 |
| 6917 | TCEA1 | M2 | Human | Breast | IDC | 9.09e-05 | 1.88e-01 | 0.21 |
| 6917 | TCEA1 | M5 | Human | Breast | IDC | 2.81e-03 | 5.54e-01 | 0.1598 |
| 6917 | TCEA1 | NCCBC14 | Human | Breast | DCIS | 5.83e-14 | 2.61e-02 | 0.2021 |
| 6917 | TCEA1 | NCCBC2 | Human | Breast | DCIS | 2.18e-10 | 8.27e-02 | 0.1554 |
| 6917 | TCEA1 | NCCBC5 | Human | Breast | DCIS | 2.52e-15 | -7.16e-02 | 0.2046 |
| Page: 1 2 3 4 5 6 7 8 |
| Tissue | Expression Dynamics | Abbreviation |
| Breast | 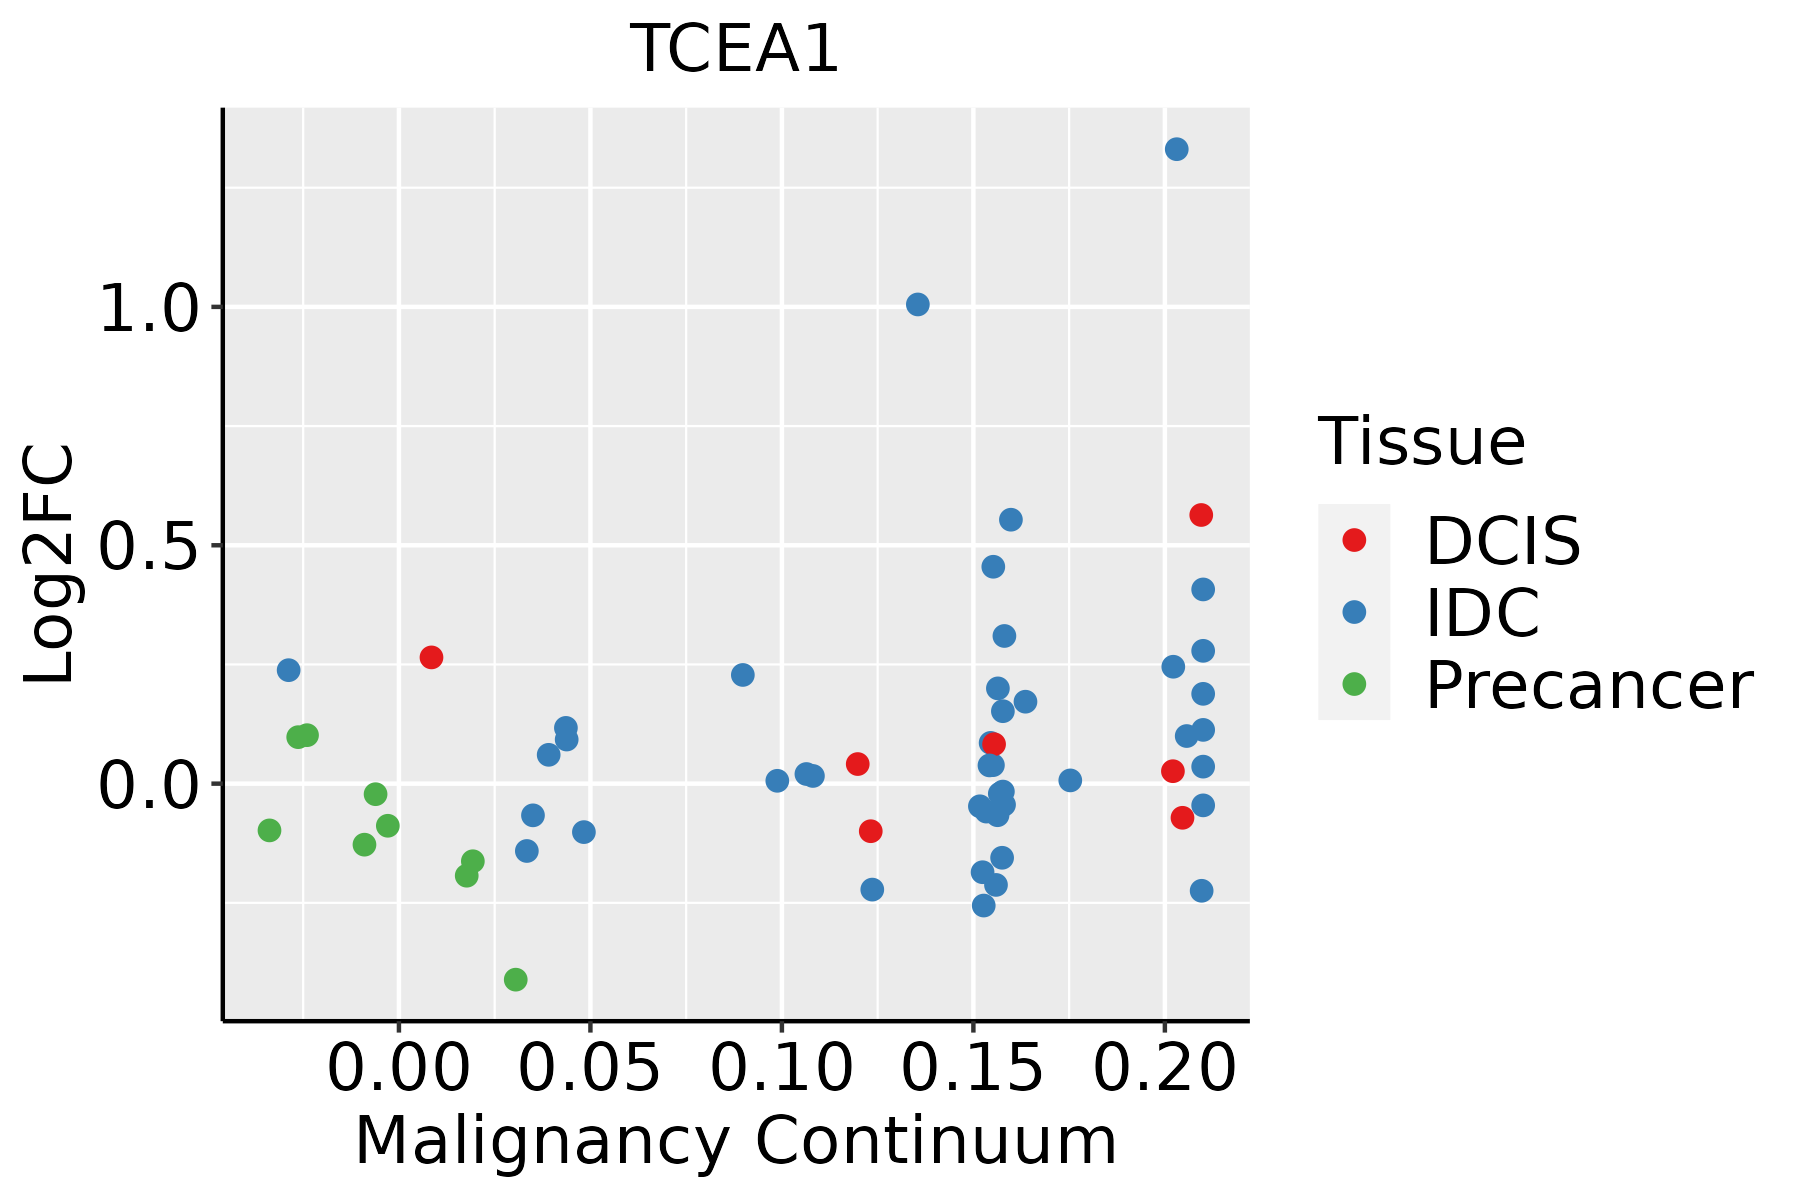 | IDC: Invasive ductal carcinoma |
| DCIS: Ductal carcinoma in situ | ||
| Precancer(BRCA1-mut): Precancerous lesion from BRCA1 mutation carriers | ||
| Esophagus | 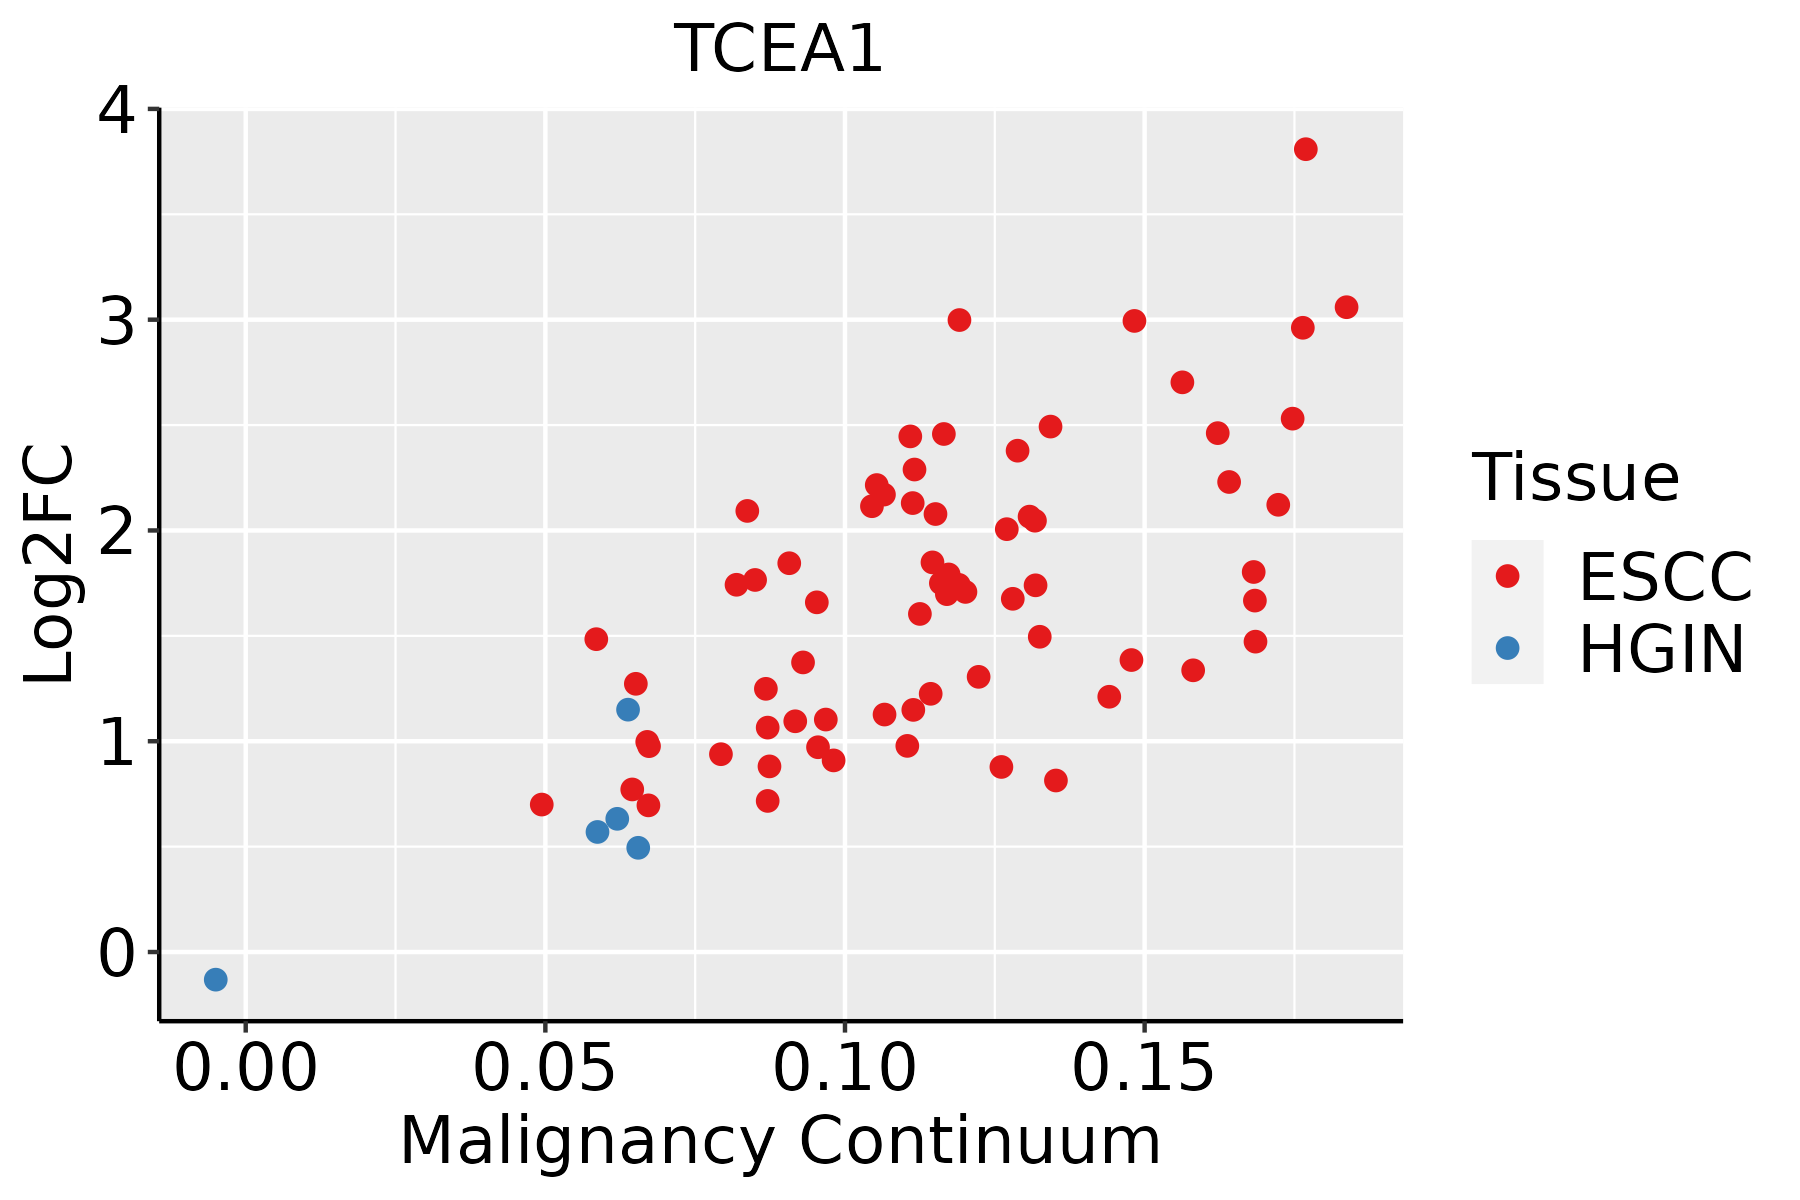 | ESCC: Esophageal squamous cell carcinoma |
| HGIN: High-grade intraepithelial neoplasias | ||
| LGIN: Low-grade intraepithelial neoplasias | ||
| Liver | 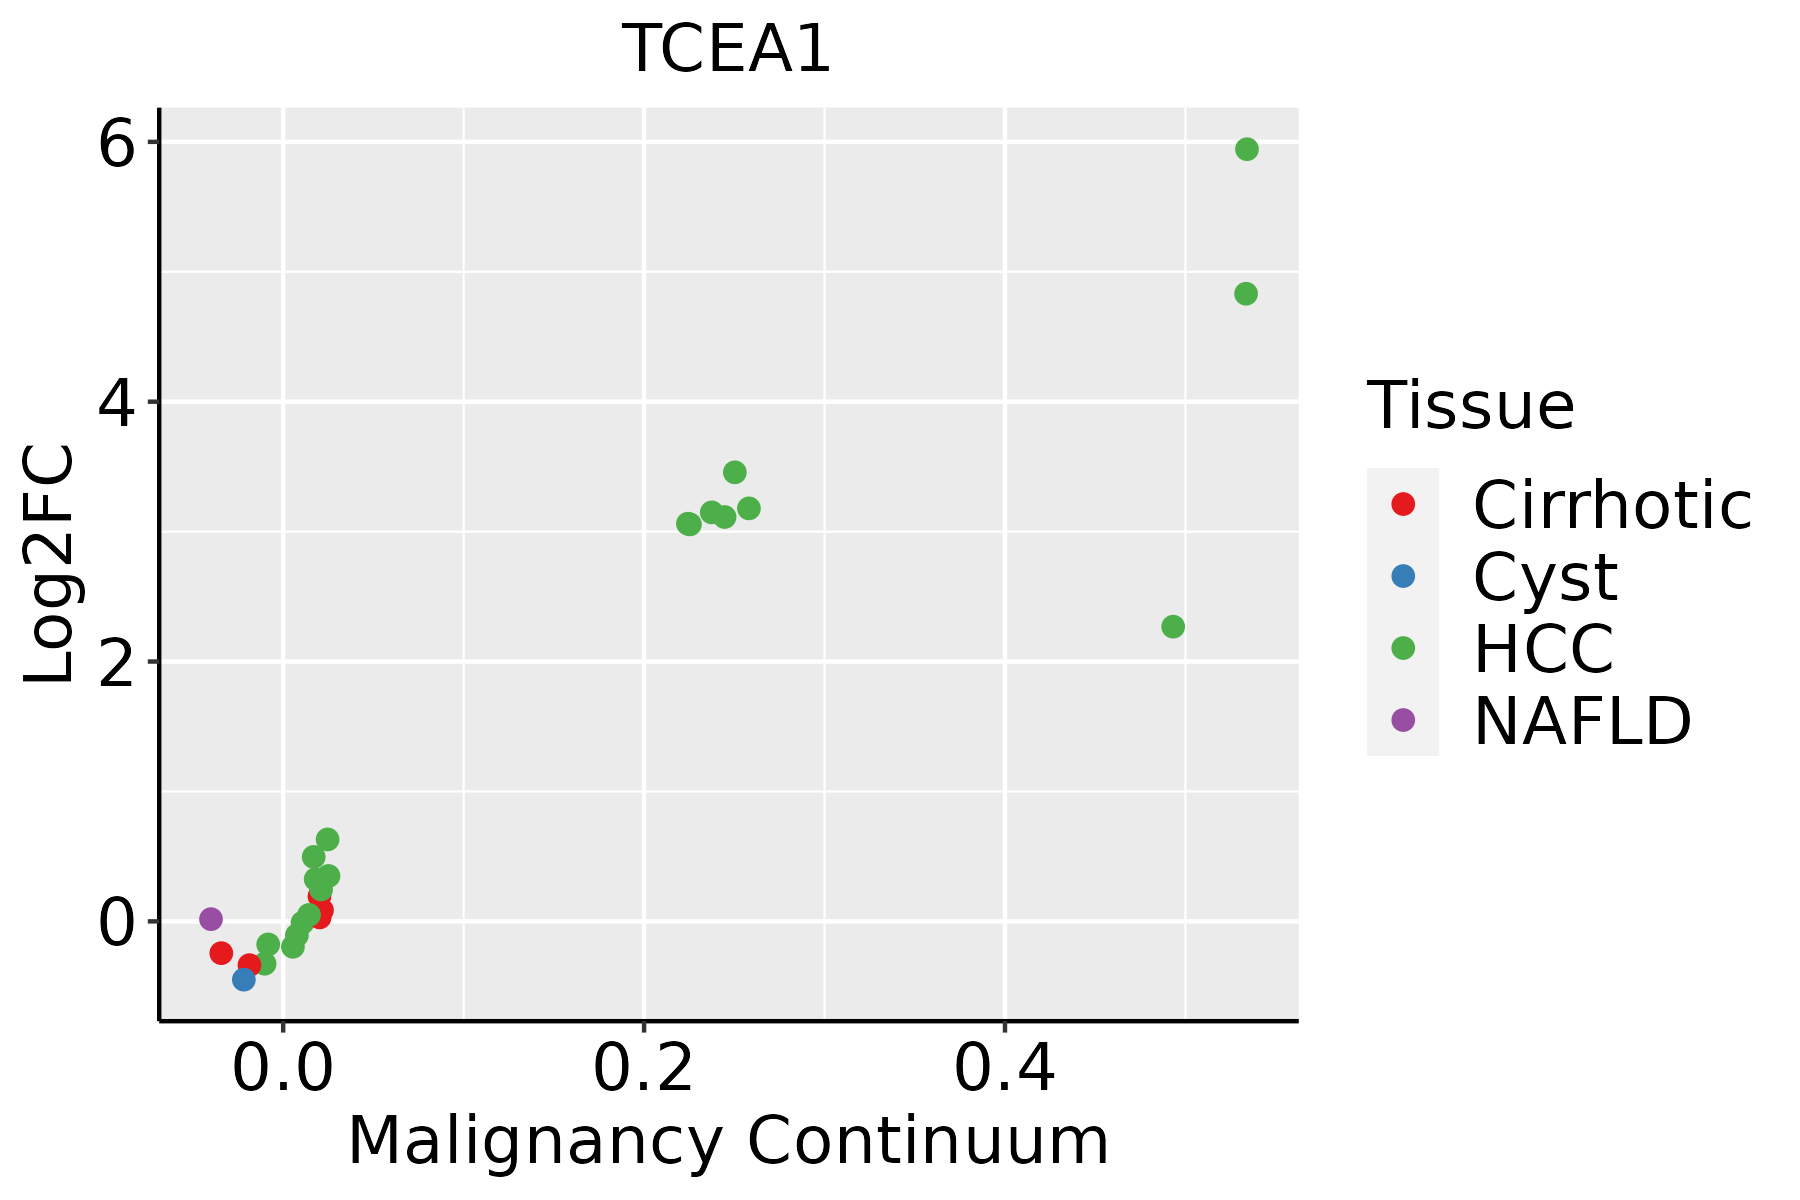 | HCC: Hepatocellular carcinoma |
| NAFLD: Non-alcoholic fatty liver disease | ||
| Oral Cavity | 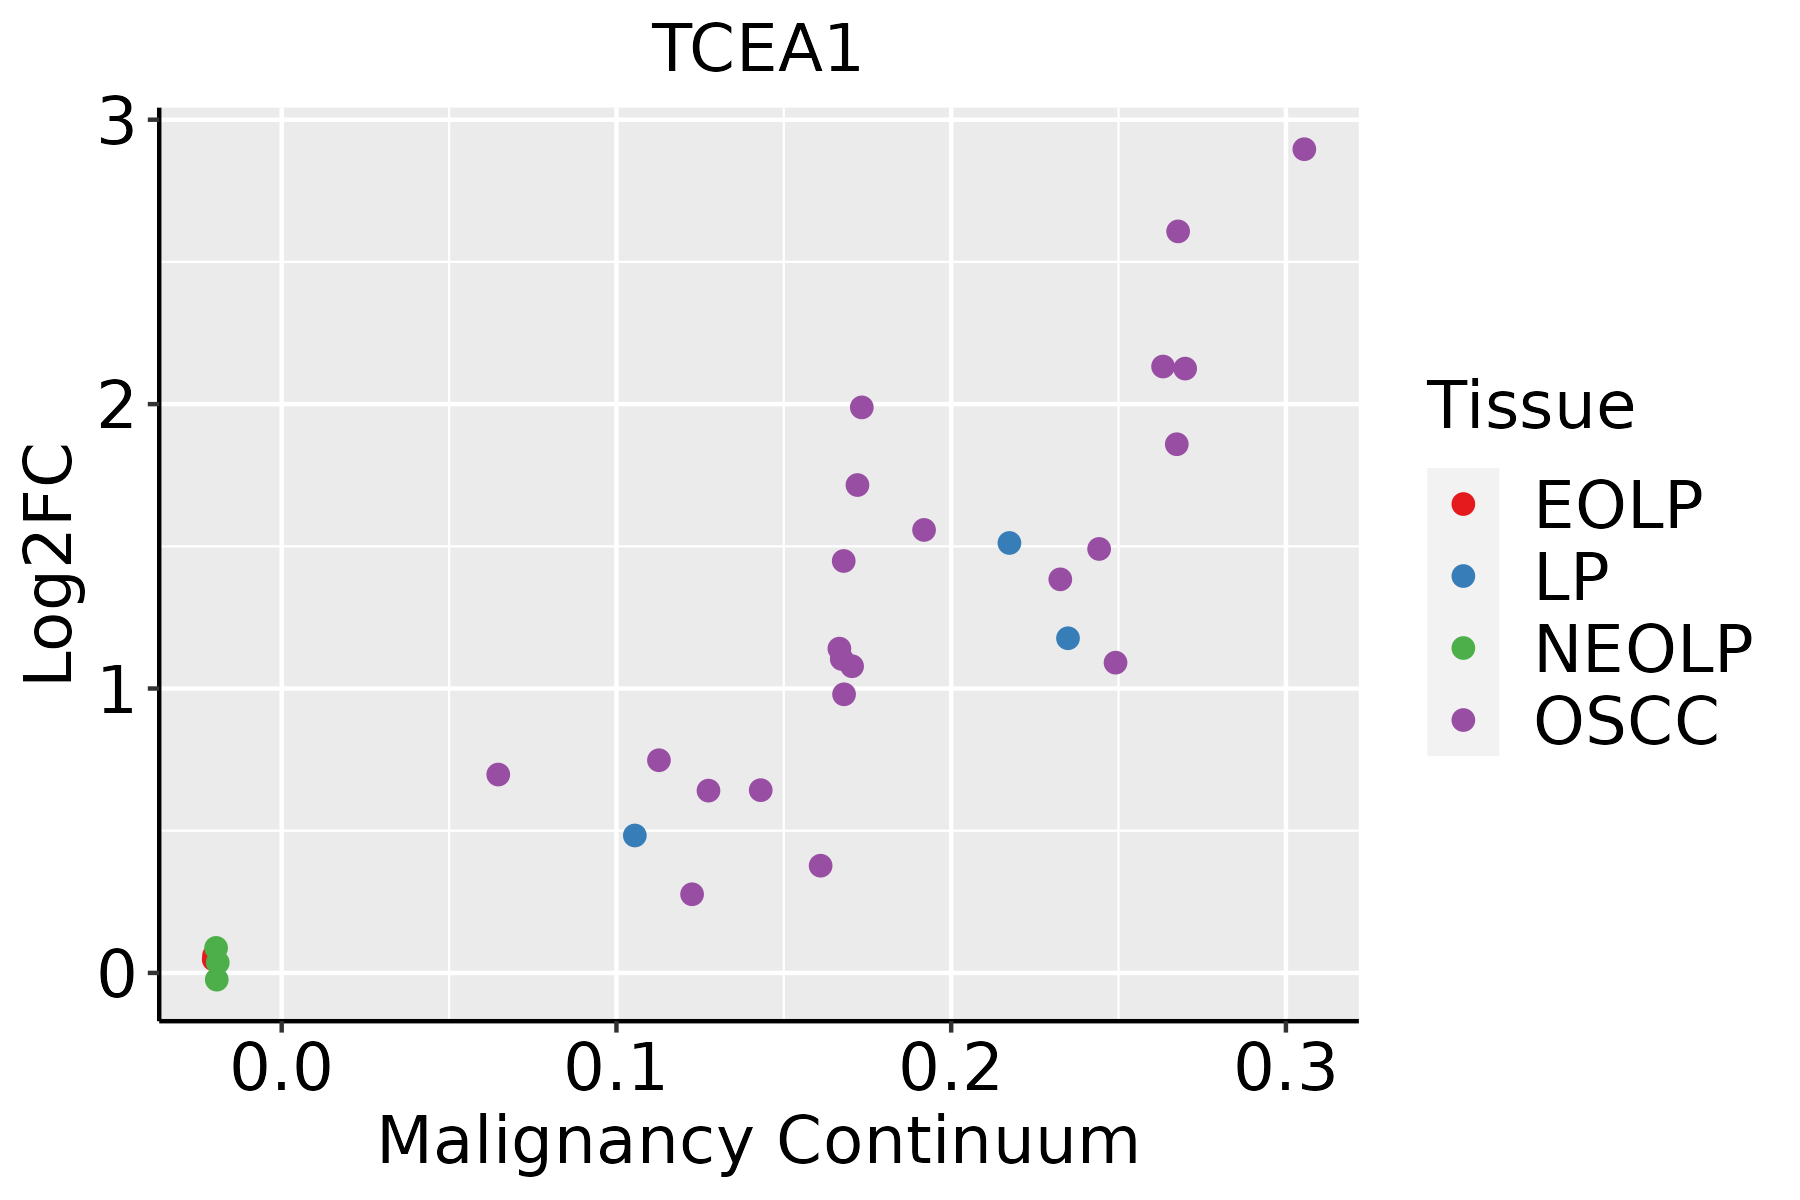 | EOLP: Erosive Oral lichen planus |
| LP: leukoplakia | ||
| NEOLP: Non-erosive oral lichen planus | ||
| OSCC: Oral squamous cell carcinoma | ||
| Prostate | 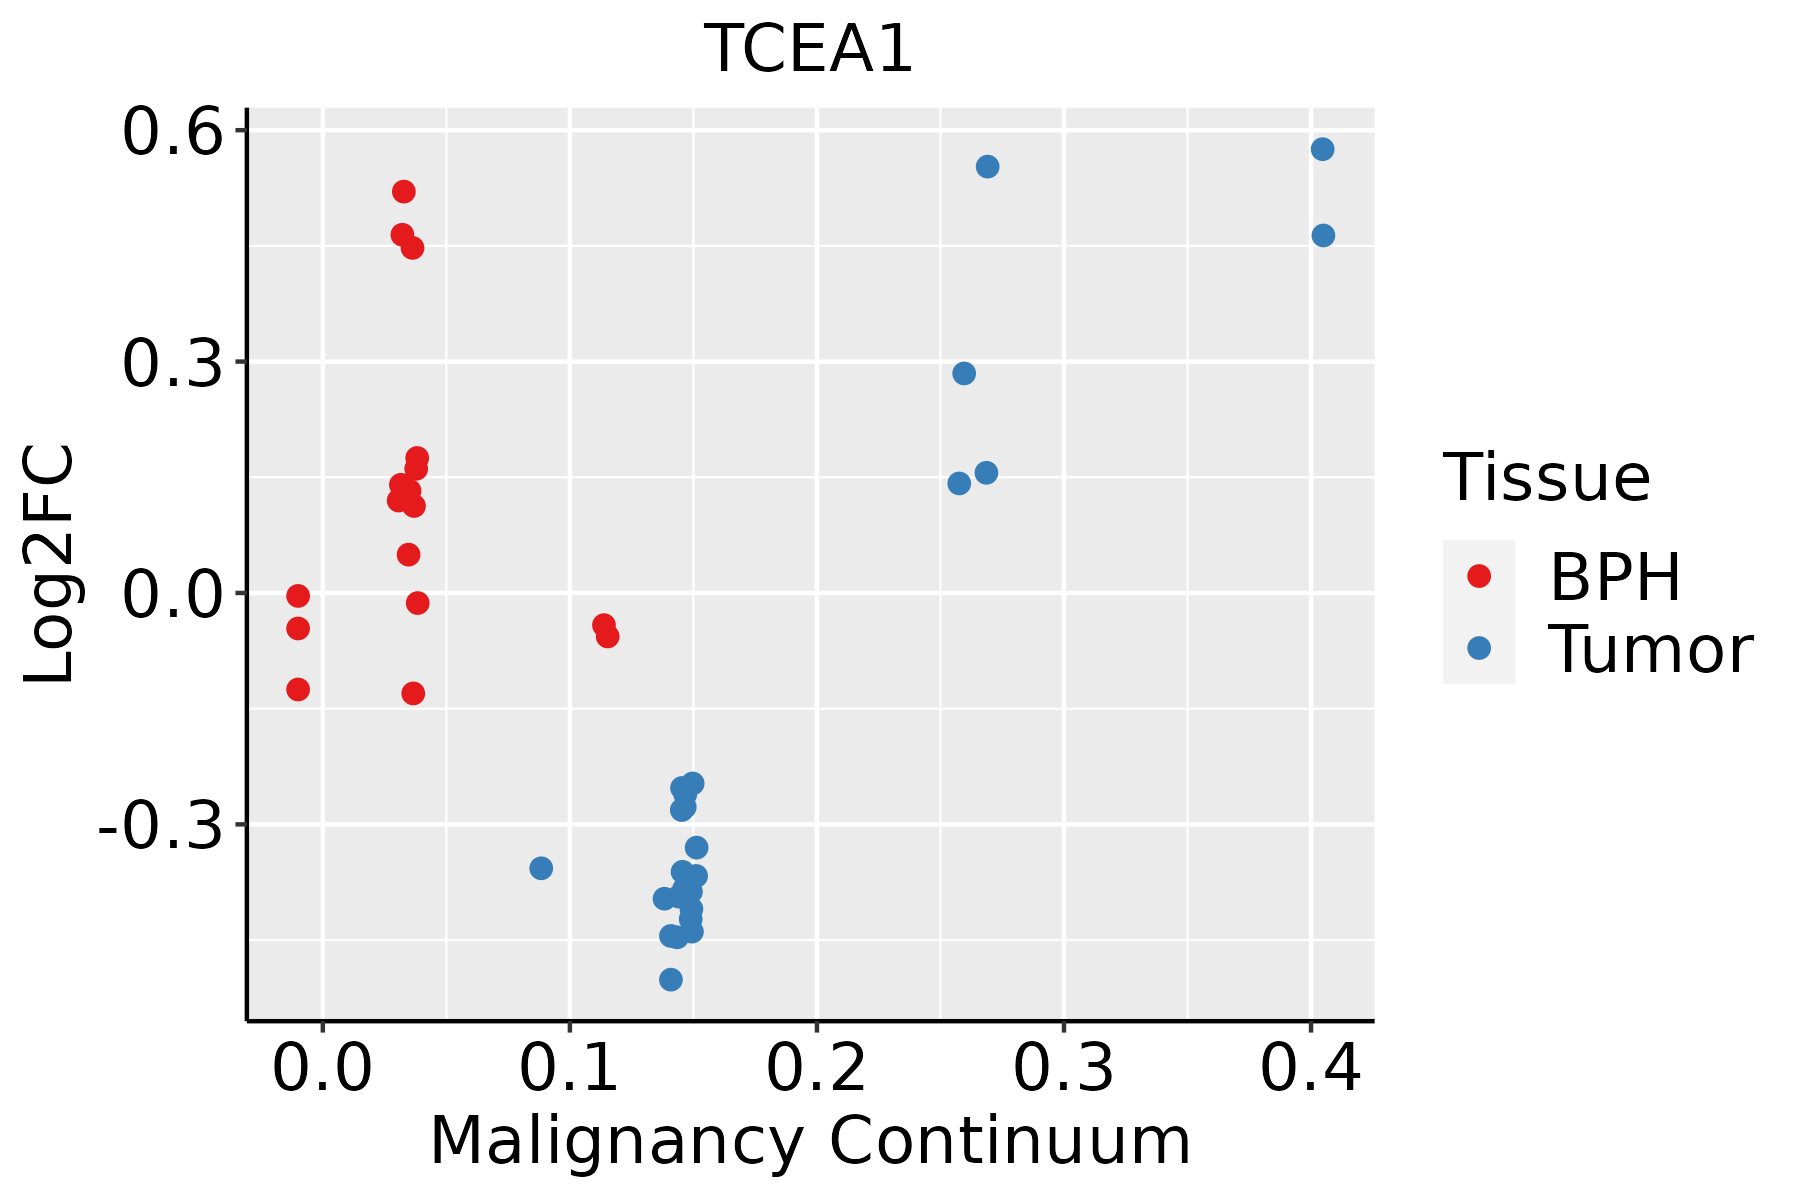 | BPH: Benign Prostatic Hyperplasia |
| Skin | 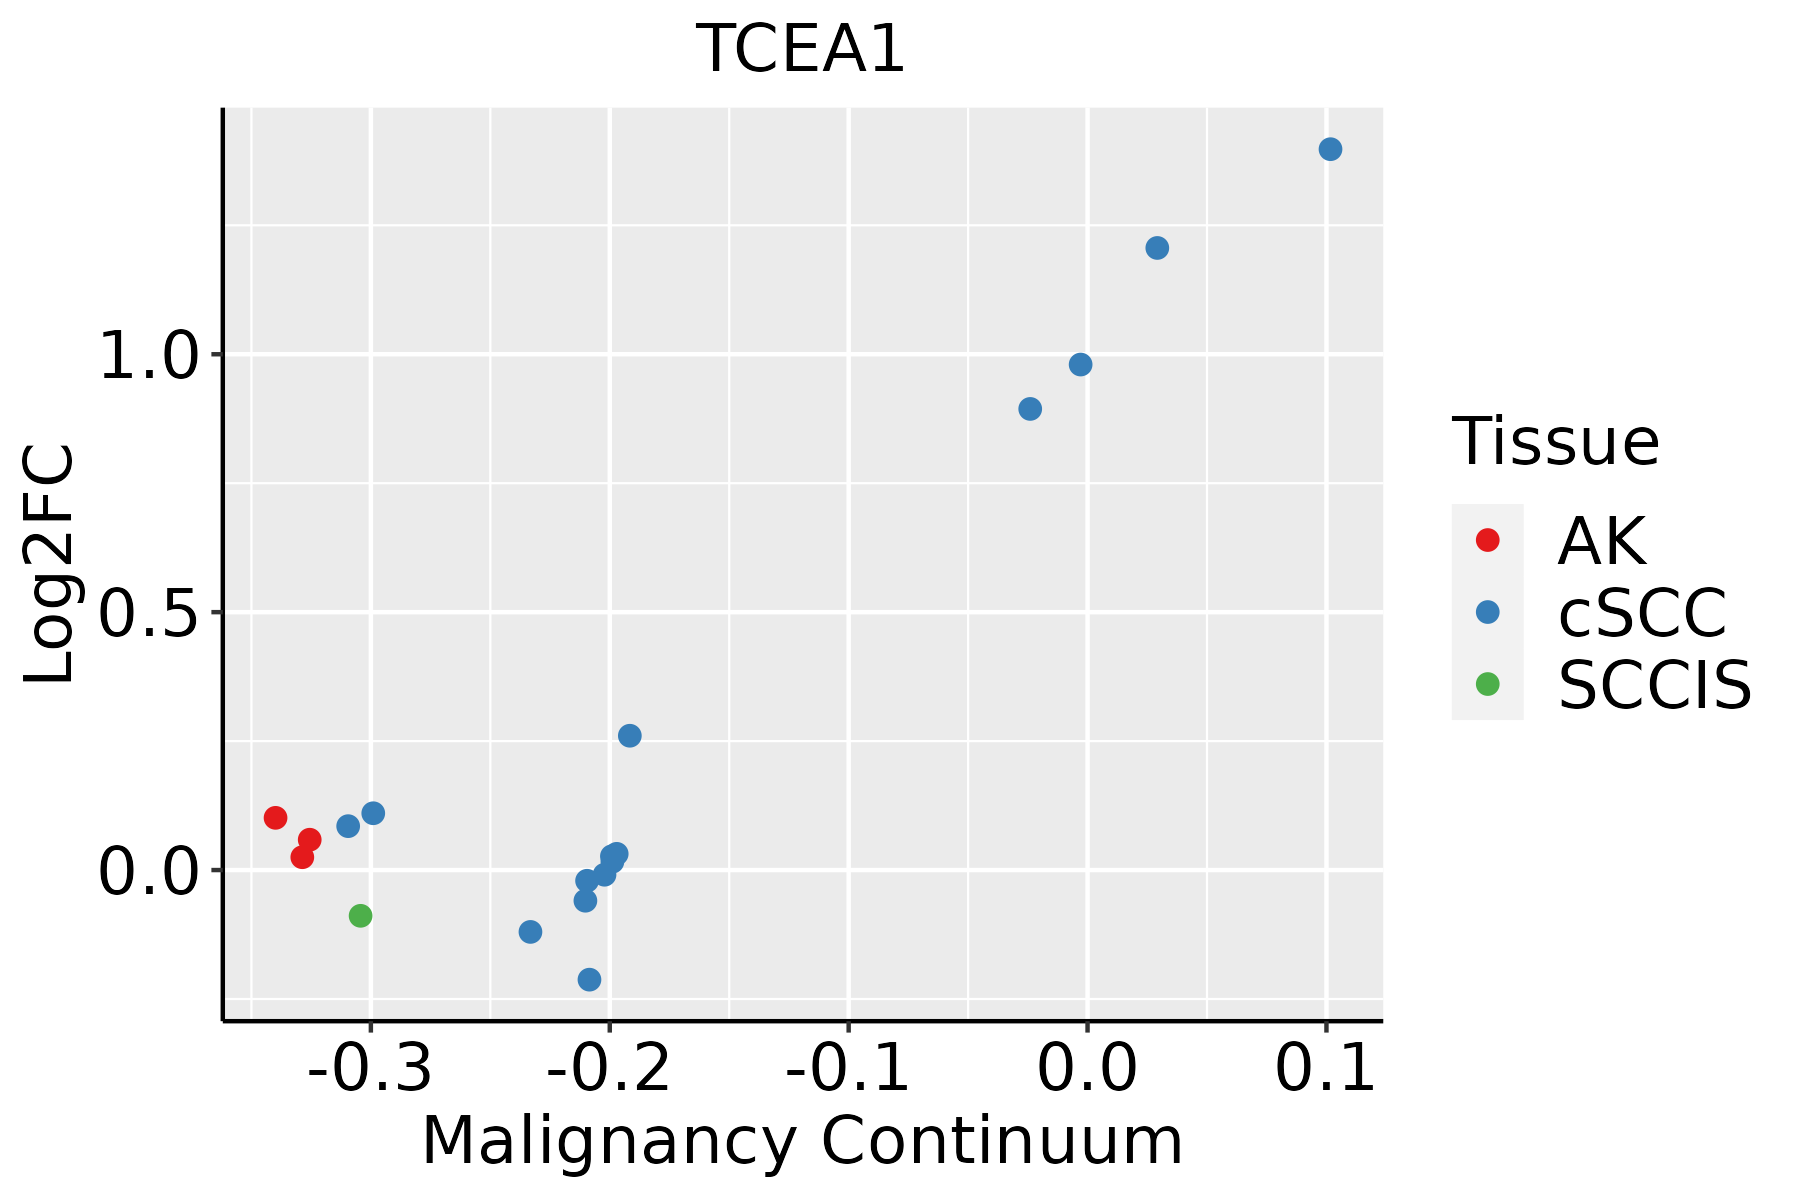 | AK: Actinic keratosis |
| cSCC: Cutaneous squamous cell carcinoma | ||
| SCCIS:squamous cell carcinoma in situ | ||
| Thyroid | 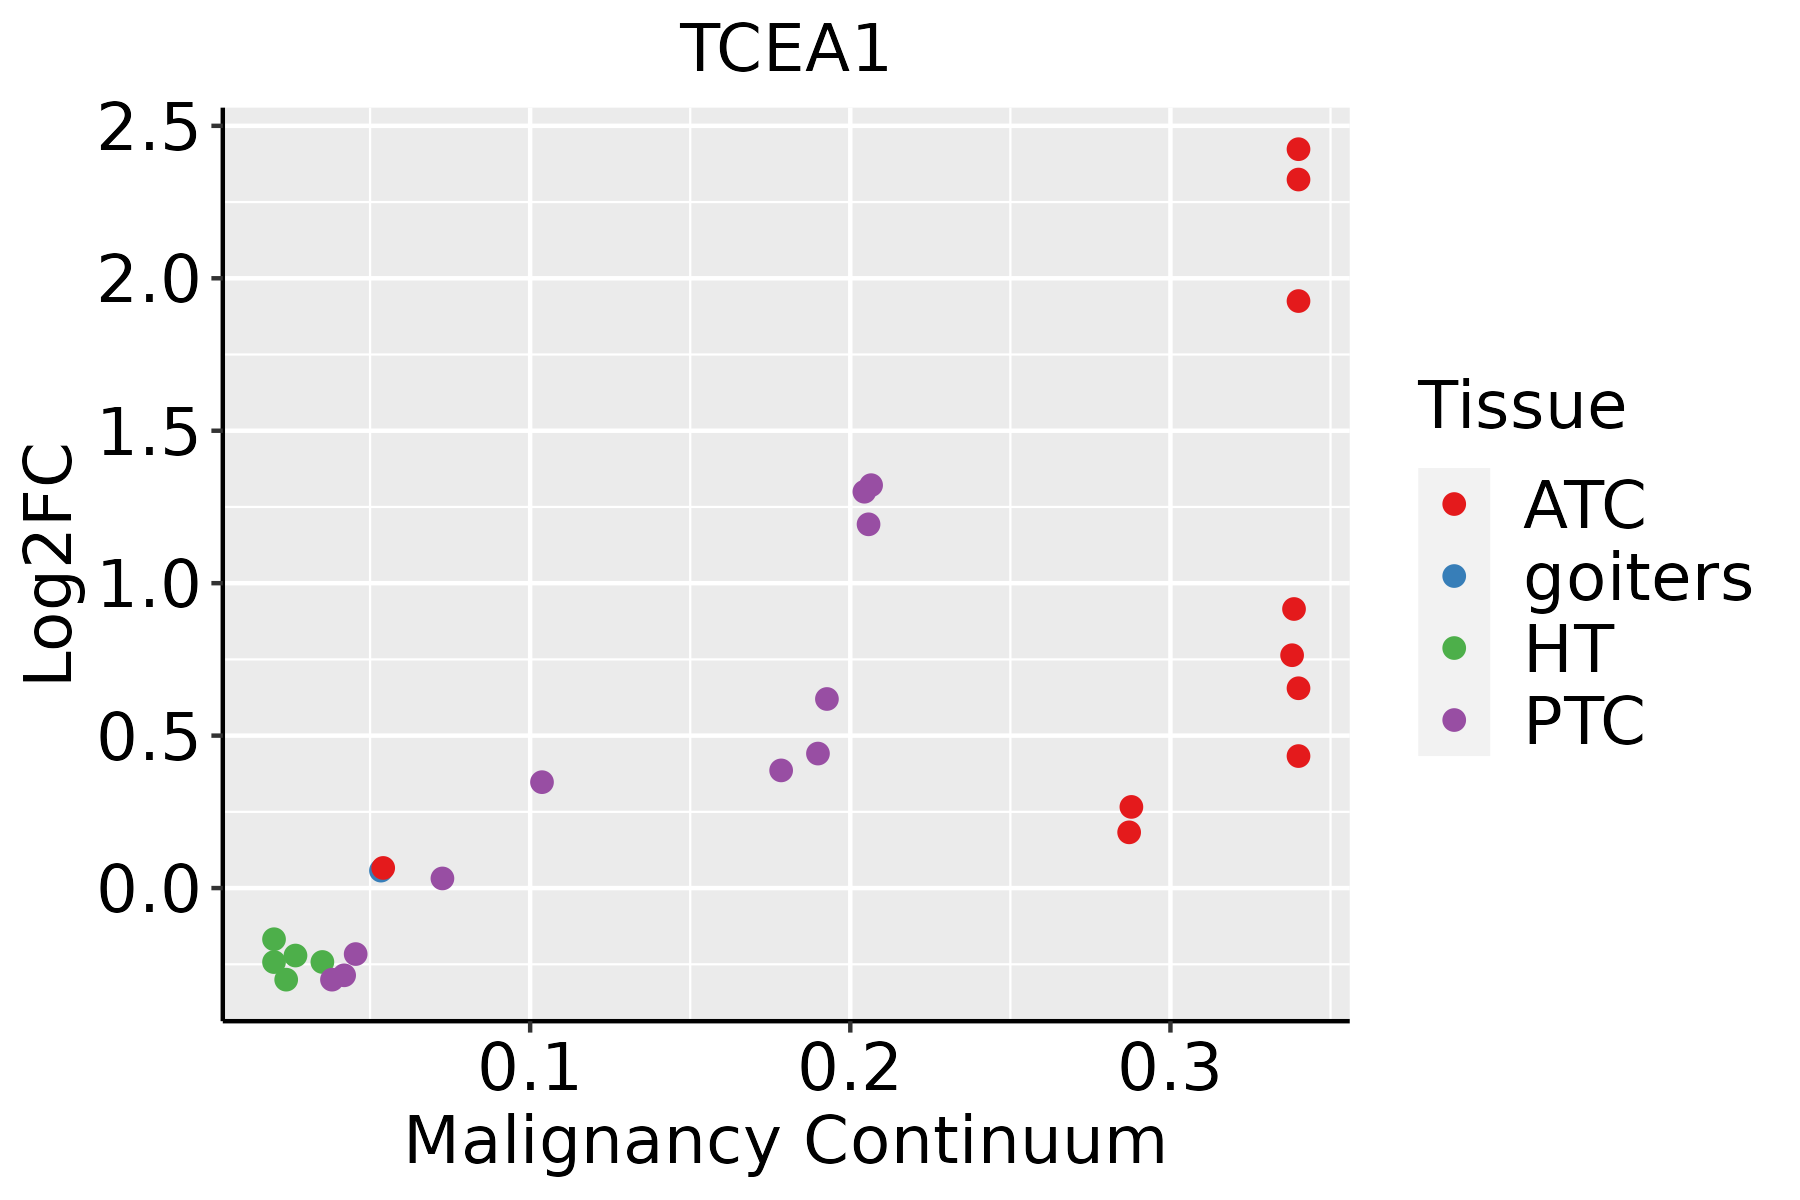 | ATC: Anaplastic thyroid cancer |
| HT: Hashimoto's thyroiditis | ||
| PTC: Papillary thyroid cancer |
| ∗log2FC in expression of this searched gene in stem-like cells from each diseased tissue sample relative to stem-like cells in normal samples in each tissue plotted against the malignancy continuum. Samples are colored based on if they are from different disease stage. |
Top |
Malignant transformation related pathway analysis |
| Find out the enriched GO biological processes and KEGG pathways involved in transition from healthy to precancer to cancer |
| Tissue | Disease Stage | Enriched GO biological Processes |
| Colorectum | AD |  |
| Colorectum | SER |  |
| Colorectum | MSS |  |
| Colorectum | MSI-H |  |
| Colorectum | FAP |  |
| ∗Top 15 enriched GO BP terms are showed in the bar plot of each disease state in each tissue. Each row represents a significant GO biological process which is colored according to the -log10(p.adjust). |
| Page: 1 2 3 4 5 6 7 8 9 |
| GO ID | Tissue | Disease Stage | Description | Gene Ratio | Bg Ratio | pvalue | p.adjust | Count |
| GO:003206912 | Breast | IDC | regulation of nuclease activity | 8/1434 | 22/18723 | 1.40e-04 | 2.49e-03 | 8 |
| GO:003206922 | Breast | DCIS | regulation of nuclease activity | 8/1390 | 22/18723 | 1.13e-04 | 2.00e-03 | 8 |
| GO:00320698 | Esophagus | ESCC | regulation of nuclease activity | 19/8552 | 22/18723 | 9.52e-05 | 6.78e-04 | 19 |
| GO:00320695 | Liver | Cirrhotic | regulation of nuclease activity | 11/4634 | 22/18723 | 9.18e-03 | 4.21e-02 | 11 |
| GO:003206911 | Liver | HCC | regulation of nuclease activity | 18/7958 | 22/18723 | 1.91e-04 | 1.49e-03 | 18 |
| GO:00320697 | Oral cavity | OSCC | regulation of nuclease activity | 20/7305 | 22/18723 | 6.02e-07 | 8.64e-06 | 20 |
| GO:003206913 | Oral cavity | LP | regulation of nuclease activity | 14/4623 | 22/18723 | 1.23e-04 | 1.44e-03 | 14 |
| GO:00320699 | Skin | cSCC | regulation of nuclease activity | 14/4864 | 22/18723 | 2.22e-04 | 1.83e-03 | 14 |
| GO:003206914 | Thyroid | PTC | regulation of nuclease activity | 15/5968 | 22/18723 | 5.11e-04 | 3.32e-03 | 15 |
| GO:003206923 | Thyroid | ATC | regulation of nuclease activity | 17/6293 | 22/18723 | 3.47e-05 | 2.84e-04 | 17 |
| Page: 1 |
| Pathway ID | Tissue | Disease Stage | Description | Gene Ratio | Bg Ratio | pvalue | p.adjust | qvalue | Count |
| Page: 1 |
Top |
Cell-cell communication analysis |
| Identification of potential cell-cell interactions between two cell types and their ligand-receptor pairs for different disease states |
| Ligand | Receptor | LRpair | Pathway | Tissue | Disease Stage |
| Page: 1 |
Top |
Single-cell gene regulatory network inference analysis |
| Find out the significant the regulons (TFs) and the target genes of each regulon across cell types for different disease states |
| TF | Cell Type | Tissue | Disease Stage | Target Gene | RSS | Regulon Activity |
| ∗The dot plots of a searched regulon are shown for all cell subpopulations in each disease state of each tissue based on the regulon specific score inferred using pySCENIC and by calculating the average expression. |
| Page: 1 |
Top |
Somatic mutation of malignant transformation related genes |
| Annotation of somatic variants for genes involved in malignant transformation |
| Hugo Symbol | Variant Class | Variant Classification | dbSNP RS | HGVSc | HGVSp | HGVSp Short | SWISSPROT | BIOTYPE | SIFT | PolyPhen | Tumor Sample Barcode | Tissue | Histology | Sex | Age | Stage | Therapy Types | Drugs | Outcome |
| TCEA1 | SNV | Missense_Mutation | c.434N>T | p.Arg145Met | p.R145M | P23193 | protein_coding | tolerated(0.08) | possibly_damaging(0.898) | TCGA-A8-A08R-01 | Breast | breast invasive carcinoma | Female | <65 | I/II | Unknown | Unknown | SD | |
| TCEA1 | SNV | Missense_Mutation | c.316N>C | p.Glu106Gln | p.E106Q | P23193 | protein_coding | tolerated(0.24) | benign(0.1) | TCGA-AC-A23H-01 | Breast | breast invasive carcinoma | Female | >=65 | I/II | Unknown | Unknown | PD | |
| TCEA1 | SNV | Missense_Mutation | c.569N>C | p.Arg190Thr | p.R190T | P23193 | protein_coding | deleterious(0) | probably_damaging(0.983) | TCGA-BH-A0HP-01 | Breast | breast invasive carcinoma | Female | >=65 | III/IV | Chemotherapy | doxorubicin | SD | |
| TCEA1 | insertion | Frame_Shift_Ins | novel | c.376_377insGG | p.Tyr126TrpfsTer18 | p.Y126Wfs*18 | P23193 | protein_coding | TCGA-AR-A0TY-01 | Breast | breast invasive carcinoma | Female | <65 | I/II | Unspecific | Paclitaxel | PD | ||
| TCEA1 | SNV | Missense_Mutation | novel | c.287C>T | p.Thr96Ile | p.T96I | P23193 | protein_coding | deleterious(0.04) | benign(0.017) | TCGA-EA-A410-01 | Cervix | cervical & endocervical cancer | Female | <65 | I/II | Unknown | Unknown | SD |
| TCEA1 | SNV | Missense_Mutation | c.338N>A | p.Val113Glu | p.V113E | P23193 | protein_coding | tolerated(1) | benign(0.01) | TCGA-VS-A9UR-01 | Cervix | cervical & endocervical cancer | Female | <65 | I/II | Chemotherapy | cisplatin | PD | |
| TCEA1 | SNV | Missense_Mutation | c.841G>A | p.Ala281Thr | p.A281T | P23193 | protein_coding | deleterious(0) | possibly_damaging(0.901) | TCGA-A6-2686-01 | Colorectum | colon adenocarcinoma | Female | >=65 | I/II | Unknown | Unknown | SD | |
| TCEA1 | SNV | Missense_Mutation | rs762271675 | c.742N>T | p.His248Tyr | p.H248Y | P23193 | protein_coding | deleterious(0.02) | possibly_damaging(0.808) | TCGA-AA-3949-01 | Colorectum | colon adenocarcinoma | Female | >=65 | III/IV | Unknown | Unknown | SD |
| TCEA1 | SNV | Missense_Mutation | novel | c.709N>T | p.Arg237Trp | p.R237W | P23193 | protein_coding | deleterious(0) | possibly_damaging(0.72) | TCGA-AA-3950-01 | Colorectum | colon adenocarcinoma | Female | >=65 | I/II | Unknown | Unknown | SD |
| TCEA1 | SNV | Missense_Mutation | rs199869556 | c.394N>T | p.Arg132Trp | p.R132W | P23193 | protein_coding | deleterious(0.03) | possibly_damaging(0.586) | TCGA-AA-3982-01 | Colorectum | colon adenocarcinoma | Male | >=65 | III/IV | Unknown | Unknown | SD |
| Page: 1 2 3 4 5 |
Top |
Related drugs of malignant transformation related genes |
| Identification of chemicals and drugs interact with genes involved in malignant transfromation |
| (DGIdb 4.0) |
| Entrez ID | Symbol | Category | Interaction Types | Drug Claim Name | Drug Name | PMIDs |
| Page: 1 |

Copyright 2023-Present -The University of Texas Health Science Center at Houston |