
|
|||||
|
 | |
| |
| |
| |
| |
| |
|
Gene: TCAF2 |
Gene summary for TCAF2 |
| Gene information | Species | Human | Gene symbol | TCAF2 | Gene ID | 285966 |
| Gene name | TRPM8 channel associated factor 2 | |
| Gene Alias | FAM115C | |
| Cytomap | 7q35 | |
| Gene Type | protein-coding | GO ID | GO:0006605 | UniProtAcc | A6NFQ2 |
Top |
Malignant transformation analysis |
| Identification of the aberrant gene expression in precancerous and cancerous lesions by comparing the gene expression of stem-like cells in diseased tissues with normal stem cells |
| Entrez ID | Symbol | Replicates | Species | Organ | Tissue | Adj P-value | Log2FC | Malignancy |
| 285966 | TCAF2 | LZE20T | Human | Esophagus | ESCC | 4.98e-02 | 9.76e-02 | 0.0662 |
| 285966 | TCAF2 | P4T-E | Human | Esophagus | ESCC | 8.00e-03 | 9.13e-02 | 0.1323 |
| 285966 | TCAF2 | P15T-E | Human | Esophagus | ESCC | 2.04e-07 | 2.04e-01 | 0.1149 |
| 285966 | TCAF2 | P16T-E | Human | Esophagus | ESCC | 3.50e-02 | 4.46e-02 | 0.1153 |
| 285966 | TCAF2 | P26T-E | Human | Esophagus | ESCC | 1.78e-03 | 1.26e-01 | 0.1276 |
| 285966 | TCAF2 | P27T-E | Human | Esophagus | ESCC | 3.75e-03 | 7.08e-02 | 0.1055 |
| 285966 | TCAF2 | P32T-E | Human | Esophagus | ESCC | 1.96e-05 | 1.28e-01 | 0.1666 |
| 285966 | TCAF2 | P49T-E | Human | Esophagus | ESCC | 3.28e-15 | 9.50e-01 | 0.1768 |
| 285966 | TCAF2 | P83T-E | Human | Esophagus | ESCC | 8.77e-03 | 1.16e-01 | 0.1738 |
| 285966 | TCAF2 | P89T-E | Human | Esophagus | ESCC | 6.22e-10 | 5.75e-01 | 0.1752 |
| 285966 | TCAF2 | P91T-E | Human | Esophagus | ESCC | 8.74e-05 | 3.52e-01 | 0.1828 |
| 285966 | TCAF2 | P130T-E | Human | Esophagus | ESCC | 1.96e-05 | 1.24e-01 | 0.1676 |
| 285966 | TCAF2 | HTA12-23-1 | Human | Pancreas | PDAC | 4.94e-04 | 5.23e-01 | 0.3405 |
| 285966 | TCAF2 | HTA12-25-1 | Human | Pancreas | PDAC | 1.29e-02 | 3.62e-01 | 0.313 |
| 285966 | TCAF2 | HTA12-26-1 | Human | Pancreas | PDAC | 1.07e-17 | 8.06e-01 | 0.3728 |
| 285966 | TCAF2 | HTA12-29-1 | Human | Pancreas | PDAC | 5.02e-20 | 4.74e-01 | 0.3722 |
| Page: 1 |
| Tissue | Expression Dynamics | Abbreviation |
| Esophagus | 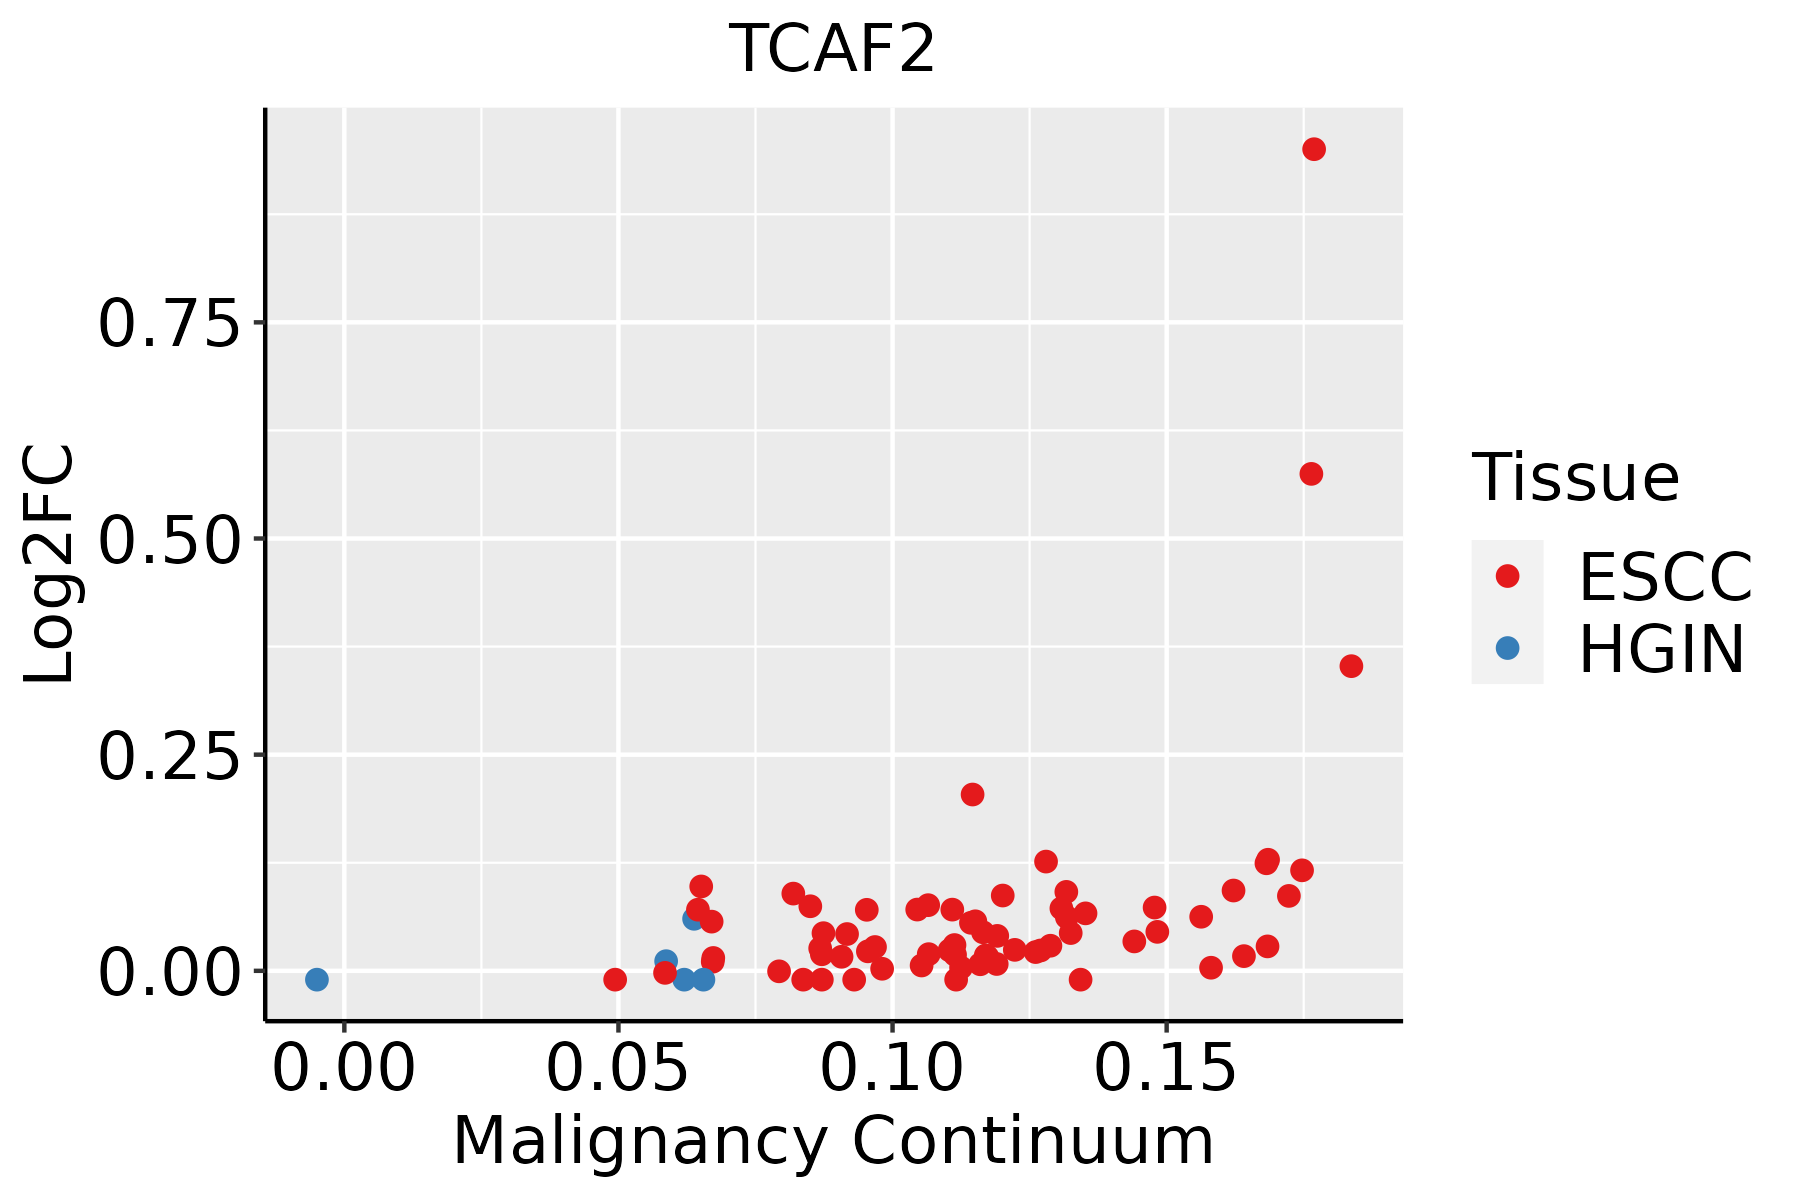 | ESCC: Esophageal squamous cell carcinoma |
| HGIN: High-grade intraepithelial neoplasias | ||
| LGIN: Low-grade intraepithelial neoplasias |
| ∗log2FC in expression of this searched gene in stem-like cells from each diseased tissue sample relative to stem-like cells in normal samples in each tissue plotted against the malignancy continuum. Samples are colored based on if they are from different disease stage. |
Top |
Malignant transformation related pathway analysis |
| Find out the enriched GO biological processes and KEGG pathways involved in transition from healthy to precancer to cancer |
| Tissue | Disease Stage | Enriched GO biological Processes |
| Colorectum | AD |  |
| Colorectum | SER |  |
| Colorectum | MSS |  |
| Colorectum | MSI-H |  |
| Colorectum | FAP |  |
| ∗Top 15 enriched GO BP terms are showed in the bar plot of each disease state in each tissue. Each row represents a significant GO biological process which is colored according to the -log10(p.adjust). |
| Page: 1 2 3 4 5 6 7 8 9 |
| GO ID | Tissue | Disease Stage | Description | Gene Ratio | Bg Ratio | pvalue | p.adjust | Count |
| GO:003238618 | Esophagus | ESCC | regulation of intracellular transport | 243/8552 | 337/18723 | 3.20e-23 | 7.25e-21 | 243 |
| GO:0006605111 | Esophagus | ESCC | protein targeting | 229/8552 | 314/18723 | 4.93e-23 | 1.01e-20 | 229 |
| GO:1903829111 | Esophagus | ESCC | positive regulation of cellular protein localization | 199/8552 | 276/18723 | 2.99e-19 | 3.45e-17 | 199 |
| GO:0033157110 | Esophagus | ESCC | regulation of intracellular protein transport | 169/8552 | 229/18723 | 3.31e-18 | 3.23e-16 | 169 |
| GO:0032388110 | Esophagus | ESCC | positive regulation of intracellular transport | 152/8552 | 202/18723 | 7.89e-18 | 7.36e-16 | 152 |
| GO:1904951111 | Esophagus | ESCC | positive regulation of establishment of protein localization | 216/8552 | 319/18723 | 1.01e-15 | 6.86e-14 | 216 |
| GO:0090150110 | Esophagus | ESCC | establishment of protein localization to membrane | 182/8552 | 260/18723 | 1.27e-15 | 8.19e-14 | 182 |
| GO:009031617 | Esophagus | ESCC | positive regulation of intracellular protein transport | 122/8552 | 160/18723 | 2.45e-15 | 1.49e-13 | 122 |
| GO:0051222111 | Esophagus | ESCC | positive regulation of protein transport | 204/8552 | 303/18723 | 1.56e-14 | 8.38e-13 | 204 |
| GO:190547519 | Esophagus | ESCC | regulation of protein localization to membrane | 117/8552 | 175/18723 | 1.14e-08 | 2.26e-07 | 117 |
| GO:190547719 | Esophagus | ESCC | positive regulation of protein localization to membrane | 73/8552 | 106/18723 | 1.13e-06 | 1.40e-05 | 73 |
| GO:190353315 | Esophagus | ESCC | regulation of protein targeting | 57/8552 | 81/18723 | 5.83e-06 | 6.03e-05 | 57 |
| GO:00066124 | Esophagus | ESCC | protein targeting to membrane | 83/8552 | 131/18723 | 3.31e-05 | 2.73e-04 | 83 |
| GO:00903142 | Esophagus | ESCC | positive regulation of protein targeting to membrane | 22/8552 | 30/18723 | 1.98e-03 | 8.90e-03 | 22 |
| GO:00903132 | Esophagus | ESCC | regulation of protein targeting to membrane | 24/8552 | 36/18723 | 8.98e-03 | 3.13e-02 | 24 |
| Page: 1 |
| Pathway ID | Tissue | Disease Stage | Description | Gene Ratio | Bg Ratio | pvalue | p.adjust | qvalue | Count |
| Page: 1 |
Top |
Cell-cell communication analysis |
| Identification of potential cell-cell interactions between two cell types and their ligand-receptor pairs for different disease states |
| Ligand | Receptor | LRpair | Pathway | Tissue | Disease Stage |
| Page: 1 |
Top |
Single-cell gene regulatory network inference analysis |
| Find out the significant the regulons (TFs) and the target genes of each regulon across cell types for different disease states |
| TF | Cell Type | Tissue | Disease Stage | Target Gene | RSS | Regulon Activity |
| ∗The dot plots of a searched regulon are shown for all cell subpopulations in each disease state of each tissue based on the regulon specific score inferred using pySCENIC and by calculating the average expression. |
| Page: 1 |
Top |
Somatic mutation of malignant transformation related genes |
| Annotation of somatic variants for genes involved in malignant transformation |
| Hugo Symbol | Variant Class | Variant Classification | dbSNP RS | HGVSc | HGVSp | HGVSp Short | SWISSPROT | BIOTYPE | SIFT | PolyPhen | Tumor Sample Barcode | Tissue | Histology | Sex | Age | Stage | Therapy Types | Drugs | Outcome |
| TCAF2 | SNV | Missense_Mutation | novel | c.1109N>C | p.Asn370Thr | p.N370T | A6NFQ2 | protein_coding | deleterious(0) | probably_damaging(0.988) | TCGA-B6-A1KF-01 | Breast | breast invasive carcinoma | Female | >=65 | I/II | Unknown | Unknown | SD |
| TCAF2 | SNV | Missense_Mutation | rs371064627 | c.2299N>A | p.Gly767Arg | p.G767R | A6NFQ2 | protein_coding | tolerated(0.16) | benign(0.049) | TCGA-C8-A1HO-01 | Breast | breast invasive carcinoma | Female | <65 | III/IV | Chemotherapy | 5-fluorouracil | CR |
| TCAF2 | SNV | Missense_Mutation | c.982N>T | p.Asn328Tyr | p.N328Y | A6NFQ2 | protein_coding | deleterious(0) | benign(0.395) | TCGA-C5-A7CO-01 | Cervix | cervical & endocervical cancer | Female | >=65 | I/II | Chemotherapy | cisplatin | SD | |
| TCAF2 | SNV | Missense_Mutation | rs771564142 | c.277G>A | p.Val93Met | p.V93M | A6NFQ2 | protein_coding | deleterious(0.02) | possibly_damaging(0.891) | TCGA-DG-A2KK-01 | Cervix | cervical & endocervical cancer | Female | <65 | III/IV | Chemotherapy | cisplatin | SD |
| TCAF2 | SNV | Missense_Mutation | novel | c.1086N>T | p.Gln362His | p.Q362H | A6NFQ2 | protein_coding | tolerated(0.19) | benign(0.03) | TCGA-A6-3809-01 | Colorectum | colon adenocarcinoma | Female | >=65 | I/II | Unknown | Unknown | SD |
| TCAF2 | SNV | Missense_Mutation | rs753228023 | c.988N>A | p.Asp330Asn | p.D330N | A6NFQ2 | protein_coding | tolerated(0.16) | benign(0.077) | TCGA-AA-A010-01 | Colorectum | colon adenocarcinoma | Female | <65 | I/II | Chemotherapy | folinic | CR |
| TCAF2 | SNV | Missense_Mutation | novel | c.1139C>A | p.Pro380His | p.P380H | A6NFQ2 | protein_coding | deleterious(0) | probably_damaging(0.999) | TCGA-G4-6302-01 | Colorectum | colon adenocarcinoma | Female | >=65 | I/II | Unknown | Unknown | SD |
| TCAF2 | SNV | Missense_Mutation | c.940C>G | p.Leu314Val | p.L314V | A6NFQ2 | protein_coding | deleterious(0.01) | possibly_damaging(0.767) | TCGA-AG-3898-01 | Colorectum | rectum adenocarcinoma | Male | <65 | I/II | Unknown | Unknown | SD | |
| TCAF2 | SNV | Missense_Mutation | c.1021G>T | p.Asp341Tyr | p.D341Y | A6NFQ2 | protein_coding | deleterious(0) | probably_damaging(0.967) | TCGA-AG-A002-01 | Colorectum | rectum adenocarcinoma | Male | <65 | I/II | Unknown | Unknown | SD | |
| TCAF2 | SNV | Missense_Mutation | novel | c.1284G>T | p.Glu428Asp | p.E428D | A6NFQ2 | protein_coding | tolerated(0.39) | benign(0.005) | TCGA-AG-A002-01 | Colorectum | rectum adenocarcinoma | Male | <65 | I/II | Unknown | Unknown | SD |
| Page: 1 2 3 4 5 6 |
Top |
Related drugs of malignant transformation related genes |
| Identification of chemicals and drugs interact with genes involved in malignant transfromation |
| (DGIdb 4.0) |
| Entrez ID | Symbol | Category | Interaction Types | Drug Claim Name | Drug Name | PMIDs |
| Page: 1 |

Copyright 2023-Present -The University of Texas Health Science Center at Houston |