
|
|||||
|
 | |
| |
| |
| |
| |
| |
|
Gene: TBXAS1 |
Gene summary for TBXAS1 |
| Gene information | Species | Human | Gene symbol | TBXAS1 | Gene ID | 6916 |
| Gene name | thromboxane A synthase 1 | |
| Gene Alias | BDPLT14 | |
| Cytomap | 7q34 | |
| Gene Type | protein-coding | GO ID | GO:0001516 | UniProtAcc | P24557 |
Top |
Malignant transformation analysis |
| Identification of the aberrant gene expression in precancerous and cancerous lesions by comparing the gene expression of stem-like cells in diseased tissues with normal stem cells |
| Entrez ID | Symbol | Replicates | Species | Organ | Tissue | Adj P-value | Log2FC | Malignancy |
| 6916 | TBXAS1 | HTA11_1938_2000001011 | Human | Colorectum | AD | 1.97e-11 | 4.44e-01 | -0.0811 |
| 6916 | TBXAS1 | HTA11_78_2000001011 | Human | Colorectum | AD | 2.57e-09 | 4.33e-01 | -0.1088 |
| 6916 | TBXAS1 | HTA11_347_2000001011 | Human | Colorectum | AD | 4.15e-05 | 2.82e-01 | -0.1954 |
| 6916 | TBXAS1 | HTA11_696_2000001011 | Human | Colorectum | AD | 1.74e-08 | 3.62e-01 | -0.1464 |
| 6916 | TBXAS1 | HTA11_1391_2000001011 | Human | Colorectum | AD | 5.70e-12 | 4.52e-01 | -0.059 |
| 6916 | TBXAS1 | HTA11_546_2000001011 | Human | Colorectum | AD | 2.62e-03 | 3.06e-01 | -0.0842 |
| 6916 | TBXAS1 | HTA11_866_3004761011 | Human | Colorectum | AD | 6.75e-12 | 4.04e-01 | 0.096 |
| 6916 | TBXAS1 | HTA11_4255_2000001011 | Human | Colorectum | SER | 3.22e-03 | 5.70e-01 | 0.0446 |
| 6916 | TBXAS1 | HTA11_7696_3000711011 | Human | Colorectum | AD | 6.11e-04 | 3.16e-01 | 0.0674 |
| 6916 | TBXAS1 | HTA11_6818_2000001011 | Human | Colorectum | AD | 9.85e-05 | 3.75e-01 | 0.0112 |
| 6916 | TBXAS1 | HTA11_6818_2000001021 | Human | Colorectum | AD | 2.13e-33 | 1.15e+00 | 0.0588 |
| 6916 | TBXAS1 | HTA11_99999970781_79442 | Human | Colorectum | MSS | 1.22e-16 | 4.74e-01 | 0.294 |
| 6916 | TBXAS1 | HTA11_99999965104_69814 | Human | Colorectum | MSS | 1.91e-16 | 6.13e-01 | 0.281 |
| 6916 | TBXAS1 | HTA11_99999971662_82457 | Human | Colorectum | MSS | 9.48e-11 | 5.25e-01 | 0.3859 |
| 6916 | TBXAS1 | HTA11_99999973899_84307 | Human | Colorectum | MSS | 9.35e-05 | 3.04e-01 | 0.2585 |
| 6916 | TBXAS1 | A002-C-010 | Human | Colorectum | FAP | 3.51e-07 | 4.39e-01 | 0.242 |
| 6916 | TBXAS1 | A015-C-203 | Human | Colorectum | FAP | 2.74e-03 | 3.18e-01 | -0.1294 |
| 6916 | TBXAS1 | A002-C-201 | Human | Colorectum | FAP | 3.88e-03 | 3.60e-01 | 0.0324 |
| 6916 | TBXAS1 | A002-C-203 | Human | Colorectum | FAP | 8.75e-34 | 8.94e-01 | 0.2786 |
| 6916 | TBXAS1 | A001-C-108 | Human | Colorectum | FAP | 1.42e-03 | 3.59e-01 | -0.0272 |
| Page: 1 2 |
| Tissue | Expression Dynamics | Abbreviation |
| Colorectum (GSE201348) | 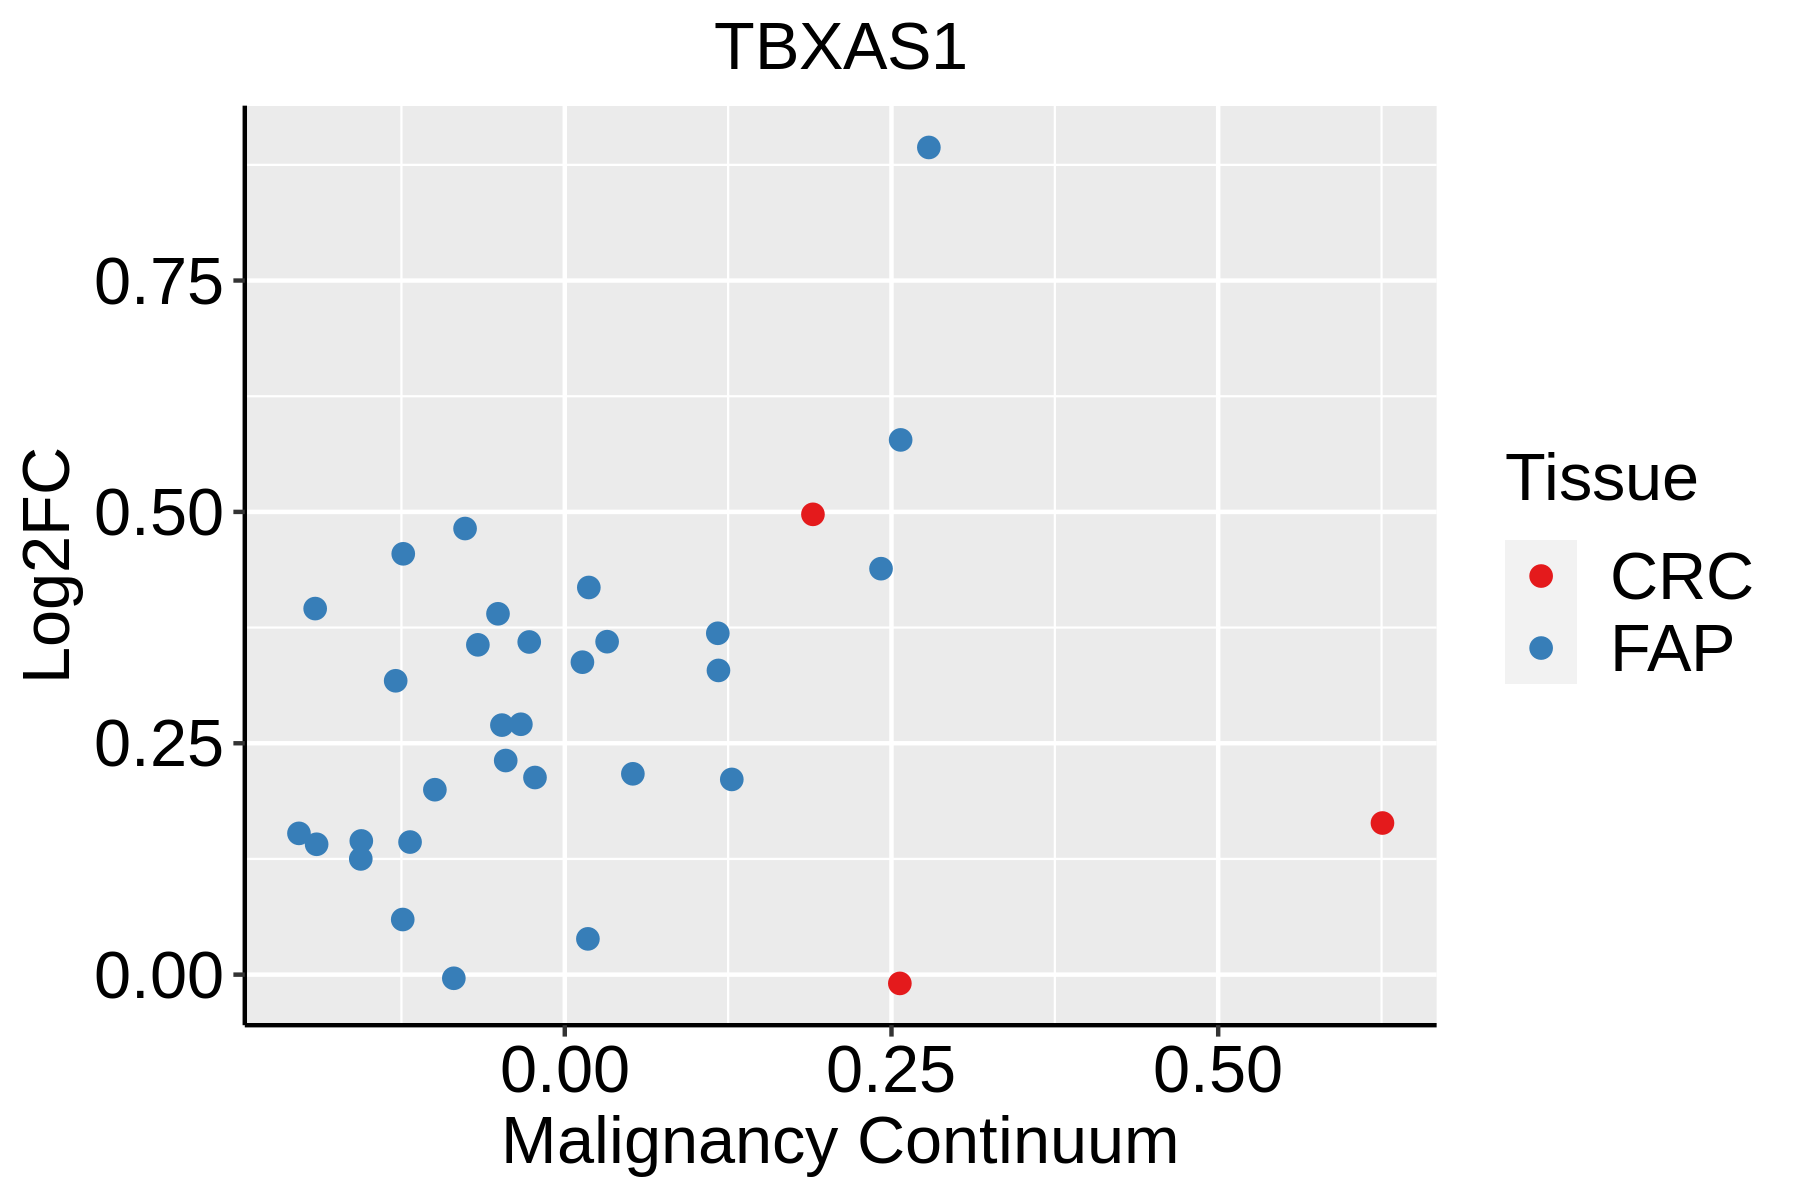 | FAP: Familial adenomatous polyposis |
| CRC: Colorectal cancer | ||
| Colorectum (HTA11) |  | AD: Adenomas |
| SER: Sessile serrated lesions | ||
| MSI-H: Microsatellite-high colorectal cancer | ||
| MSS: Microsatellite stable colorectal cancer |
| ∗log2FC in expression of this searched gene in stem-like cells from each diseased tissue sample relative to stem-like cells in normal samples in each tissue plotted against the malignancy continuum. Samples are colored based on if they are from different disease stage. |
Top |
Malignant transformation related pathway analysis |
| Find out the enriched GO biological processes and KEGG pathways involved in transition from healthy to precancer to cancer |
| Tissue | Disease Stage | Enriched GO biological Processes |
| Colorectum | AD |  |
| Colorectum | SER |  |
| Colorectum | MSS |  |
| Colorectum | MSI-H |  |
| Colorectum | FAP |  |
| ∗Top 15 enriched GO BP terms are showed in the bar plot of each disease state in each tissue. Each row represents a significant GO biological process which is colored according to the -log10(p.adjust). |
| Page: 1 2 3 4 5 6 7 8 9 |
| GO ID | Tissue | Disease Stage | Description | Gene Ratio | Bg Ratio | pvalue | p.adjust | Count |
| GO:0006631 | Colorectum | AD | fatty acid metabolic process | 114/3918 | 390/18723 | 5.58e-05 | 9.44e-04 | 114 |
| GO:0097305 | Colorectum | AD | response to alcohol | 71/3918 | 253/18723 | 4.01e-03 | 2.80e-02 | 71 |
| GO:00066311 | Colorectum | SER | fatty acid metabolic process | 79/2897 | 390/18723 | 6.34e-03 | 4.56e-02 | 79 |
| GO:00973051 | Colorectum | MSS | response to alcohol | 66/3467 | 253/18723 | 1.73e-03 | 1.54e-02 | 66 |
| GO:00066312 | Colorectum | MSS | fatty acid metabolic process | 95/3467 | 390/18723 | 2.20e-03 | 1.84e-02 | 95 |
| GO:0070542 | Colorectum | MSS | response to fatty acid | 21/3467 | 64/18723 | 4.39e-03 | 3.11e-02 | 21 |
| GO:0046394 | Colorectum | MSS | carboxylic acid biosynthetic process | 76/3467 | 314/18723 | 6.71e-03 | 4.38e-02 | 76 |
| GO:0016053 | Colorectum | MSS | organic acid biosynthetic process | 76/3467 | 316/18723 | 7.88e-03 | 4.84e-02 | 76 |
| GO:00066313 | Colorectum | FAP | fatty acid metabolic process | 81/2622 | 390/18723 | 1.43e-04 | 2.24e-03 | 81 |
| GO:00973053 | Colorectum | FAP | response to alcohol | 55/2622 | 253/18723 | 5.05e-04 | 5.78e-03 | 55 |
| GO:0003018 | Colorectum | FAP | vascular process in circulatory system | 56/2622 | 263/18723 | 7.67e-04 | 8.12e-03 | 56 |
| GO:00066314 | Colorectum | CRC | fatty acid metabolic process | 65/2078 | 390/18723 | 5.30e-04 | 7.42e-03 | 65 |
| GO:00030181 | Colorectum | CRC | vascular process in circulatory system | 45/2078 | 263/18723 | 2.10e-03 | 2.08e-02 | 45 |
| GO:00973054 | Colorectum | CRC | response to alcohol | 43/2078 | 253/18723 | 2.96e-03 | 2.66e-02 | 43 |
| GO:1903522 | Colorectum | CRC | regulation of blood circulation | 43/2078 | 256/18723 | 3.70e-03 | 3.12e-02 | 43 |
| Page: 1 |
| Pathway ID | Tissue | Disease Stage | Description | Gene Ratio | Bg Ratio | pvalue | p.adjust | qvalue | Count |
| hsa04611 | Colorectum | FAP | Platelet activation | 32/1404 | 124/8465 | 5.67e-03 | 2.18e-02 | 1.32e-02 | 32 |
| hsa046111 | Colorectum | FAP | Platelet activation | 32/1404 | 124/8465 | 5.67e-03 | 2.18e-02 | 1.32e-02 | 32 |
| Page: 1 |
Top |
Cell-cell communication analysis |
| Identification of potential cell-cell interactions between two cell types and their ligand-receptor pairs for different disease states |
| Ligand | Receptor | LRpair | Pathway | Tissue | Disease Stage |
| Page: 1 |
Top |
Single-cell gene regulatory network inference analysis |
| Find out the significant the regulons (TFs) and the target genes of each regulon across cell types for different disease states |
| TF | Cell Type | Tissue | Disease Stage | Target Gene | RSS | Regulon Activity |
| ∗The dot plots of a searched regulon are shown for all cell subpopulations in each disease state of each tissue based on the regulon specific score inferred using pySCENIC and by calculating the average expression. |
| Page: 1 |
Top |
Somatic mutation of malignant transformation related genes |
| Annotation of somatic variants for genes involved in malignant transformation |
| Hugo Symbol | Variant Class | Variant Classification | dbSNP RS | HGVSc | HGVSp | HGVSp Short | SWISSPROT | BIOTYPE | SIFT | PolyPhen | Tumor Sample Barcode | Tissue | Histology | Sex | Age | Stage | Therapy Types | Drugs | Outcome |
| TBXAS1 | SNV | Missense_Mutation | c.1123N>C | p.Val375Leu | p.V375L | protein_coding | tolerated(0.2) | benign(0.046) | TCGA-A1-A0SO-01 | Breast | breast invasive carcinoma | Female | >=65 | I/II | Chemotherapy | SD | |||
| TBXAS1 | SNV | Missense_Mutation | novel | c.349G>C | p.Glu117Gln | p.E117Q | protein_coding | tolerated(0.49) | probably_damaging(0.959) | TCGA-A8-A08R-01 | Breast | breast invasive carcinoma | Female | <65 | I/II | Unknown | Unknown | SD | |
| TBXAS1 | SNV | Missense_Mutation | rs6952940 | c.544N>T | p.Pro182Ser | p.P182S | protein_coding | tolerated_low_confidence(0.77) | benign(0.003) | TCGA-AC-A3BB-01 | Breast | breast invasive carcinoma | Female | <65 | III/IV | Chemotherapy | cytoxan | CR | |
| TBXAS1 | SNV | Missense_Mutation | rs6952940 | c.544C>T | p.Pro182Ser | p.P182S | protein_coding | tolerated_low_confidence(0.77) | benign(0.003) | TCGA-AC-A3TM-01 | Breast | breast invasive carcinoma | Female | <65 | III/IV | Chemotherapy | cytoxan | CR | |
| TBXAS1 | SNV | Missense_Mutation | novel | c.1381G>A | p.Ala461Thr | p.A461T | protein_coding | tolerated(0.18) | benign(0.078) | TCGA-AN-A046-01 | Breast | breast invasive carcinoma | Female | >=65 | I/II | Unknown | Unknown | SD | |
| TBXAS1 | SNV | Missense_Mutation | novel | c.1672N>A | p.Pro558Thr | p.P558T | protein_coding | deleterious(0) | probably_damaging(1) | TCGA-AN-A0FX-01 | Breast | breast invasive carcinoma | Female | <65 | I/II | Unknown | Unknown | SD | |
| TBXAS1 | SNV | Missense_Mutation | novel | c.559N>A | p.Val187Met | p.V187M | protein_coding | tolerated_low_confidence(0.08) | benign(0) | TCGA-AO-A128-01 | Breast | breast invasive carcinoma | Female | <65 | I/II | Chemotherapy | doxorubicin | SD | |
| TBXAS1 | SNV | Missense_Mutation | c.716G>A | p.Ser239Asn | p.S239N | protein_coding | deleterious(0) | probably_damaging(1) | TCGA-BH-A0HF-01 | Breast | breast invasive carcinoma | Female | >=65 | I/II | Hormone Therapy | arimidex | SD | ||
| TBXAS1 | SNV | Missense_Mutation | novel | c.719N>C | p.Val240Ala | p.V240A | protein_coding | tolerated(0.15) | possibly_damaging(0.747) | TCGA-OL-A66L-01 | Breast | breast invasive carcinoma | Female | >=65 | I/II | Unknown | Unknown | SD | |
| TBXAS1 | insertion | Frame_Shift_Ins | novel | c.1188_1189insAGGCTGGGGTGCAGTAGAGCTGCAAAGGTGTCAGCAG | p.Leu397ArgfsTer25 | p.L397Rfs*25 | protein_coding | TCGA-AN-A04C-01 | Breast | breast invasive carcinoma | Female | <65 | I/II | Unknown | Unknown | SD |
| Page: 1 2 3 4 5 6 7 8 |
Top |
Related drugs of malignant transformation related genes |
| Identification of chemicals and drugs interact with genes involved in malignant transfromation |
| (DGIdb 4.0) |
| Entrez ID | Symbol | Category | Interaction Types | Drug Claim Name | Drug Name | PMIDs |
| 6916 | TBXAS1 | DRUGGABLE GENOME, CYTOCHROME P450, ENZYME | NV-52 | |||
| 6916 | TBXAS1 | DRUGGABLE GENOME, CYTOCHROME P450, ENZYME | E-6700 | |||
| 6916 | TBXAS1 | DRUGGABLE GENOME, CYTOCHROME P450, ENZYME | EV-077 | |||
| 6916 | TBXAS1 | DRUGGABLE GENOME, CYTOCHROME P450, ENZYME | aspirin | ASPIRIN | 21449675 | |
| 6916 | TBXAS1 | DRUGGABLE GENOME, CYTOCHROME P450, ENZYME | PYRIDINE | PYRIDINE | ||
| 6916 | TBXAS1 | DRUGGABLE GENOME, CYTOCHROME P450, ENZYME | inhibitor | 363894160 | OZAGREL | |
| 6916 | TBXAS1 | DRUGGABLE GENOME, CYTOCHROME P450, ENZYME | ONO-1301 | |||
| 6916 | TBXAS1 | DRUGGABLE GENOME, CYTOCHROME P450, ENZYME | inhibitor | 252827453 | ||
| 6916 | TBXAS1 | DRUGGABLE GENOME, CYTOCHROME P450, ENZYME | NV-52 | |||
| 6916 | TBXAS1 | DRUGGABLE GENOME, CYTOCHROME P450, ENZYME | PMA | 7488650 |
| Page: 1 2 |

Copyright 2023-Present -The University of Texas Health Science Center at Houston |