Schematic overview of the cellular and molecular mechanisms involved in the cancer progression, including the proposed cellular and molecular mechanisms in cancer cells trajectory. AT1: alveolar type 1 cells; AT2: alveolar type 2 cells; AAH: atypical adenomatous hyperplasia; AIS: adenocarcinoma in situ; MIA: minimally invasive adenocarcinoma; IA: invasive adenocarcinoma; EMT: epithelial-mesenchymal transition

Home

Download

Statistics

Help

Contact

Center for Computational Systems Medicine
leaf

Gene summary

leaf

Malignant transformation analysis

leaf

Malignant transformation related pathway analysis

leaf

Cell-cell communication analysis

leaf

Single-cell gene regulatory network inference analysis

leaf

Somatic mutation of malignant transformation related genes

leaf

Related drugs of malignant transformation related genes

Gene: TBX3

Gene summary for TBX3

check button Gene summary.

Gene informationSpeciesHuman
Gene symbol

TBX3

Gene ID

6926

Gene nameT-box transcription factor 3
Gene AliasTBX3-ISO
Cytomap12q24.21
Gene Typeprotein-coding
GO ID

GO:0000003

UniProtAcc

A0A024RBQ4


Top

Malignant transformation analysis

check button Identification of the aberrant gene expression in precancerous and cancerous lesions by comparing the gene expression of stem-like cells in diseased tissues with normal stem cells
check button Malignant transformation involving gene list.
Entrez IDSymbolReplicatesSpeciesOrganTissueAdj P-valueLog2FCMalignancy
6926TBX3HTA11_1391_2000001011HumanColorectumAD3.20e-044.17e-01-0.059
6926TBX3HTA11_866_3004761011HumanColorectumAD8.09e-083.59e-010.096
6926TBX3HTA11_7696_3000711011HumanColorectumAD1.06e-093.39e-010.0674
6926TBX3HTA11_99999970781_79442HumanColorectumMSS2.04e-296.06e-010.294
6926TBX3HTA11_99999971662_82457HumanColorectumMSS2.00e-052.27e-010.3859
6926TBX3A002-C-010HumanColorectumFAP3.54e-064.34e-010.242
6926TBX3A001-C-207HumanColorectumFAP9.07e-085.93e-010.1278
6926TBX3A015-C-203HumanColorectumFAP3.08e-156.13e-01-0.1294
6926TBX3A002-C-201HumanColorectumFAP9.26e-064.85e-010.0324
6926TBX3A002-C-203HumanColorectumFAP1.43e-094.66e-010.2786
6926TBX3A001-C-108HumanColorectumFAP8.11e-084.46e-01-0.0272
6926TBX3A002-C-021HumanColorectumFAP2.61e-256.14e-010.1171
6926TBX3A001-C-104HumanColorectumFAP9.17e-175.19e-010.0184
6926TBX3A015-C-106HumanColorectumFAP1.81e-115.69e-01-0.0511
6926TBX3A015-C-104HumanColorectumFAP7.09e-104.87e-01-0.1899
6926TBX3A001-C-014HumanColorectumFAP2.29e-084.95e-010.0135
6926TBX3A014-C-008HumanColorectumFAP1.16e-045.31e-01-0.191
6926TBX3A018-E-020HumanColorectumFAP4.02e-023.79e-01-0.2034
6926TBX3F072BHumanColorectumFAP1.06e-023.11e-010.257
6926TBX3AEH-subject1HumanEndometriumAEH1.22e-10-4.04e-01-0.3059
Page: 1 2 3 4 5 6 7 

check button Transcriptomic changes along malignancy continuum.
TissueExpression DynamicsAbbreviation
Colorectum (GSE201348)The image shows the transcriptomic changes along malignancy continuum.log2FC in expression of this searched gene in stem-like cells from each diseased tissue sample relative to stem-like cells in normal samples in each tissue plotted against the malignancy continuum. Samples are colored based on if they are from different disease stage.FAP: Familial adenomatous polyposis
CRC: Colorectal cancer
Colorectum (HTA11)The image shows the transcriptomic changes along malignancy continuum.log2FC in expression of this searched gene in stem-like cells from each diseased tissue sample relative to stem-like cells in normal samples in each tissue plotted against the malignancy continuum. Samples are colored based on if they are from different disease stage.AD: Adenomas
SER: Sessile serrated lesions
MSI-H: Microsatellite-high colorectal cancer
MSS: Microsatellite stable colorectal cancer
EndometriumThe image shows the transcriptomic changes along malignancy continuum.log2FC in expression of this searched gene in stem-like cells from each diseased tissue sample relative to stem-like cells in normal samples in each tissue plotted against the malignancy continuum. Samples are colored based on if they are from different disease stage.
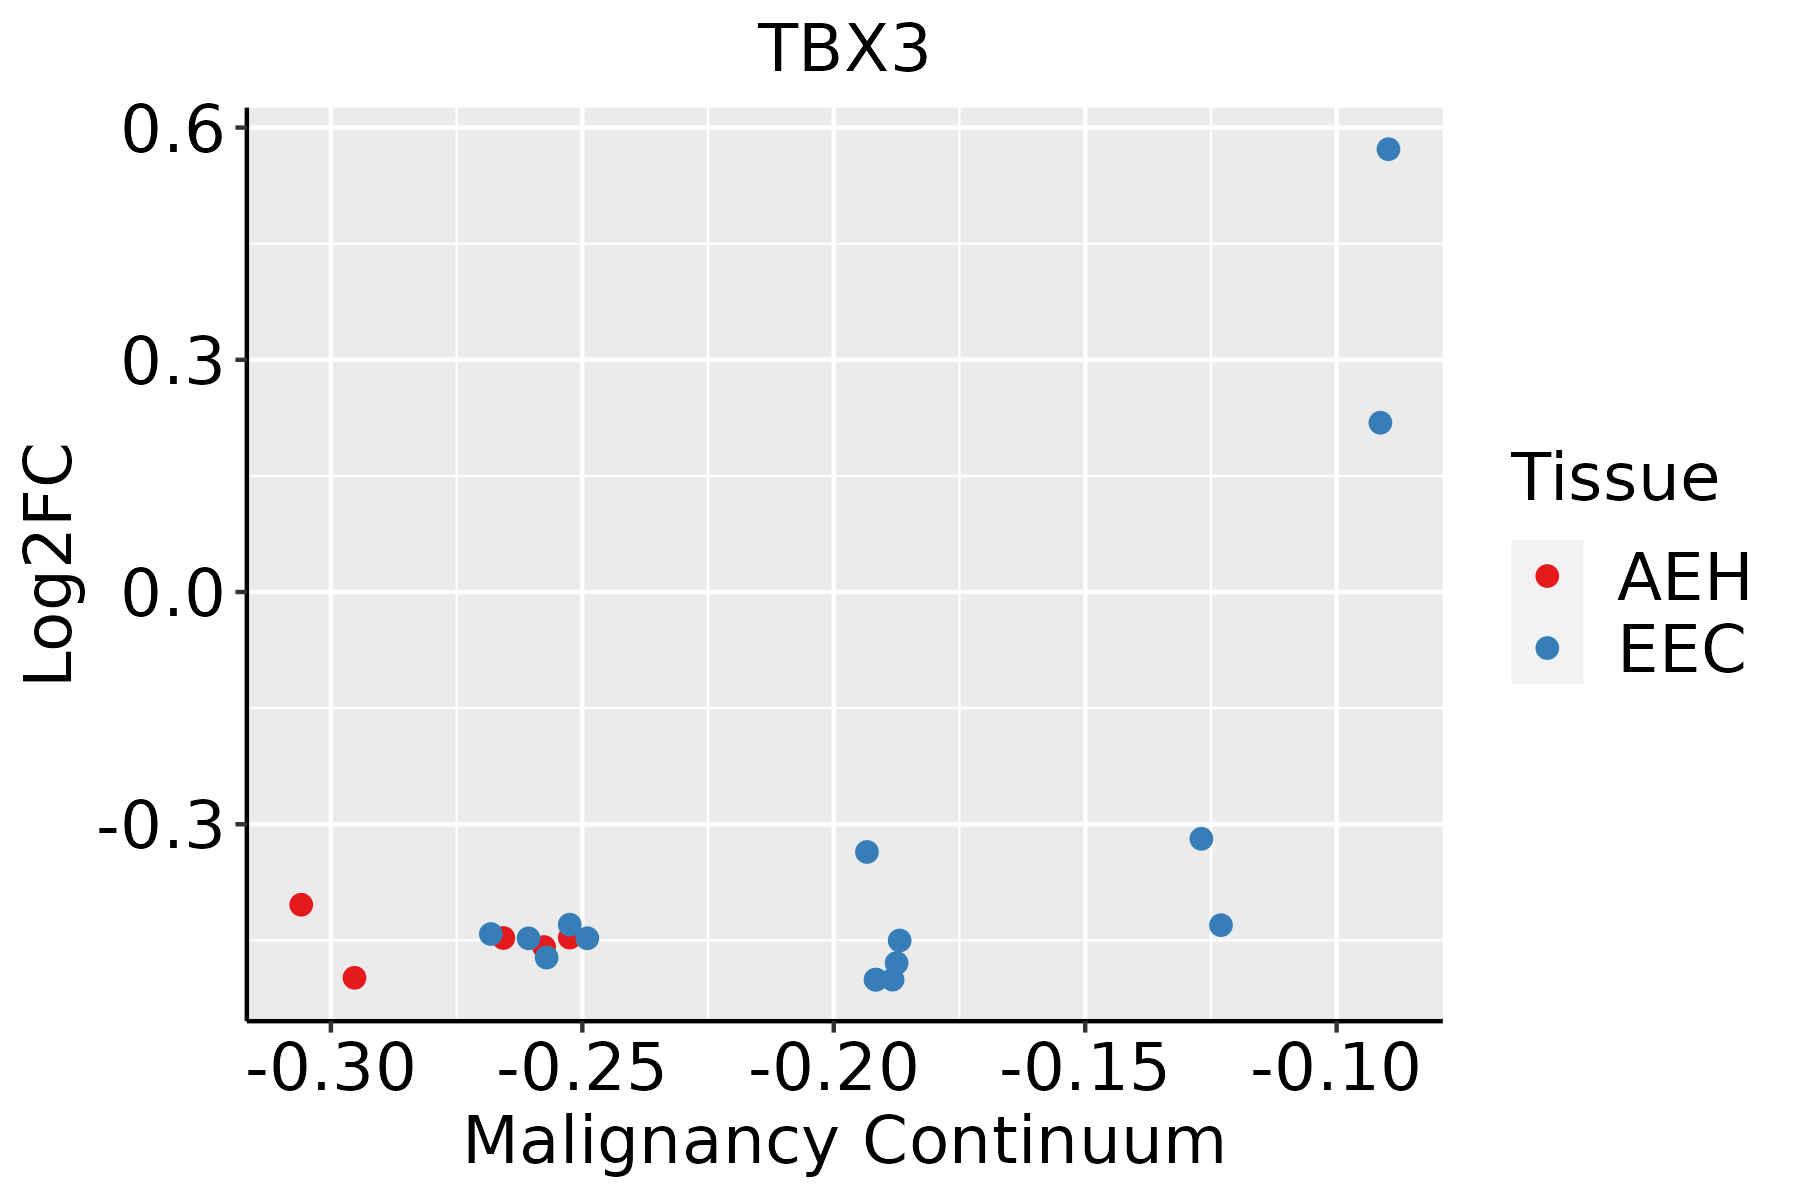
AEH: Atypical endometrial hyperplasia
EEC: Endometrioid Cancer
EsophagusThe image shows the transcriptomic changes along malignancy continuum.log2FC in expression of this searched gene in stem-like cells from each diseased tissue sample relative to stem-like cells in normal samples in each tissue plotted against the malignancy continuum. Samples are colored based on if they are from different disease stage.ESCC: Esophageal squamous cell carcinoma
HGIN: High-grade intraepithelial neoplasias
LGIN: Low-grade intraepithelial neoplasias
LiverThe image shows the transcriptomic changes along malignancy continuum.log2FC in expression of this searched gene in stem-like cells from each diseased tissue sample relative to stem-like cells in normal samples in each tissue plotted against the malignancy continuum. Samples are colored based on if they are from different disease stage.HCC: Hepatocellular carcinoma
NAFLD: Non-alcoholic fatty liver disease
ProstateThe image shows the transcriptomic changes along malignancy continuum.log2FC in expression of this searched gene in stem-like cells from each diseased tissue sample relative to stem-like cells in normal samples in each tissue plotted against the malignancy continuum. Samples are colored based on if they are from different disease stage.
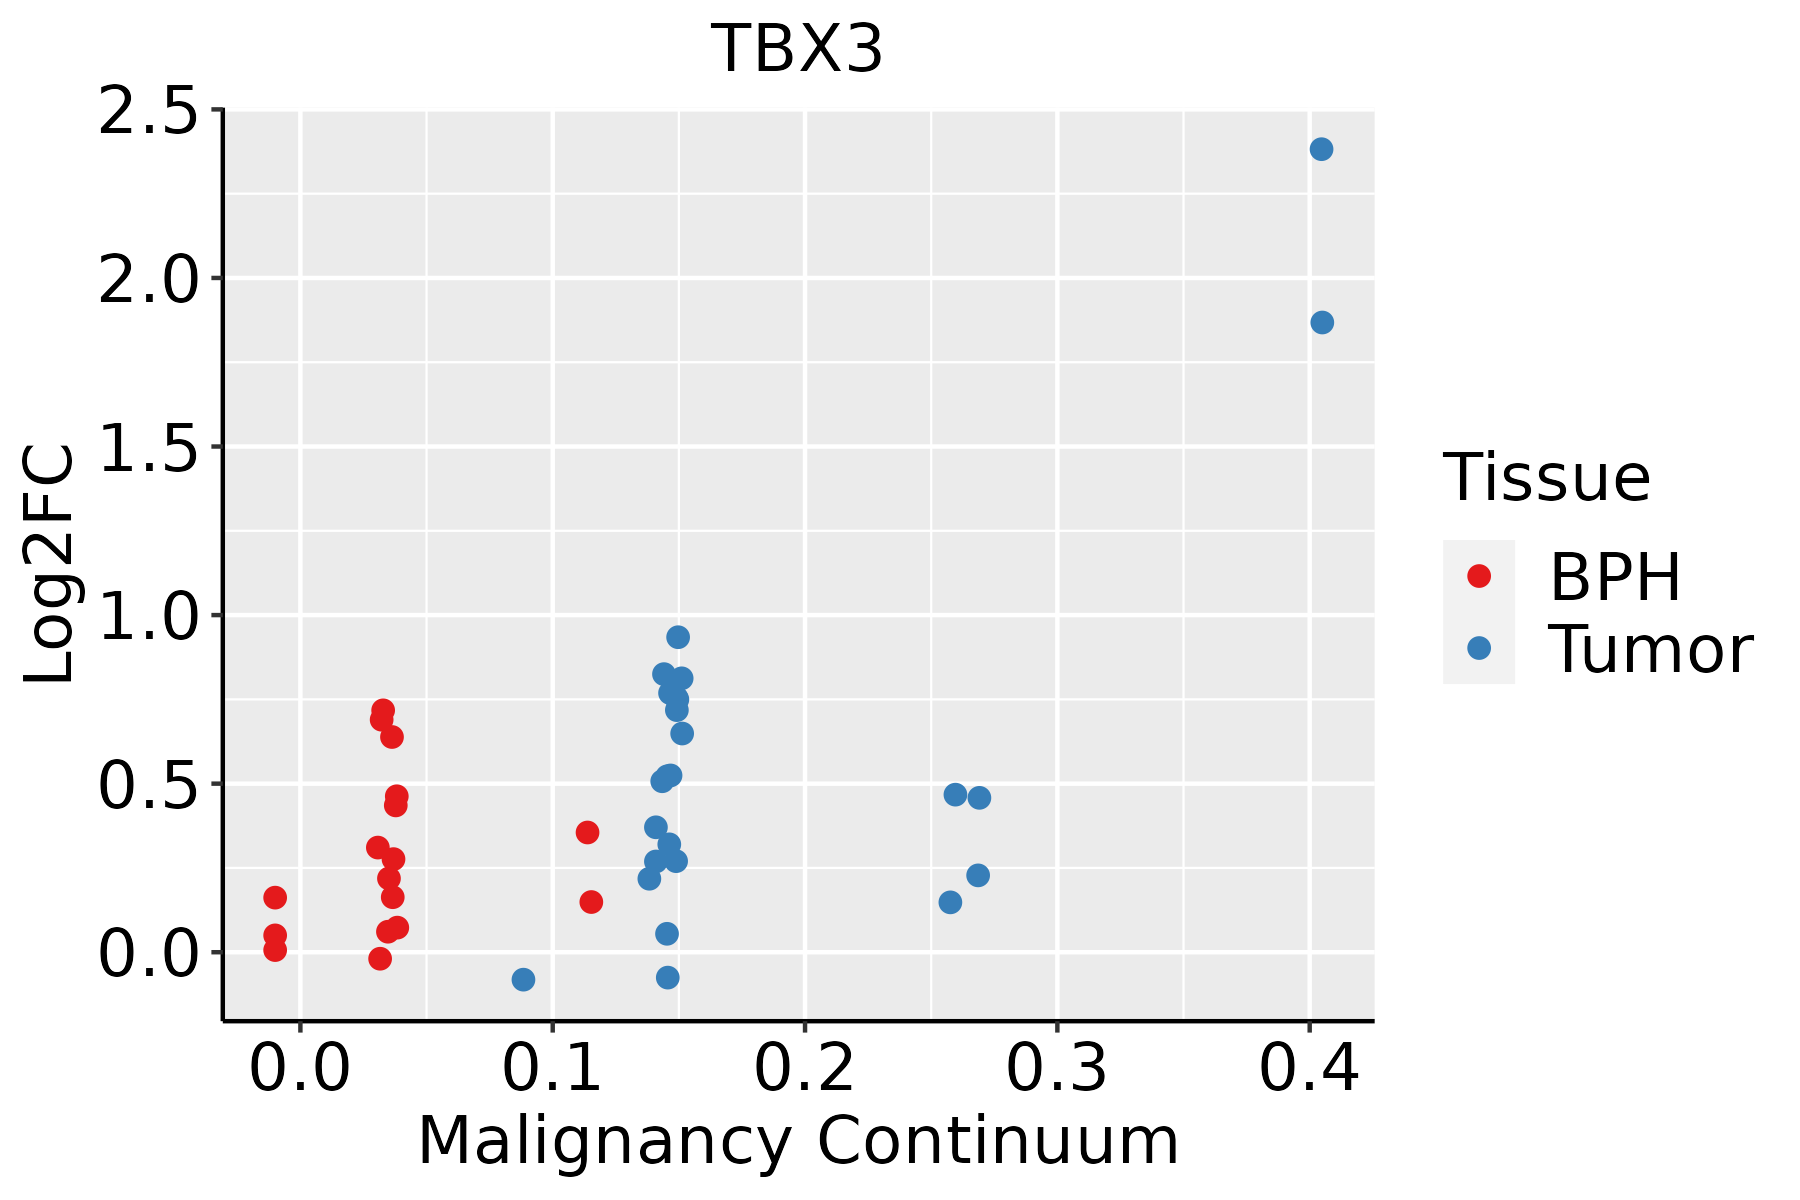
BPH: Benign Prostatic Hyperplasia
ThyroidThe image shows the transcriptomic changes along malignancy continuum.log2FC in expression of this searched gene in stem-like cells from each diseased tissue sample relative to stem-like cells in normal samples in each tissue plotted against the malignancy continuum. Samples are colored based on if they are from different disease stage.ATC: Anaplastic thyroid cancer
HT: Hashimoto's thyroiditis
PTC: Papillary thyroid cancer
∗log2FC in expression of this searched gene in stem-like cells from each diseased tissue sample relative to stem-like cells in normal samples in each tissue plotted against the malignancy continuum. Samples are colored based on if they are from different disease stage.

Top

Malignant transformation related pathway analysis

check buttonFind out the enriched GO biological processes and KEGG pathways involved in transition from healthy to precancer to cancer
check button Figure of enriched GO biological processes.
TissueDisease StageEnriched GO biological Processes
ColorectumADGO analysis - Figure of enriched GO biological processes: Top 15 enriched GO BP terms are showed in the bar plot of each disease state in each tissue. Each row represents a significant GO biological process which is colored according to the -log10(p.adjust).
ColorectumSERGO analysis - Figure of enriched GO biological processes: Top 15 enriched GO BP terms are showed in the bar plot of each disease state in each tissue. Each row represents a significant GO biological process which is colored according to the -log10(p.adjust).
ColorectumMSSGO analysis - Figure of enriched GO biological processes: Top 15 enriched GO BP terms are showed in the bar plot of each disease state in each tissue. Each row represents a significant GO biological process which is colored according to the -log10(p.adjust).
ColorectumMSI-HGO analysis - Figure of enriched GO biological processes: Top 15 enriched GO BP terms are showed in the bar plot of each disease state in each tissue. Each row represents a significant GO biological process which is colored according to the -log10(p.adjust).
ColorectumFAPGO analysis - Figure of enriched GO biological processes: Top 15 enriched GO BP terms are showed in the bar plot of each disease state in each tissue. Each row represents a significant GO biological process which is colored according to the -log10(p.adjust).
∗Top 15 enriched GO BP terms are showed in the bar plot of each disease state in each tissue. Each row represents a significant GO biological process which is colored according to the -log10(p.adjust).
Page: 1 2 3 4 5 6 7 8 9 

check button Enriched GO biological processes.
GO IDTissueDisease StageDescriptionGene RatioBg Ratiopvaluep.adjustCount
GO:0048732ColorectumADgland development149/3918436/187236.07e-116.33e-09149
GO:0030879ColorectumADmammary gland development53/3918137/187231.46e-064.58e-0553
GO:0001701ColorectumADin utero embryonic development110/3918367/187232.36e-054.62e-04110
GO:0061180ColorectumADmammary gland epithelium development28/391867/187238.74e-051.35e-0328
GO:0022612ColorectumADgland morphogenesis42/3918118/187231.62e-042.23e-0342
GO:0007568ColorectumADaging98/3918339/187232.77e-043.39e-0398
GO:0060562ColorectumADepithelial tube morphogenesis93/3918325/187235.65e-046.00e-0393
GO:0061458ColorectumADreproductive system development116/3918427/187231.11e-031.01e-02116
GO:0060443ColorectumADmammary gland morphogenesis18/391843/187231.51e-031.27e-0218
GO:0048608ColorectumADreproductive structure development114/3918424/187231.78e-031.47e-02114
GO:0048736ColorectumADappendage development51/3918172/187234.20e-032.89e-0251
GO:0060173ColorectumADlimb development51/3918172/187234.20e-032.89e-0251
GO:0048568ColorectumADembryonic organ development112/3918427/187234.60e-033.14e-02112
GO:0045787ColorectumADpositive regulation of cell cycle85/3918313/187234.76e-033.22e-0285
GO:0001763ColorectumADmorphogenesis of a branching structure56/3918196/187236.60e-034.09e-0256
GO:00487322ColorectumMSSgland development143/3467436/187233.85e-138.01e-11143
GO:00308792ColorectumMSSmammary gland development51/3467137/187231.88e-078.26e-0651
GO:00611802ColorectumMSSmammary gland epithelium development28/346767/187238.47e-062.11e-0428
GO:00614582ColorectumMSSreproductive system development115/3467427/187239.86e-062.39e-04115
GO:00486082ColorectumMSSreproductive structure development113/3467424/187231.94e-054.18e-04113
Page: 1 2 3 4 5 6 7 8 9 10 11 12 13 14 15 16 17 18 19 

check button Enriched KEGG pathways.
Pathway IDTissueDisease StageDescriptionGene RatioBg Ratiopvaluep.adjustqvalueCount
Page: 1 

Top

Cell-cell communication analysis

check buttonIdentification of potential cell-cell interactions between two cell types and their ligand-receptor pairs for different disease states
LigandReceptorLRpairPathwayTissueDisease Stage
Page: 1 

Top

Single-cell gene regulatory network inference analysis

check buttonFind out the significant the regulons (TFs) and the target genes of each regulon across cell types for different disease states
TFCell TypeTissueDisease StageTarget GeneRSSRegulon Activity
TBX3TRANSCervixHealthyDSG1,PRRX1,PITX1, etc.2.21e-01The dot plots of a searched regulon are shown for all cell subpopulations in each disease state of each tissue based on the regulon specific score inferred using pySCENIC and by calculating the average expression.
TBX3ECMCervixADJPDGFRA,SSPN,RND3, etc.2.79e-01The dot plots of a searched regulon are shown for all cell subpopulations in each disease state of each tissue based on the regulon specific score inferred using pySCENIC and by calculating the average expression.
TBX3INCAFCervixADJPDGFRA,SSPN,RND3, etc.1.18e-01The dot plots of a searched regulon are shown for all cell subpopulations in each disease state of each tissue based on the regulon specific score inferred using pySCENIC and by calculating the average expression.
TBX3INCAFCervixHealthyPDGFRA,SSPN,RND3, etc.2.09e-01The dot plots of a searched regulon are shown for all cell subpopulations in each disease state of each tissue based on the regulon specific score inferred using pySCENIC and by calculating the average expression.
TBX3STMColorectumFAPCEMIP,SELENBP1,NKD1, etc.1.77e-01The dot plots of a searched regulon are shown for all cell subpopulations in each disease state of each tissue based on the regulon specific score inferred using pySCENIC and by calculating the average expression.
TBX3GLIAColorectumADJLINC01091,UGCG,LRRC59, etc.1.01e-01The dot plots of a searched regulon are shown for all cell subpopulations in each disease state of each tissue based on the regulon specific score inferred using pySCENIC and by calculating the average expression.
TBX3CFIBColorectumCRCLINC01091,UGCG,LRRC59, etc.9.77e-02The dot plots of a searched regulon are shown for all cell subpopulations in each disease state of each tissue based on the regulon specific score inferred using pySCENIC and by calculating the average expression.
TBX3GLIAColorectumFAPLINC01091,UGCG,LRRC59, etc.7.88e-02The dot plots of a searched regulon are shown for all cell subpopulations in each disease state of each tissue based on the regulon specific score inferred using pySCENIC and by calculating the average expression.
TBX3GLIAColorectumHealthyLINC01091,UGCG,LRRC59, etc.4.10e-01The dot plots of a searched regulon are shown for all cell subpopulations in each disease state of each tissue based on the regulon specific score inferred using pySCENIC and by calculating the average expression.
TBX3SURFEndometriumEECVIM,PHLDA1,AKAP12, etc.3.60e-01The dot plots of a searched regulon are shown for all cell subpopulations in each disease state of each tissue based on the regulon specific score inferred using pySCENIC and by calculating the average expression.
∗The dot plots of a searched regulon are shown for all cell subpopulations in each disease state of each tissue based on the regulon specific score inferred using pySCENIC and by calculating the average expression.
Page: 1 2 3 

Top

Somatic mutation of malignant transformation related genes

check buttonAnnotation of somatic variants for genes involved in malignant transformation
Hugo SymbolVariant ClassVariant ClassificationdbSNP RSHGVScHGVSpHGVSp ShortSWISSPROTBIOTYPESIFTPolyPhenTumor Sample BarcodeTissueHistologySexAgeStageTherapy TypesDrugsOutcome
TBX3SNVMissense_Mutationc.400C>Tp.Pro134Serp.P134SO15119protein_codingdeleterious(0)probably_damaging(0.999)TCGA-A2-A25A-01Breastbreast invasive carcinomaFemale<65I/IIUnspecificCytoxanSD
TBX3SNVMissense_Mutationrs756408358c.632A>Cp.Asn211Thrp.N211TO15119protein_codingdeleterious(0)probably_damaging(0.987)TCGA-A8-A08C-01Breastbreast invasive carcinomaFemale>=65I/IIChemotherapy5-fluorouracilCR
TBX3SNVMissense_Mutationnovelc.2158N>Ap.Glu720Lysp.E720KO15119protein_codingdeleterious(0)probably_damaging(0.972)TCGA-AN-A046-01Breastbreast invasive carcinomaFemale>=65I/IIUnknownUnknownSD
TBX3SNVMissense_Mutationc.1949C>Tp.Pro650Leup.P650LO15119protein_codingdeleterious(0)benign(0)TCGA-AO-A128-01Breastbreast invasive carcinomaFemale<65I/IIChemotherapydoxorubicinSD
TBX3SNVMissense_Mutationnovelc.477N>Gp.Asp159Glup.D159EO15119protein_codingdeleterious(0)probably_damaging(0.981)TCGA-AQ-A7U7-01Breastbreast invasive carcinomaFemale<65III/IVTargeted Molecular therapyrituximabCR
TBX3SNVMissense_Mutationrs767500073c.1693N>Ap.Ala565Thrp.A565TO15119protein_codingtolerated(0.21)benign(0.003)TCGA-AR-A2LR-01Breastbreast invasive carcinomaFemale<65I/IIChemotherapyadriamycinSD
TBX3SNVMissense_Mutationnovelc.559C>Tp.His187Tyrp.H187YO15119protein_codingdeleterious(0)probably_damaging(0.997)TCGA-BH-A0HQ-01Breastbreast invasive carcinomaFemale<65I/IIHormone TherapyarimidexSD
TBX3SNVMissense_Mutationnovelc.559N>Tp.His187Tyrp.H187YO15119protein_codingdeleterious(0)probably_damaging(0.997)TCGA-D8-A1X6-01Breastbreast invasive carcinomaFemale>=65III/IVHormone TherapytamoxiphenSD
TBX3SNVMissense_Mutationc.1088C>Gp.Ser363Trpp.S363WO15119protein_codingdeleterious(0)probably_damaging(0.975)TCGA-E2-A15M-01Breastbreast invasive carcinomaFemale>=65I/IIHormone TherapyarimidexSD
TBX3SNVMissense_Mutationc.337N>Cp.Trp113Argp.W113RO15119protein_codingdeleterious(0)probably_damaging(0.999)TCGA-E2-A1IF-01Breastbreast invasive carcinomaFemale>=65I/IIHormone TherapyarimidexSD
Page: 1 2 3 4 5 6 7 8 9 10 11 12 13 14 

Top

Related drugs of malignant transformation related genes

check buttonIdentification of chemicals and drugs interact with genes involved in malignant transfromation
(DGIdb 4.0)
Entrez IDSymbolCategoryInteraction TypesDrug Claim NameDrug NamePMIDs
Page: 1